5580
Accurate High Dynamic Range Displacement Measurement in MR Elastography Using a Simultaneous Dual-Sensitivity AcquisitionYi Sui1, Ziying Yin1, Joshua D. Trzasko1, Armando Manduca1, Kevin J. Glaser1, Richard L. Ehman1, and John Huston III1
1Radiology, Mayo Clinic, Rochester, MN, United States
Synopsis
Phase wrapping in MR Elastography (MRE) limits the dynamic range of the displacement information that can be reliably measured. We developed a novel framework that simultaneously acquires data with 2 levels of motion sensitivity, and processes this data in a manner which increases the dynamic range of the accurately measured displacements by 8-10 times. Both shear wave and large bulk (rigid-body) motion in
Introduction
MR Elastography (MRE) encodes the harmonic motion of tissue into the MR phase signal (1). However, 2π phase wrapping limits the range of the motion that MRE can reliably measure. Though existing image processing algorithms can typically undo spatial wrapping, unwrapping in the temporal dimension with only 4-8 samples (the typical number of phase offsets in MRE experiments) has remained very challenging (2,3). In an application where both small shear-wave (1-10 μm) and large rigid-body (10-50 μm) motions are of interest, the required large dynamic range poses significant challenges for conventional MRE (3). One can perform two separate MRE scans using different motion-encoding gradient (MEG) amplitudes (3) to achieve high and low motion sensitivity. However, this increases the scan time and sacrifices encoding efficiency. In this study, we developed a novel framework that simultaneously acquires dual-motion-sensitivity MRE data and beneficially exploits data redundancies during processing. This framework yields motion measurements whose dynamic range is increased 8-10 times compared to conventional MRE, and enables both shear-wave and large bulk (rigid-body) motion to be characterized in a single scan.Theory
In a standard MRE acquisition with monodirectional encoding, 2 acquisitions are performed with the same MEG amplitude but opposite polarity, and phase-difference images Φ=θ+-θ-are calculated to remove any unwanted background phase and double the motion sensitivity. These images can exhibit substantial phase wraps. In the proposed scheme (Fig. 1), the negative MEG is set to be smaller than the positive MEG. The sum of the two phase images φ=θ++θ- generates a low-sensitivity phase image (no phase wraps) that can be used to estimate and guide the unwrapping of Φ. In practice, the mandatory z-axis, flow-compensation (FC) gradients encode some amount of motion into the low-sensitivity encoded phase φx and φy, resulting in large estimation errors if not corrected. To address this problem, we set ±z MEGs to be equal, but use the z-axis FC gradients to provide the low-motion-sensitivity. The φx and φy images can then be corrected by subtracting out φz . The phase estimation was performed on the first temporal harmonic of the phase offsets, and then projected to each phase offset for unwrapping (Fig. 2).Method
MRE scans were conducted on 3T GE scanners with an 8-channel head coil. A phantom study was performed using 60-Hz vibrations. The negative MEGs were set at 77.7% of the positive MEGs, except for the z MEGs which used the same amplitude for both polarities, resulting in an 8-times ((1+0.777)/(1-0.777)) difference in the motion sensitivity. For validation, low-sensitivity phase images were also acquired from a separate standard MRE scan using small MEGs. The same MEG setup was used for a volunteer study with the following imaging parameters: TR/TE=4000/58.7 ms; FOV=24 cm; 80×80 acquisition matrix reconstructed to 128×128; 48 contiguous 3-mm-thick axial slices; 2×ASSET acceleration; 4 phase offsets, and 3 minutes acquisition time.Results
The phantom results (Fig. 3) showed that both the wrapped high-sensitivity phase images (Fig. 3a) and its wrap-free estimate (Fig. 3b) generated from the low-sensitivity phase images were acquired simultaneously in a single scan. Fig. 3c shows the unwrapped high-sensitivity phase images. The estimated phase closely resembled the unwrapped phase and the reference images from the separate low-sensitivity scan (Fig. 3d). The volunteer results in the axial (Fig. 4) and sagittal (Fig. 5) views demonstrated that the phase wraps can be simply and efficiently eliminated throughout the whole 3D volume. Note that in Fig. 4d, the large displacement at the example voxel was correctly sampled by the low-sensitivity encoding, and was then recovered from the high-sensitivity wrapped phase, which would be very difficult using conventional unwrapping algorithms. The large harmonic motion (7.2π from peak to peak; 3 phase wraps between offsets 1 and 2) can be resolved using as few as 4 phase offsets, and the smaller shear wave (<0.4π, Fig. 4e) was simultaneously detectable with a reasonable SNR.Discussion
The dynamic range of accurate MRE displacement information is significantly increased by the proposed scheme, at the expense of slightly (10-20%) reduced encoding efficiency due to the smaller negative MEG amplitude. The low motion sensitivity in the z-direction currently depends on the slice thickness because the FC gradient changes based on the properties of the slice-selection gradient. In the future, we will further optimize this approach by allowing a small portion of the z-MEG to be always on to compensate for this change.Conclusion
We have developed a dual-sensitivity motion-encoding scheme and demonstrated that it has the capability to increase the dynamic range of the motion that MRE can reliably detect.Acknowledgements
This work was supported by the grant from the National Institute of Health RO1 EB001981.References
- Muthupillai R, Lomas DJ, Rossman PJ, Greenleaf JF, Manduca A, Ehman RL. Magnetic resonance elastography by direct visualization of propagating acoustic strain waves. Science 1995;269(5232):1854-1857.
- Barnhill E, Kennedy P, Johnson CL, Mada M, Roberts N. Real-time 4D phase unwrapping applied to magnetic resonance elastography. Magn Reson Med 2015;73(6):2321-2331.
- Badachhape AA, Okamoto RJ, Durham RS, Efron BD, Nadell SJ, Johnson CL, Bayly PV. The Relationship of Three-Dimensional Human Skull Motion to Brain Tissue Deformation in Magnetic Resonance Elastography Studies. J Biomech Eng 2017;139(5).
Figures
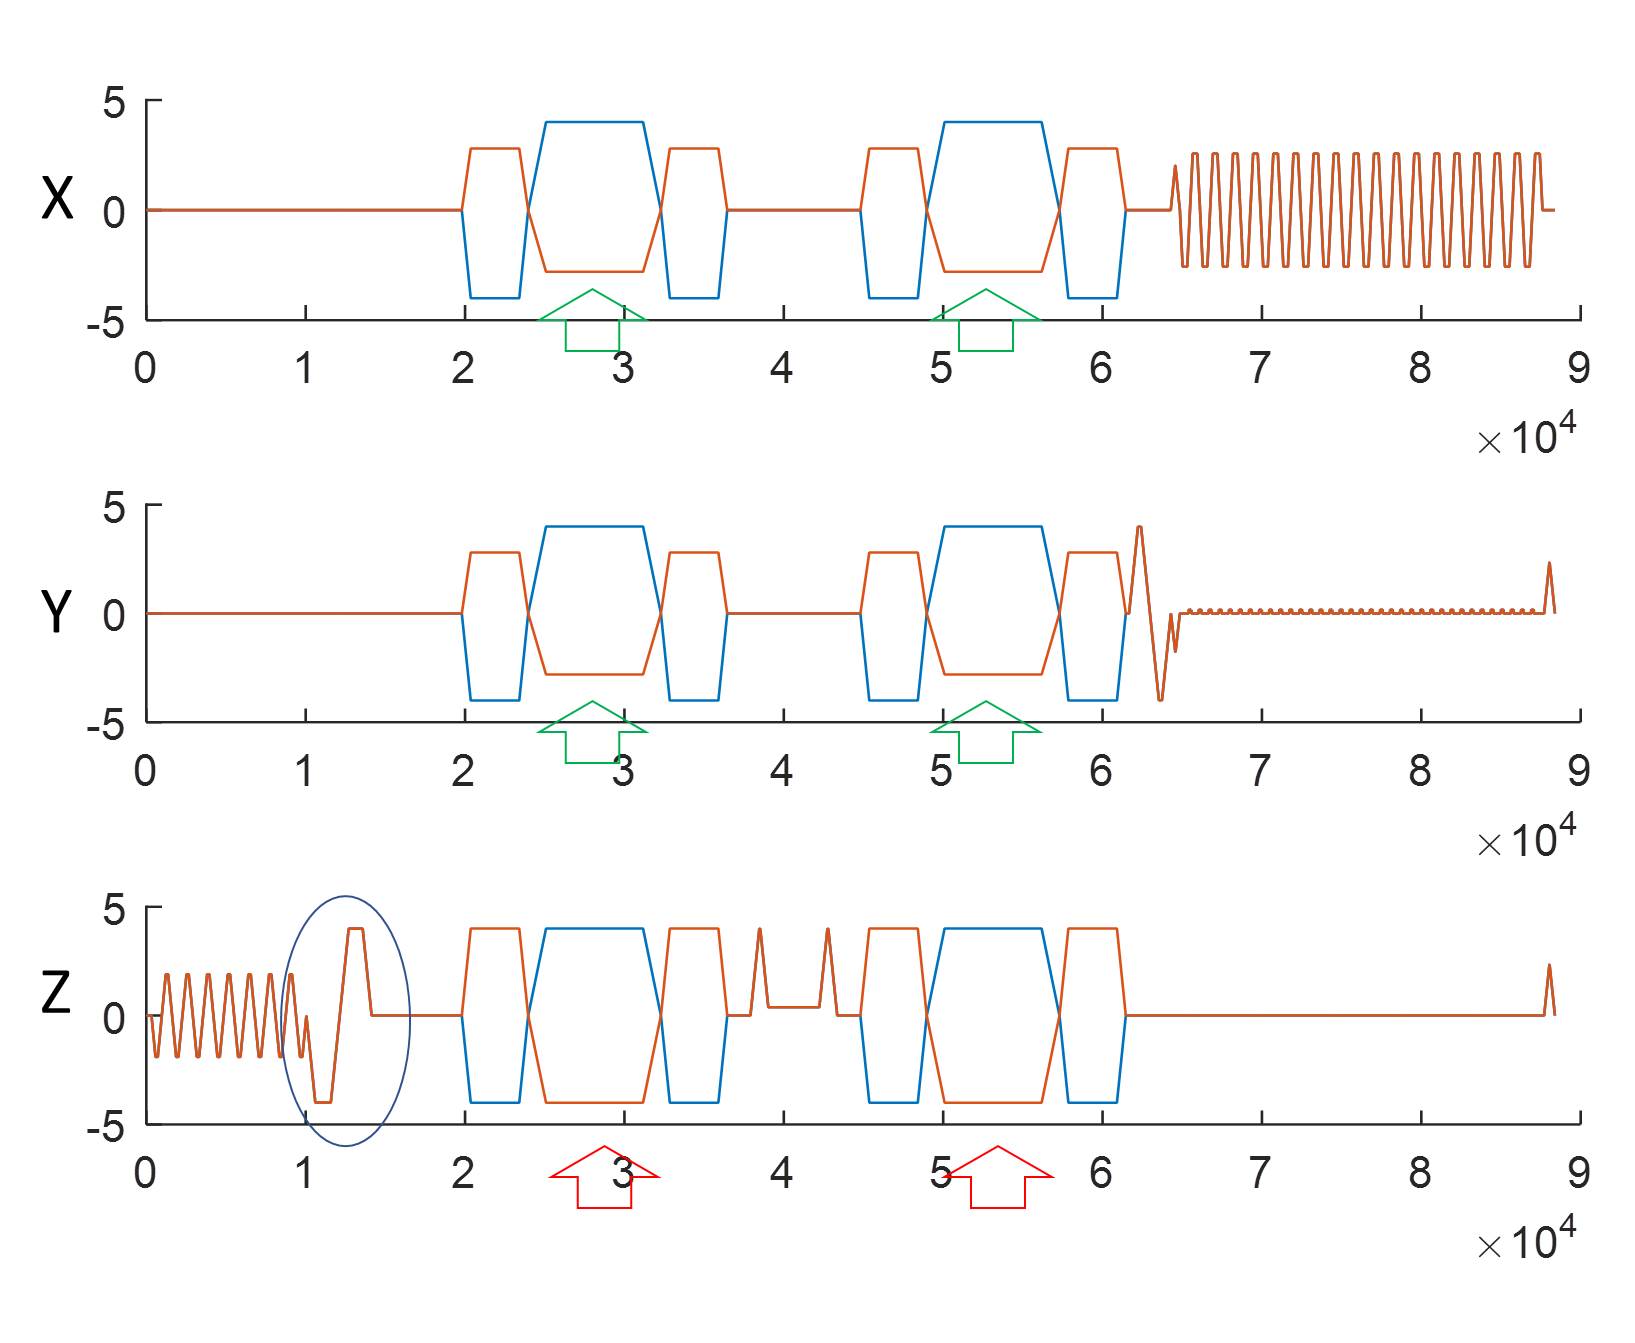
Figure 1. The pulse
sequence diagram of spin-echo (SE) echo-planar-imaging (EPI) MRE incorporating the
dual-sensitivity motion-encoding scheme. The amplitude of the negative motion-encoding
gradients (MEGs) (orange plot) is smaller than the amplitude of the positive
MEGs (blue plot) in the x- and y-directions to create the low-sensitivity
encoding. The z-axis flow-compensation gradient (blue oval) was used for the
low-sensitivity encoding in the z direction.
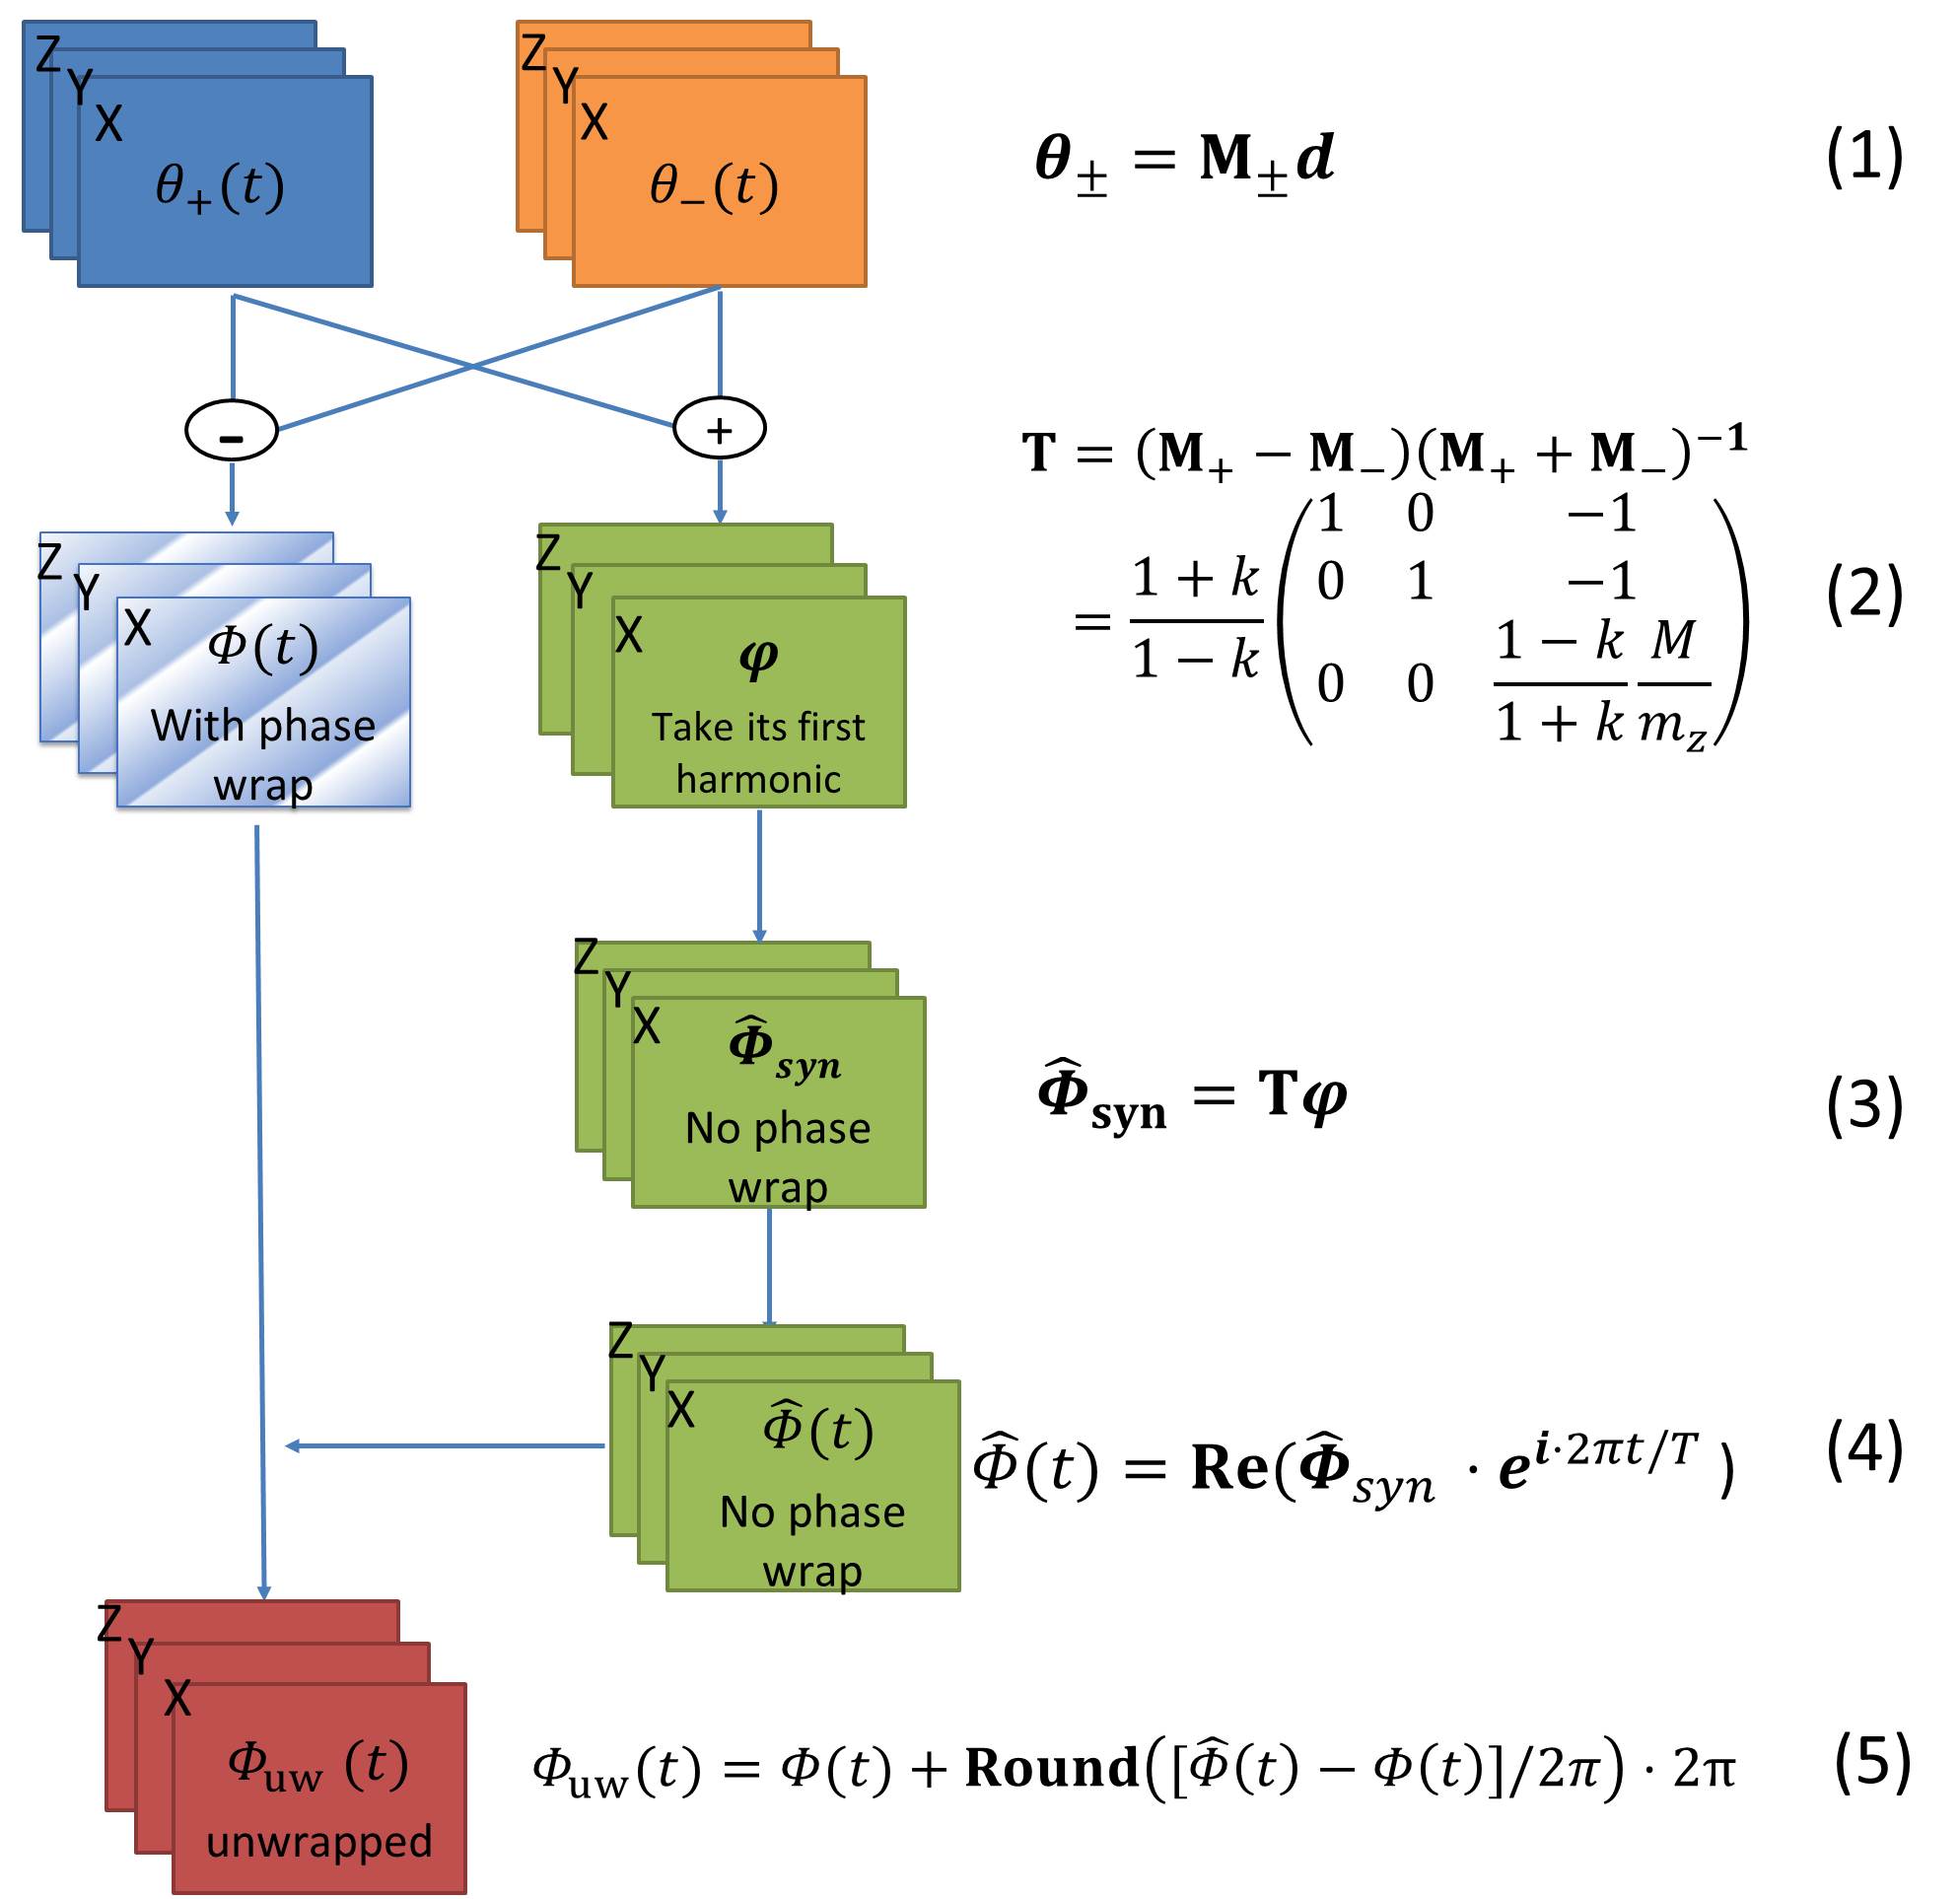
Figure 2. Flow chart for the dual-sensitivity motion-encoding algorithm. The relation between the first harmonic component of the displacement vector d and the first harmonic of the time-domain phase signal vector  can be described in Eq. 1., where M is a 3×3 encoding matrix, and
  denotes the polarity of the MEGs. A 3×3 estimation matrix T (Eq. 2) is used to estimate the high-sensitivity harmonic signal
  from the low-sensitivity harmonic
 (Eq. 3). M is the motion sensitivity of the positive MEGs in the units of rad/mm;
  is the motion sensitivity of the z-axis flow-compensation gradient, and
  is the reduction factor of the negative MEGs relative to the positive MEGs. The estimated high-sensitivity phase map at each phase offset is then calculated using Eq. 4, where t is the time offset, and T is the period of the external vibration. Finally, the high-sensitivity phase
  at each phase offset can be unwrapped using Eq. 5.
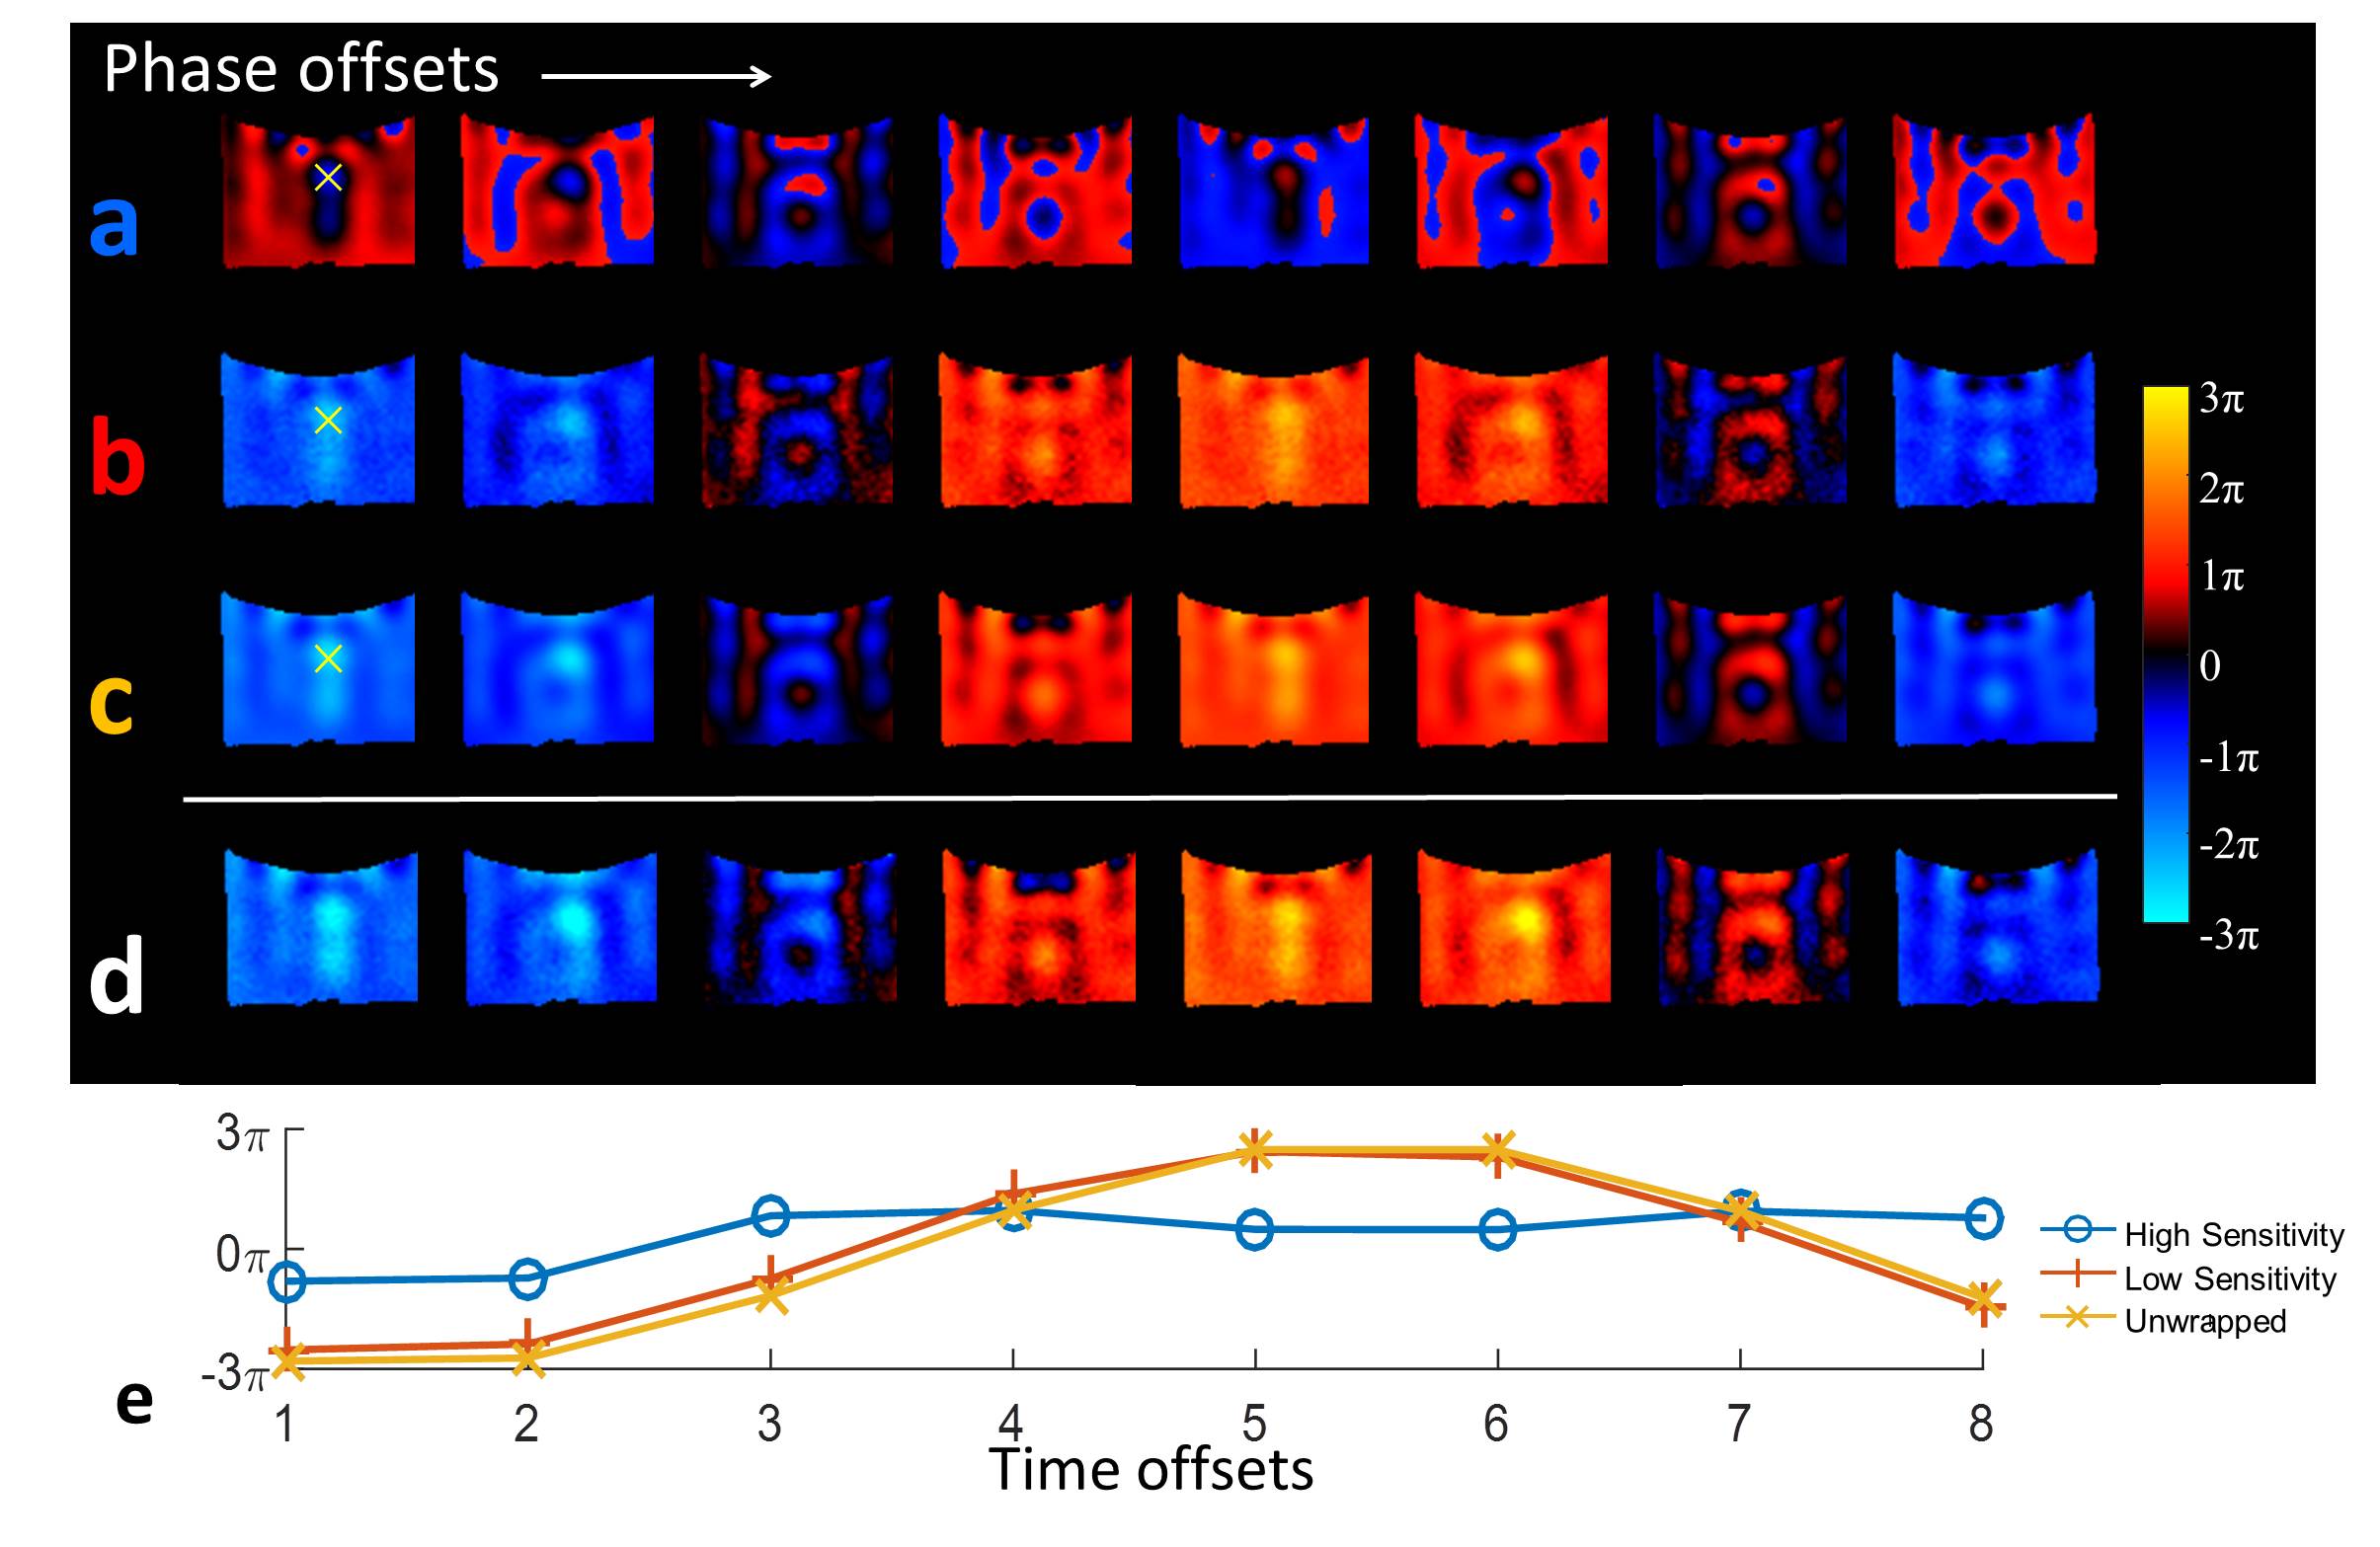
Figure 3. Results from the phantom study showing (a) the wrapped phase
from the high-sensitivity encoding, (b) the high-sensitivity phase estimated from
the low-sensitivity encoding, and (c) the unwrapped high-sensitivity phase at the
8 phase offsets (columns). (d) The reference standard from the separate low-sensitivity
scan. (e) A plot of the phase values at a single voxel (the white cross) over the
8 MRE phase offsets. It shows the correct harmonic nature of the phase signal
in the low-sensitivity and unwrapped high-sensitivity phase images.
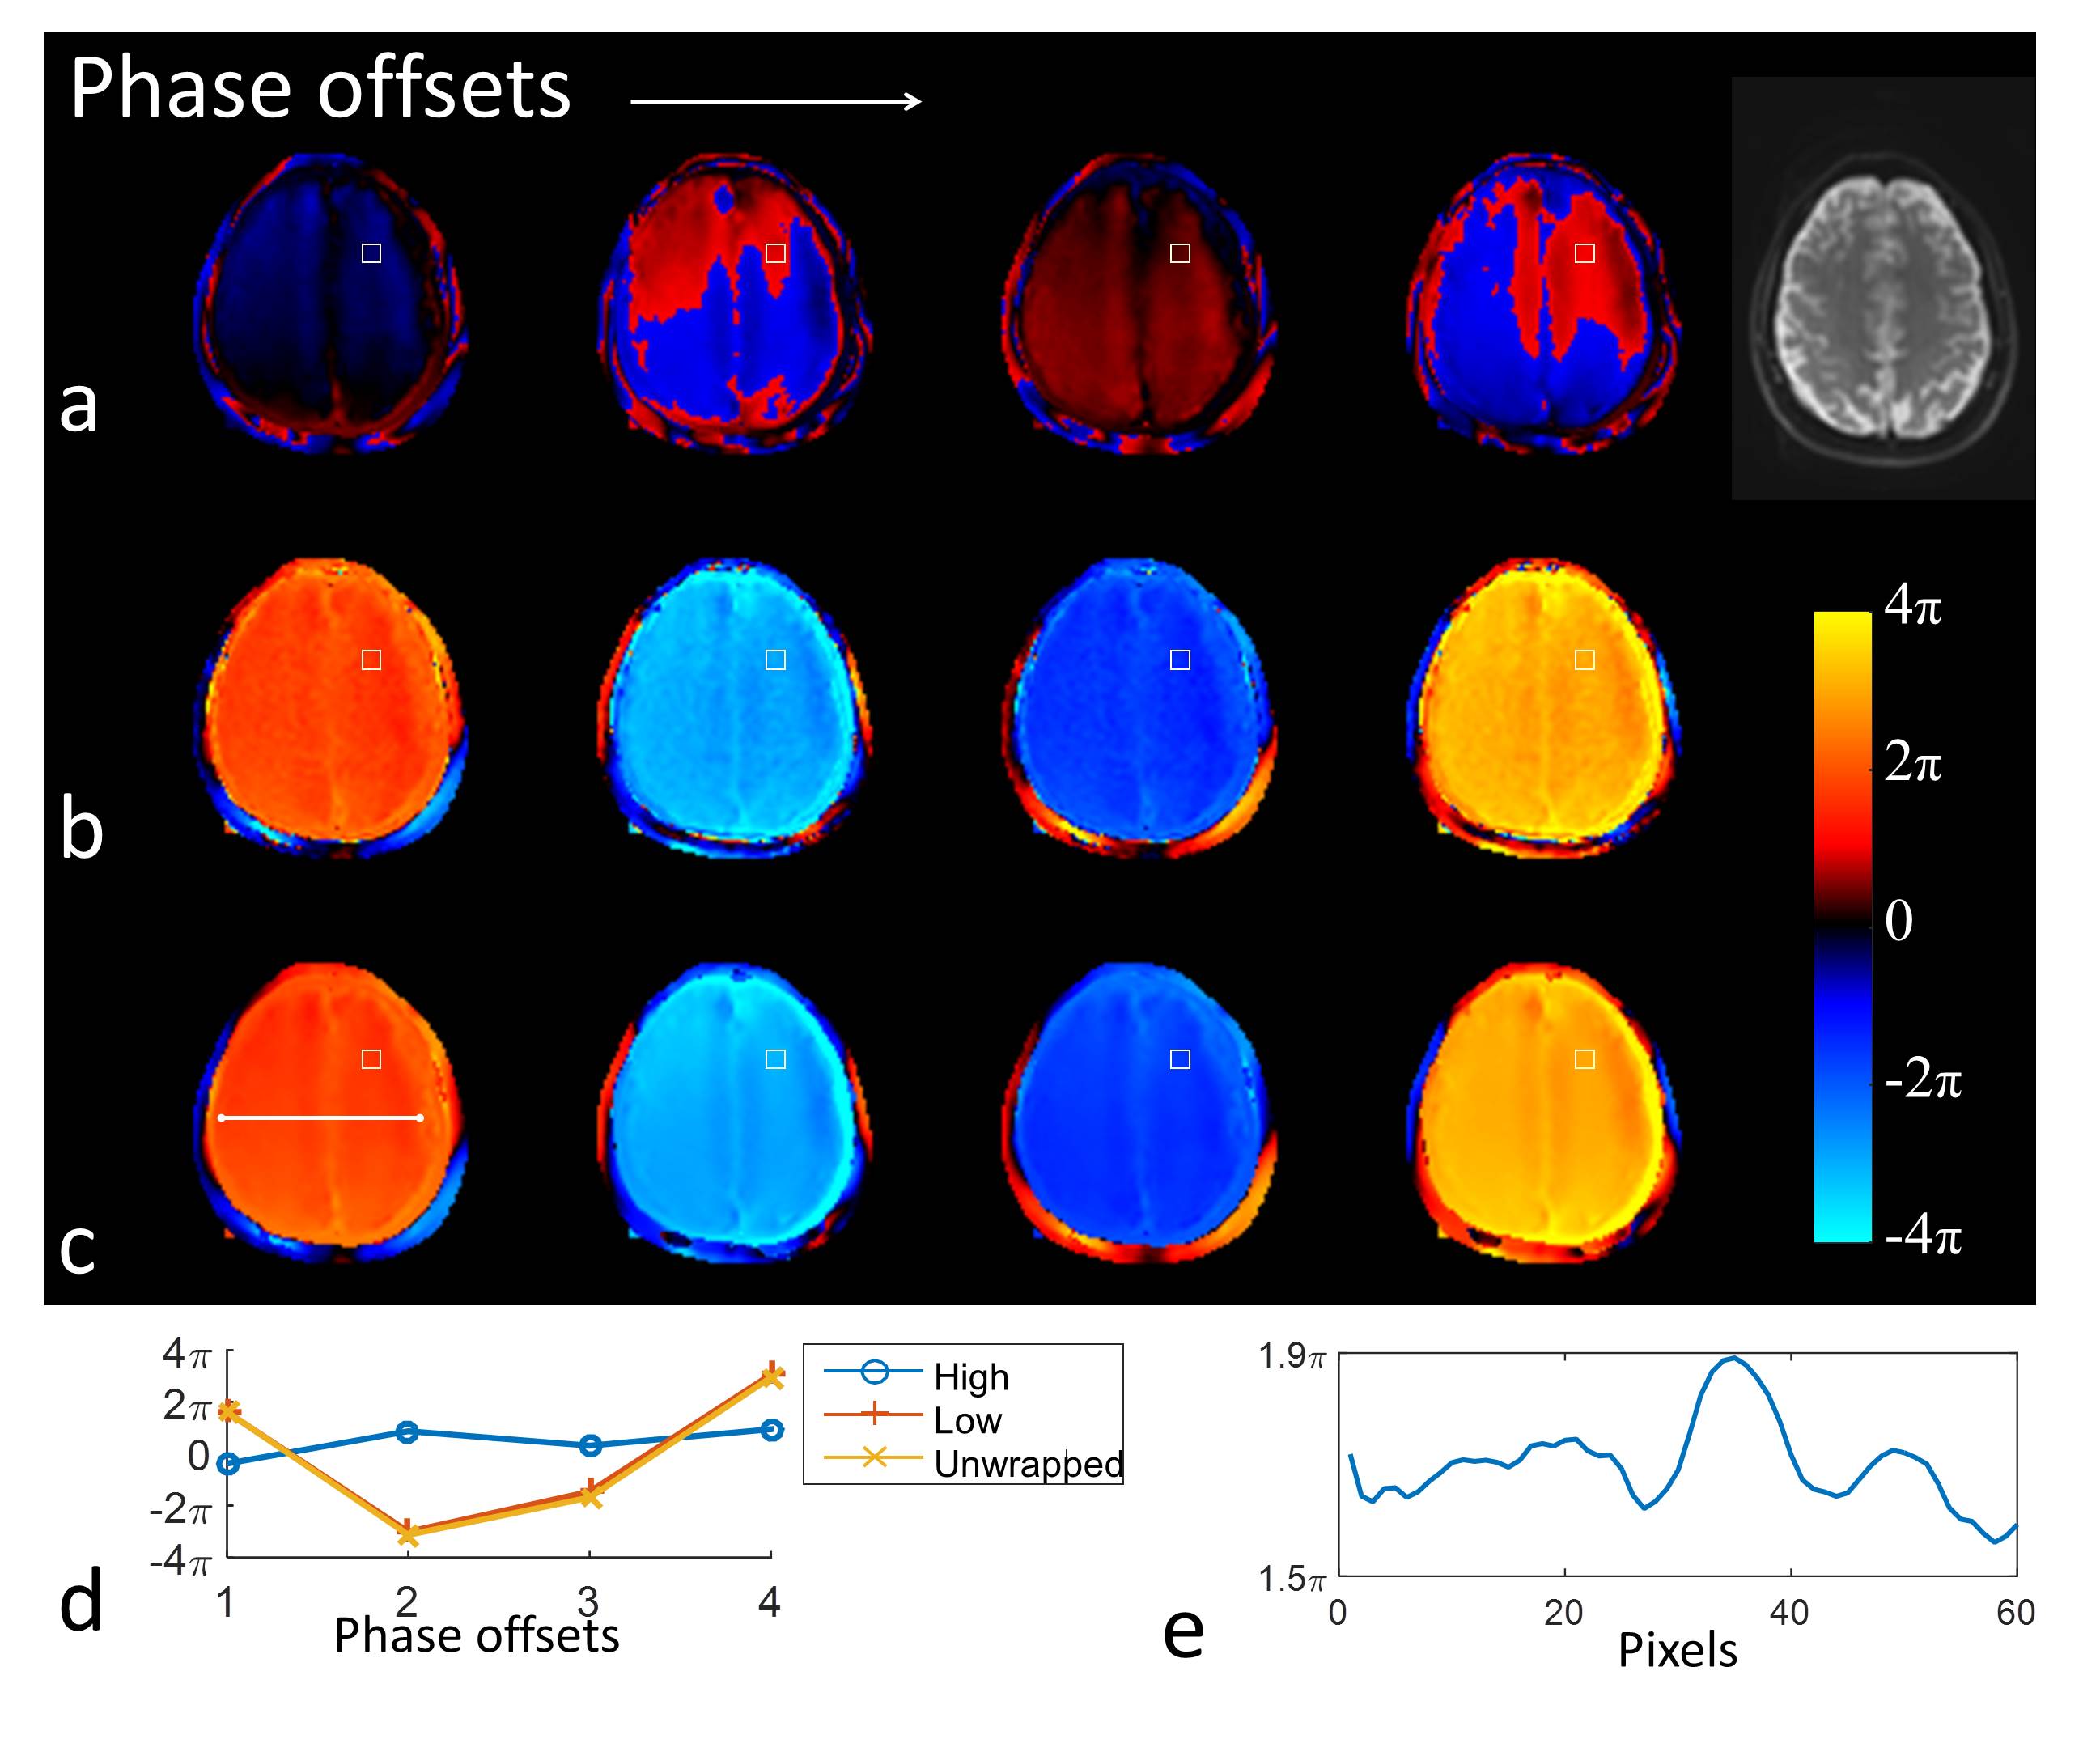
Figure 4. MRE phase data from a normal
volunteer encoded in the AP direction (axial plane). (a) Wrapped phase from the
high-sensitivity encoding, (b) high-sensitivity phase estimated from the low-sensitivity
encoding, and (c) unwrapped high-sensitivity phase at 4 MRE phase offsets
(columns). (d) The plot of the phase values at a single voxel (the white boxes)
over the 4 phase offsets. It shows the correct harmonic nature of the phase
signal in the low-sensitivity and unwrapped high-sensitivity phase images. (e)
The profile of the shear wave along the white line in (c) at the first phase
offset.
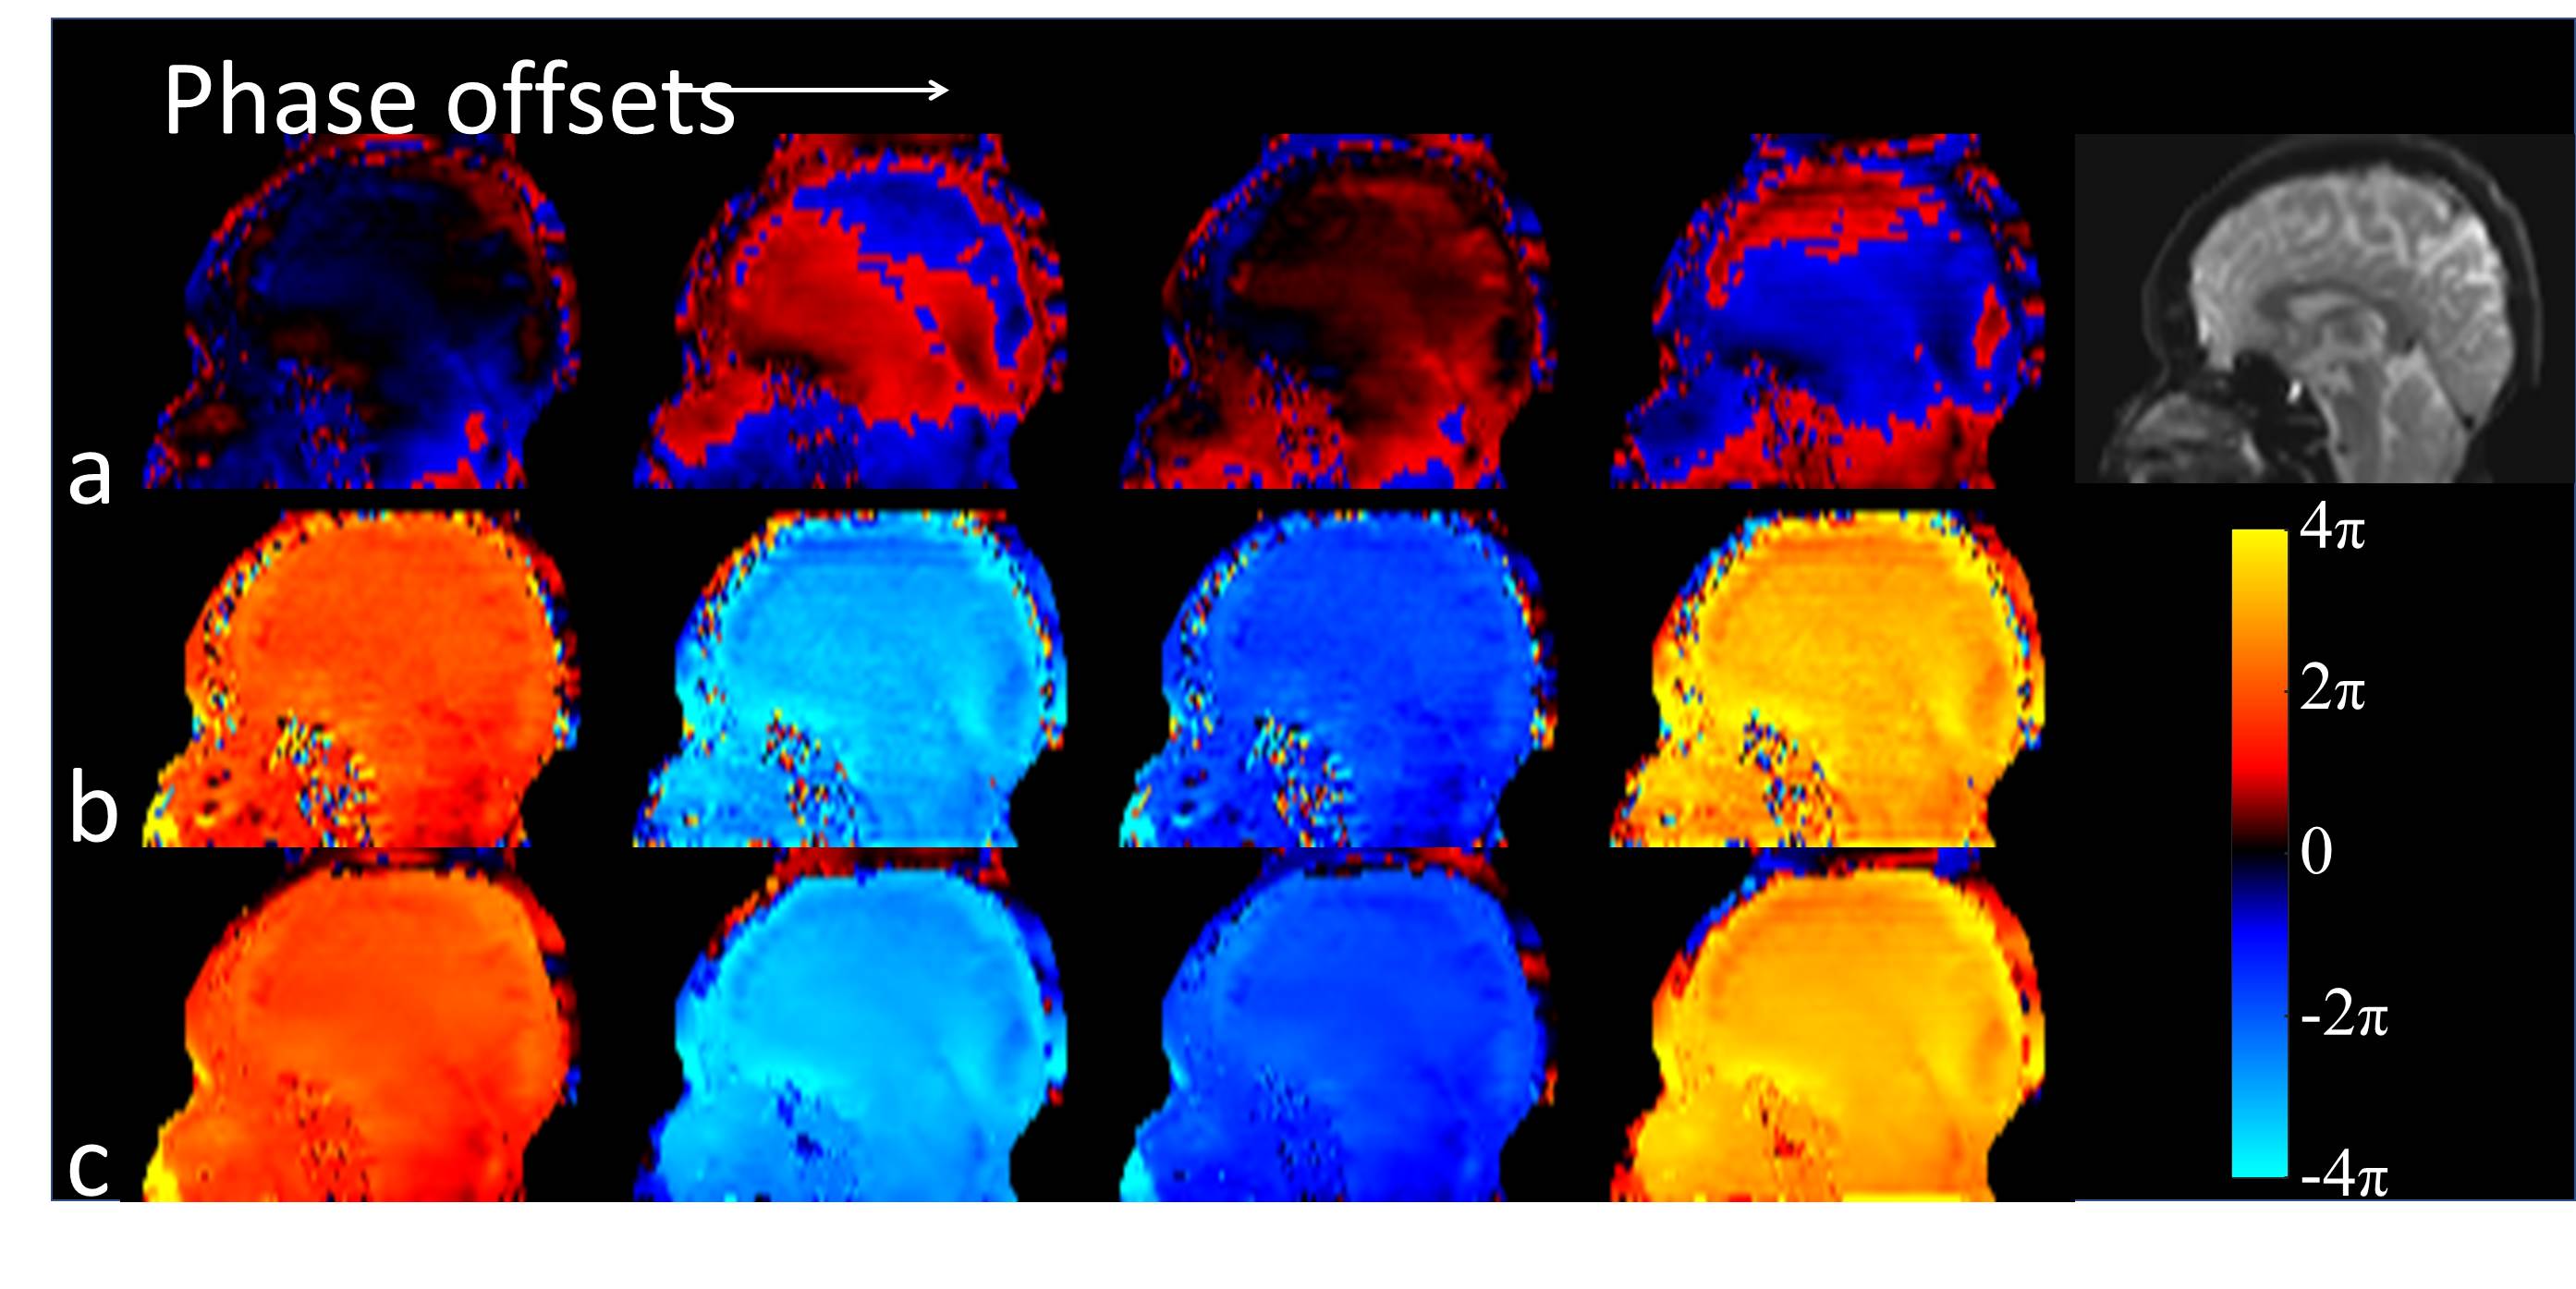
Figure 5. Sagittal view of the same volunteer
phase data. (a) Wrapped phase from the high-sensitivity encoding, (b) estimated
phase from the low-sensitivity encoding, and (c) the unwrapped high-sensitivity
phase map for the entire 3D volume at 4 MRE phase offsets (columns).