5579
Awake rat functional magnetic resonance imaging using 3D printed restrainment kit and standard RF-coils1Biomedical Imaging Unit, A.I. Virtanen Institute for Molecular Sciences, Kuopio, Finland
Synopsis
Anesthetics are typically used in preclinical functional magnetic resonance imaging (fMRI) experiments to prevent animal movement and stress, but anesthetics can significantly affect the brain function. Therefore, several awake fMRI protocols have been developed, usually implementing house-made coils and holders. In present study, we developed a 3D printable restrainment kit that is compatible with standard Bruker rat coils and holders. Subsequently, resting state functional connectivity (RSFC) data was obtained under awake, lightly sedated, and anesthetized conditions. Our results show that even subanesthetic dose of isoflurane modulates FC significantly.
Introduction
Functional magnetic resonance imaging (fMRI) is a powerful non-invasive tool to study whole-brain function. Functional studies in laboratory animals are usually performed under general anesthesia, to prevent movement artifacts and stress. However, anesthetics can have significant effects on brain baseline function and responsiveness to a stimulus or an investigated drug [1]. As previous awake fMRI studies have implemented custom-made coils and animal restraining holders [2], the aim of this study was to develop a novel 3D printable restrainment kit compatible with a standard rat holder and transmitter and receiver coils. Utilizing this kit and a low-stress habituation method, we compared resting-state functional connectivity (RSFC) of awake and lightly sedated rats to anesthetized rats. As awake rats are prone to stress due to repeated restraining sessions [3], we paid special attention to various stress indicators and, in addition, to long-term depression and anxiety.Subjects and methods
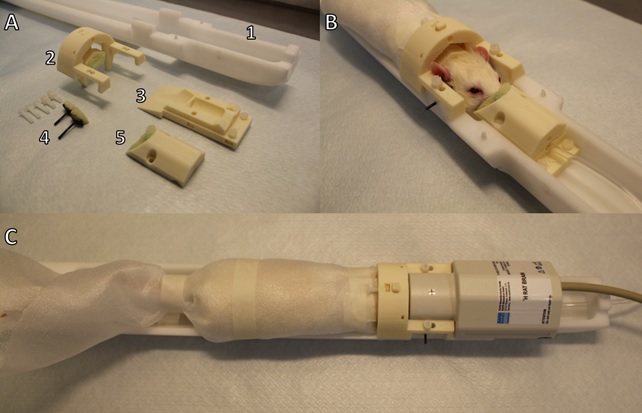
We analyzed RSFC of male Wistar rats under awake state (n=8), subanesthetic doses of 0.5% isoflurane (n=7), and anesthetic doses of 1.3% isoflurane (n=8). Prior to fMRI, awake and lightly sedated rats went through a four or eight day habituation period in an environment mimicking MRI measurement. First, an elastic plastic foam was wrapped around the body and the limbs were tied against the body. Second, the head was secured in the holder by a 3D printed custom-made padded restrainment parts (Figure 1) compatible with standard Bruker Biospin rat holder and coils. During the habituation, loudspeaker played MRI sounds in the background while the rat adapted in this environment for a given time. Habituation time increased incrementally from the first 15min session to 45min session at the fourth day and thereon continued with fixed 45min sessions. Before and after each session, the rat received chocolate cereals as a reward. During the sessions, stress level indicators of plasma corticosterone concentration, heart rate, breathing rate, movement incidences and weight were carefully monitored. Additionally, with the sub cohort of habituated rats, we plan to study long term depression and anxiety by open-field and sugar preference tests. Functional imaging was performed with single-shot spin-echo echo planar imaging sequence with the following parameters: repetition time 2s, echo time 45ms, 64x64 matrix size, field-of-view 2.5 cm x 2.5 cm, 9-11 slices of 1.5 mm thickness. Periods of 10min low-motion fMRI data was selected from each subject. The fMRI data were then converted to NIfTI (http://aedes.uef.fi), slice-timing corrected, motion-corrected, spatially smoothed, and co-registered to a reference brain (SPM8). RSFC was obtained with ROI-based Pearson correlation analysis.Results
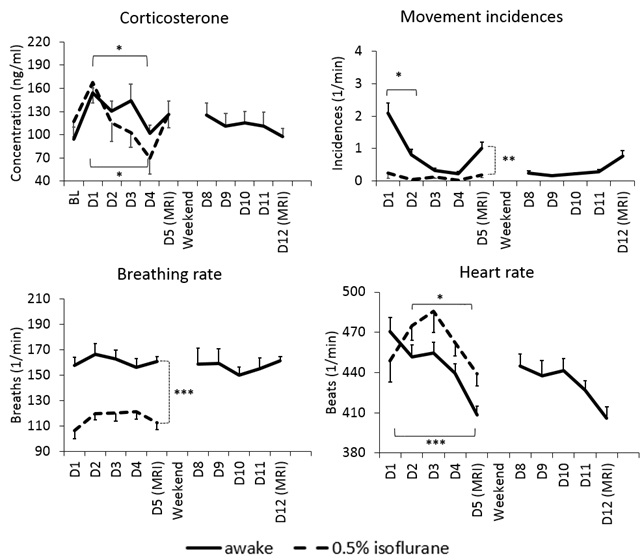
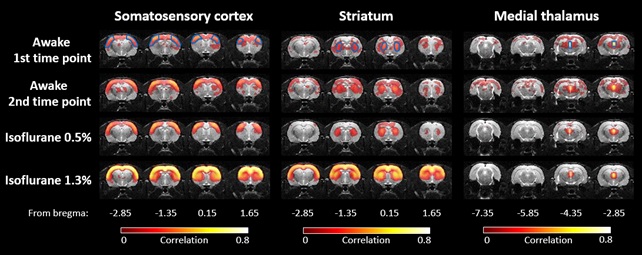
Due to the habituation, stress indicators of plasma corticosterone concentration, heart rate and movement incidences decreased significantly in the awake and lightly sedated groups (Figure 2). Corticosterone concentration decreased back to baseline level at the fourth habituation session in the awake rats (p=0.75, paired t-test) and already at the second habituation session in the lightly sedated rats (p=0.96, paired t-test). As a result, rats moved only slightly during fMRI. Movement in the analyzed fMRI sequences was below half of our voxel size. Based on the FC matrices, connectivity in the rats in awake state differed significantly from the lightly sedated rats, and especially compared to the deeply anesthetized ones (Figure 3). In the lightly sedated rats, RSFC was significantly lower in three medial thalamo-cortical connections compared to the awake rats. Furthermore, thalamo-cortical connectivity was even more suppressed in the anesthetized group compared to the awake group. In contrast, RSFC was considerably stronger in cortical and striatal regions in the anesthetized group. Similar abnormally strong connectivity was seen in several DMN connections (Figure 4). FC differences were also observed from the seed-based connectivity maps (Figure 5).Discussion and conclusion
As a conclusion, a novel 3D printed rat restrainment kit was successfully utilized to study RSFC of awake rats. This kit enabled the use of a standard rat holder and MRI coils thus providing a fast, easily implementable, and low-cost method. Results demonstrated a significant change in cortico-subcortical connectivity even in rats exposed to light isoflurane sedation. In deeply anesthetized state, abnormally strong connectivity was observed throughout the cortex due to anesthesia-induced burst-suppression activity [4, 5], masking intrinsic connectivity, like DMN. These results further confirm the urge for awake animal imaging in preclinical settings.Acknowledgements
This work was supported by the Doctoral Program in Molecular Medicine of University of Eastern Finland. We like to thank Maarit Pulkkinen for technical assistance in animal preparations. The funding sources had no further role in study design or in the collection analysis, and interpretation of data.References
1.
Gao,
Y.-R.R., Ma, Y., Zhang, Q., Winder, A.T., Liang, Z., Antinori, L., Drew, P.J.,
Zhang, N., 2016. Time to wake up: Studying neurovascular coupling and
brain-wide circuit function in the un-anesthetized animal. Neuroimage.
2. King JA, Garelick TS, Brevard ME, Chen W, Messenger TL, Duong TQ, Ferris CF. Procedure for minimizing stress for fMRI studies in conscious rats. J Neurosci Methods. 2005;148(2):154-60
3. Barnum, C.J., Blandino, P., Deak, T. Adaptation in the corticosterone and hyperthermic responses to stress following repeated stressor exposure. J. Neuroendocrinol. 2007;19:632–4
4. Liu X, Zhu X-H, Zhang Y, and Chen W. Neural origin of spontaneous hemodynamic fluctuations in rats under burst-suppression anesthesia condition. Cereb. Cortex 2011;21:374–84
5. Liu X, Zhu X-H, Zhang Y, and Chen W. The change of functional connectivity specificity in rats under various anesthesia levels and its neural origin. Brain Topogr. 2013;26:363–77
Figures