5577
Intrinsic Frequency Specific Brain Networks of Parkinson's Disease Patients1Peking University, Beijing, China
Synopsis
The majority of previous studies concerning the brain network derived from resting state fMRI focused on a low frequency of signal oscillation from 0.01 to 0.1 Hz (Bullmore and Sporns 2009; Van Den Heuvel and Hulshoff Pol 2010). However, the frequency specificities with regard to the topological properties of the PD brain networks have not been fully revealed. To exam the frequency properties of Drug-naive and L-dopa-treated Parkinson's Disease Patients, we subdivided the low frequency range into five bands as previously defined (Biswal et al., 1995; Buzsáki and Draguhn, 2004; Penttonen, 2003). The results suggest that the subdivided frequency bands prominently dissociate topological organisation of brain networks between drug-naive PD patients and L-dopa- treated PD patients.
Introduction
The majority of previous studies concerning the brain network derived from resting state fMRI focused on a low frequency of signal oscillation from 0.01 to 0.1 Hz (Bullmore and Sporns 2009; Van Den Heuvel and Hulshoff Pol 2010). However, the frequency specificities with regard to the topological properties of the Parkinson's Disease Patients brain networks have not been fully revealed. To exam the frequency properties of Drug-naive and L-dopa-treated PD patients, we subdivided the low frequency range into five bands as previously defined (Biswal et al., 1995; Buzsáki and Draguhn, 2004; Penttonen, 2003).Methods
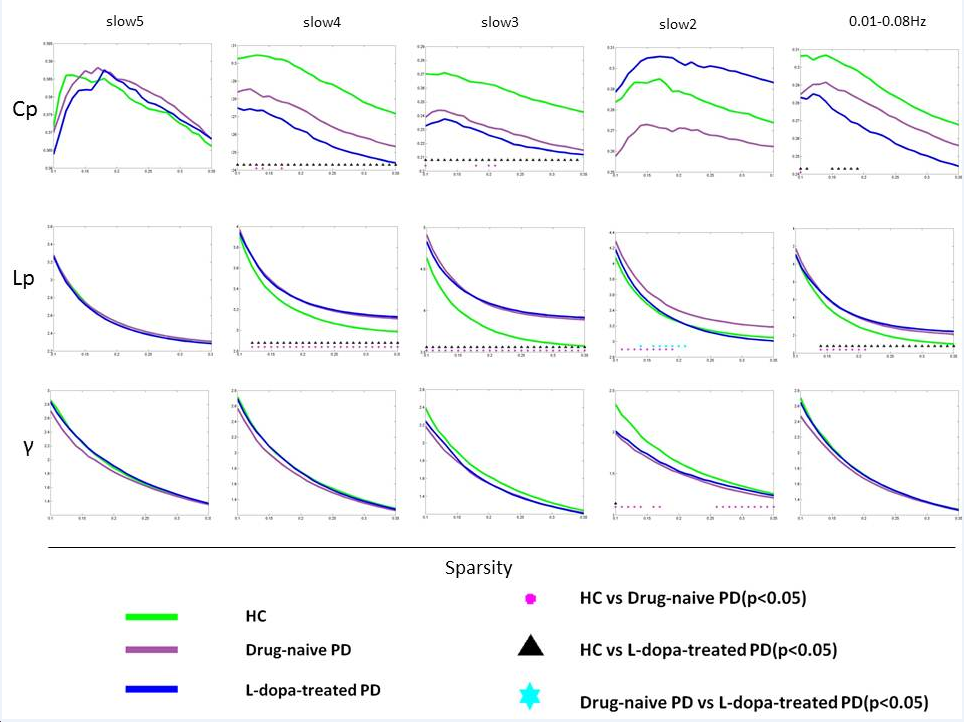
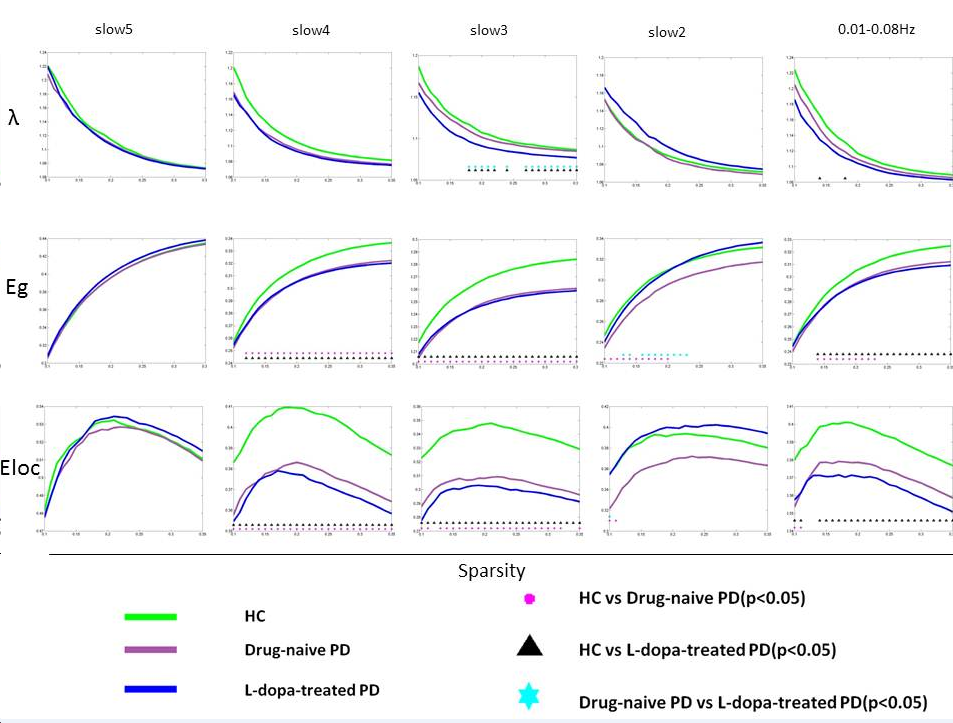
Eighty-eight right-handed participants, comprising 30 L-dopa-treated PD patients (17 males), 30 drug-naive PD patients (23 males, P>0.05), and 28 gender-, age-, education-matched healthy control (HC) subjects (15 males), participated in this study. All patients were recruited from Nanjing Brain Hospital, Nanjing, China. And written informed consents were obtained from all subjects prior to MRI scanning. MR images were acquired on a 3T Siemens Verio system (Siemens, Germany). All subjects were instructed to rest with their eyes closed, not to think about anything in particular. A gradient-recalled echo-planar imaging (GREEPI) pulse sequence was used for acquiring resting state functional images, with the parameters as follows: TR = 2000 ms, TE = 30 ms,slices numbers = 31. The scan for resting state fMRI lasted for 280 seconds, containing 140 brain volumes. Thereafter, anatomical images were acquired using a T1-FLAIR sequence, with the parameters as follows: TR = 2530 ms, TE = 3.34 ms,slices numbers = 128. Standard image preprocessing was performed by using Data Processing Assistant for Resting-State fMRI (DPARSF). We subdivided the low frequency range into five bands as previously defined (Biswal et al., 1995; Buzsáki and Draguhn, 2004; Penttonen, 2003): slow-5 (0.01 - 0.027 Hz), slow-4 (0.027 - 0.073 Hz), slow-3 (0.073 - 0.198 Hz) and slow-2 (0.198 - 0.25 Hz) and (0.01–0.08 Hz). Then, Pearson's correlation was performed to estimate the frequency dependent correlations between each pair of the 90 cortical and subcortical. A set of five (90 x 90) inter-regional Pearson's correlation matrices was then obtained for each subject. Thereafter, five frequency dependent population-based functional connectivity networks were constructed. Additionally, Global measures of frequency specific brain networks, including clustering coefficient (Cp), characteristic path length (Lp), Gamma, Lambda, global efficiency(Eg) and regional efficiency(Eloc), were quantified in the HC, L-dopa-treated PD and drug-naive PD patients.Results
Characteristic path length, global efficiency, regional efficiency is significantly different between HC and drugnaive PD patients group within frequency band slow-3(0.073-0.198 Hz), slow-4 (0.027-0.073 Hz) and frequency band (0.01-0.08). Clustering coefficient, characteristic path length, global efficiency, regional efficiency is significantly different between HC and L-dopa-treated PD patients group within frequency band slow-3(0.073-0.198 Hz), slow-4 (0.027 - 0.073 Hz) and frequency band (0.01-0.08). Characteristic path length and global efficiency is significantly different between drug-naive PD patients and L-dopa-treated PD patients group within frequency band slow-2(0.198-0.25 Hz).(P<0.05)Conclusions
Compared to the previous studies focusing on a low frequency of signal oscillation from 0.01 to 0.08 Hz, we subdivided the low frequency range into four bands. Our results demonstrated that brain networks for all groups showed small world architecture. Moreover, the topological organisation significantly different in frequency band slow-2(0.198-0.25 Hz) distinguished drug-naive PD patients and L-dopa-treated PD patients group. It suggests that the subdivided frequency bands prominently dissociate topological organisation of brain networks between drug-naive PD patients and L-dopa-treated PD patients.Acknowledgements
No acknowledgement found.References
Buzsáki G, Draguhn A. Neuronal oscillations in cortical networks. Science 2004;304:1926–1929.
Penttonen M. Natural logarithmic relationship between brain oscillators. Thalamus & Related Systems 2003;2:145–152.
Song X, Zhang Y, Liu Y. Frequency Specificity of Regional Homogeneity in the Resting-State Human Brain. PloS one. 2014; 9(1):e86818.
Zuo X-N, Di Martino A, Kelly C, Shehzad ZE, Gee DG, Klein DF, et al. The oscillating brain: complex and reliable. NeuroImage. 2010; 49(2):1432–45
Figures