5576
Verifying the Reliability of Steady-State Free Precession fMRI in Detecting Oxygen Saturation Changes in Rat C6 Glioma1Second affiliated hospital of Soochow University, Suzhou, China, 2Philips Healthcare, Shanghai, China
Synopsis
In this study, we aim to verify the reliability of steady-state free precession (SSFP) technique for detecting oxygen saturation level changes in functional MRI (fMRI). We compared SSFP fMRI image signals in rat glioma with pO2 values measured directly using MRI compatible fiber-optic microprobes, and we found that their temporal variations resembled each other. Therefore, SSFP fMRI, as a non-invasive imaging technique, can be used to reveal the location of re-oxygenation hence hypoxia in tumor.
Objective
Tumor hypoxia is one of the key factors that affect the efficacy of radiotherapy1,2. Thus, the ability to detect dynamic changes in oxygen saturation level within tumor is of great importance. Steady-state free precession (SSFP) sequence has recently been employed for functional MRI (fMRI)3. In our study, we aim to verify the reliability of SSFP fMRI for detecting oxygen saturation level changes. To achieve this, we compare image signal variations with direct measurements obtained from rat C6 glioma using MRI compatible fiber-optic microprobes.Methods
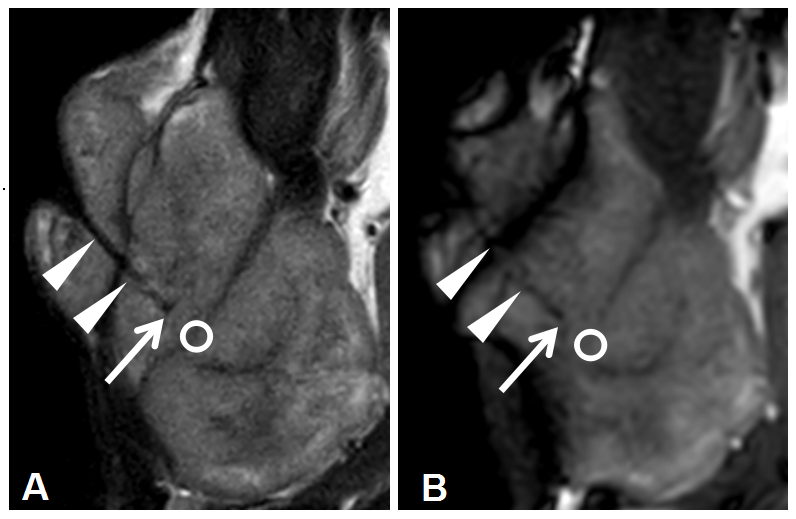
A total of 30 male Sprague-Dawley rats were used to establish the subcutaneous C6 glioma model. MRI compatible OxyLiteTM fiber-optic microprobes were embedded in the tumor after anesthesia (see Figure 1). The rats were then examined in the prone position using a clinical 3.0 T whole-body MRI system (Ingenia, Philips Healthcare, the Netherlands). A dStream small extremity 8-channel coil was used for signal reception. Acquisition parameters were as follows: TR/TE=6.9ms/3.4ms; flip angle=70°; FOV=80mm×80mm; acquisition matrix=136×134; slice thickness=2mm (four slices); number of dynamic scans=100. SSFP fMRI scans were performed with Carbogen inhalation4 while a series of tissue pO2 values were recorded simultaneously in real time using the fiber-optic microprobes. Image data was processed using non-hemodynamic response function (non-HRF) analysis provided by AFNI software5. A spherical region of interest (ROI) with a 2mm diameter was placed at the tip of the fiber-optic microprobe to determine the T value and percentage signal change (PSC). The mean difference of pO2 (ΔpO2) before (pO2-air) and after (pO2-car) Carbogen inhalation in the ROI was calculated. The difference between pO2-air and pO2-car was tested by Wilcoxon matched-pair signed rank test. Lastly, we investigated the correlation between ΔpO2 and T value, as well as between ΔpO2 and PSC.Results
We obtained pO2 values before and after Carbogen inhalation at 28 different locations in the tumor region during SSFP fMRI scan. The experimental results, shown in the format of [median (interquartile range)], were as follows: pO2-air = 0.580 (9.020) mmHg, pO2-car = 3.005 (19.830) mmHg, ΔpO2 = 1.015 (13.088) mmHg, T value = 2.686 (6.736), PSC value = 1.267 (3.257)%. The mean value of pO2 significantly increased after Carbogen inhalation (p=10-3). The mean value of ΔpO2 measured at all of the 28 tumor locations correlated positively both to T value (Spearman’ r = 0.420, p = 0.026) and PSC value (Spearman’ r = 0.465, p = 0.013).Discussion
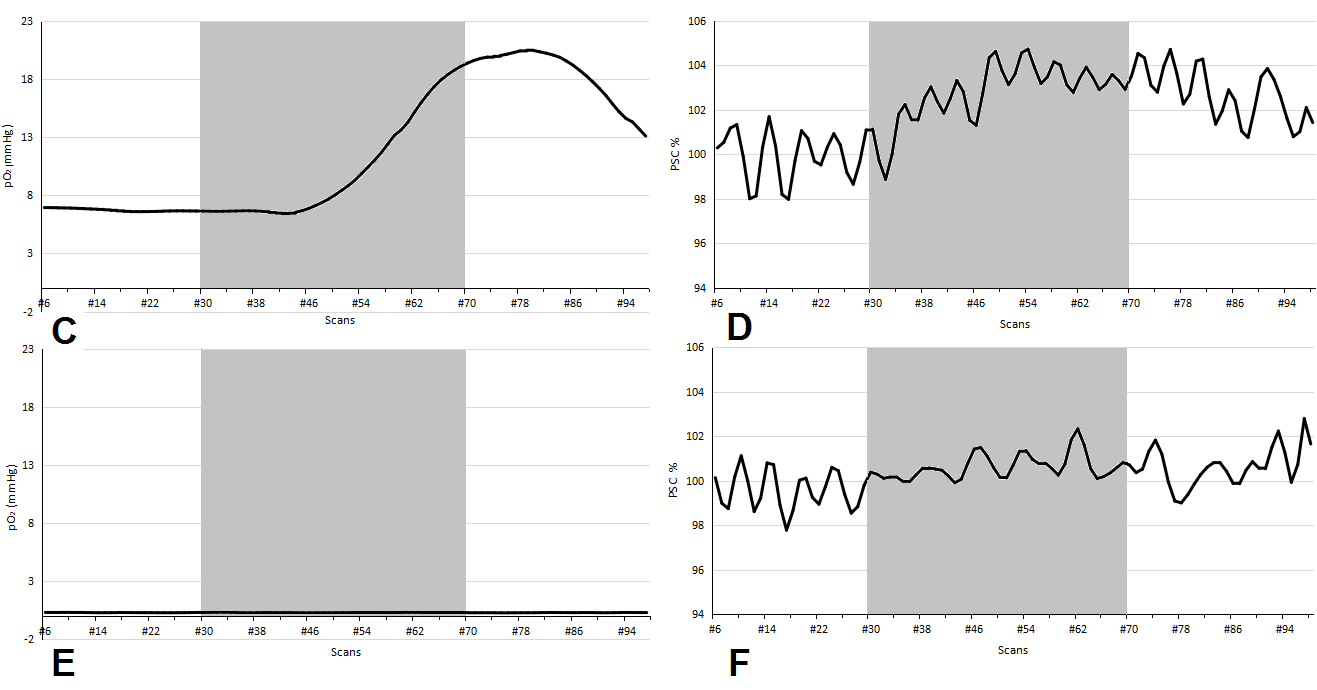
In this study, the real time changes of pO2 in the tumor were measured directly using OxyLiteTM fiber-optic microprobes. The difference of pO2 before and after Carbogen inhalation was statistically significant (p=10-3). As illustrated in Figure 2, temporal variation of the pO2 value measured by the fiber-optic microprobes resembled that of the PSC value extracted from the predefined ROI in the SSFP fMRI images. The mean value of ΔpO2 correlated positively to both T value and PSC value. These results indicate that changes in the SSFP image signals are consistent with the local tissue pO2 measurements.Conclusion
To conclude, fMRI using steady-state free precession (SSFP) is able to track changes in oxygen saturation level in rat glioma, and hence has the potential to detect tumor hypoxia.Acknowledgements
No acknowledgement foundReferences
1. Brown J M. Tumor Hypoxia in Cancer Therapy. Methods in Enzymology 2007; 435:297-321.
2. Xu J, Chen A, Xiao J, et al. Evaluation of tumour vascular distribution and function using immunohistochemistry and BOLD fMRI with carbogen inhalation. Clinical Radiology 2016; 71(12):1255-1262.
3. Miller K L. FMRI using balanced steady-state free precession (SSFP). NeuroImage 2012; 62(2): 713-719.
4. Jerome N P, Hekmatyar S K, Kauppinen R A. Blood oxygenation level dependent, blood volume, and blood flow responses to carbogen and hypoxic hypoxia in 9L rat gliomas as measured by MRI. Journal of Magnetic Resonance Imaging 2014, 39(1): 110-119.
5. Analysis of Functional NeuroImages (AFNI) software. https: //afni.nimh.nih.gov/.
Figures