5572
FFC-NMR: A promise tool to discriminate infiltrative tumour cells from solid tumours: a study of three glioma mouse models1BrainTech Lab - INSERM U1205, Grenoble, France, 2INAC-CEA, Grenoble, France, 3Aberdeen University, Aberdeen, United Kingdom
Synopsis
Using Fast-Field Cycling NMR (FFC-NMR), three glioma mouse models were studied to compare T1-dispersion curves of solid tumours (U87) versus infiltrative tumours (Glio6 and Glio96). The U87 T1-dispersion curves were found distinct from those of Glio6 and Glio96 and fitted well to the power-law model (1/T1=γ/2π B0β). Statistical tests were used to find which model parameters discriminate the two tumour types. Results confirm the interest of low magnetic fields to exploit the offset parameter A, which corresponds to relaxation T1, but specifically highlight the interest of the low-field exponent βL parameter which give a molecular dynamic information, that is invisible by conventional NMR methods.
Purpose
Using Fast-Field-Cycling NMR (FFC-NMR), which measures relaxation times T1 at different magnetic fields we have observed significant T1-dispersion differences at low regime (<1T) between cerebral tumour and peritumoural resections from the same patient1.
Here using glioma mouse models, we propose to compare T1-dispersion curves of solid tumours versus infiltrative one. Our aim is to highlight the role of FFC-NMR in detecting glioma cell infiltration in brain tissue.
Subjects and Methods
All animal procedures including the intracerebral injection of glioma cells were approved according to the French and European Guidelines for the Protection of Vertebrate Animals (decree 87–848 of 19 October 1987, licenses C3818510003 from the French Ministry of Agriculture).
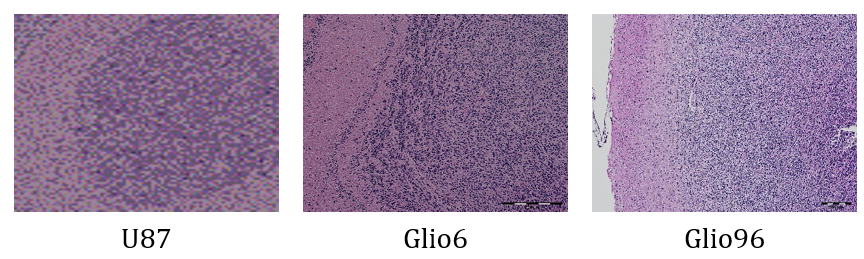
Three glioma mouse models were studied: the U87, a standard model of solid glioma, the glioma Glio6 and the Glio96 mouse models of tumour cell migration/invasion, both derived from human stem cells and developed in our laboratory. The Glio6 was recently validated2 while the Glio96 is still under study. Human glioma cells (5.105 in 5μl phosphate buffered saline) were injected into the right caudate nucleus (Bregma level, 2mm lateral, 2. mm depth) of nude mice (n=13 (U87), n=8 (Glio6/96)). Then the tumour growth which was controlled in a MRI follow-up, brains were removed, and regions of U87 solid glioma and of Glio6 and Glio96 glioma cell infiltration were extracted (30 to 210mg weight) and stored at -80°C. Histology (Hematoxylin/Eosin (HE) and Hematoxylin/Eosin/Safran (HES)) were used to confirm the nature of the sample (Fig.1).
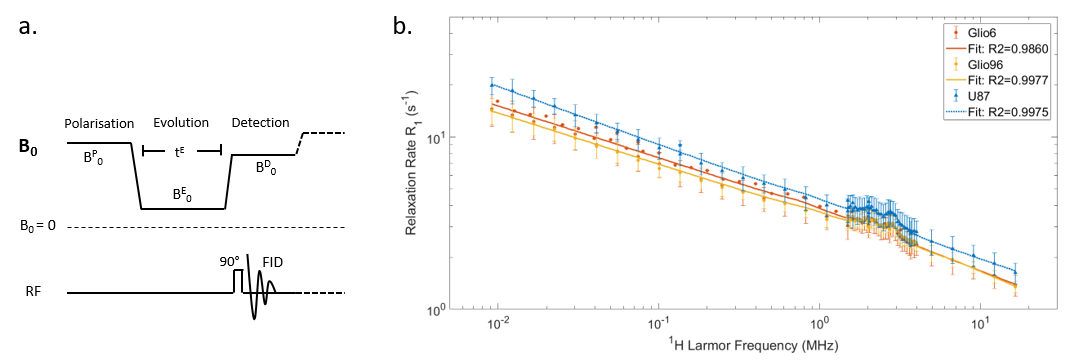
Fig.2a illustrates the FFC-NMR experiment for measuring T1-dispersion curves. The polarisation was set to field strength B0P, T1 relaxation occurs during the evolution period tE at B0E and the NMR signal is detected at B0D using the same radiofrequency coil. FFC-NMR was performed at 37oC with a Stelar SpinMaster relaxometer. Samples have been put in NMR tubes (5mm diameter) filled with Fomblin oil. For each B0E value (n=30 from [0.2mT-0.5T]), 12 tE values were used to describe T1 relaxation. Quadrupolar peaks (QPs) that results from quadrupolar interactions between 14N in proteins and 1H nuclei were acquired with 30 magnetic field around 58.7mT. We reported relaxation rate R1 =1/T1 versus 1H Larmor frequency ν0=γ/2πB0E as commonly done in the field (Fig.2b).
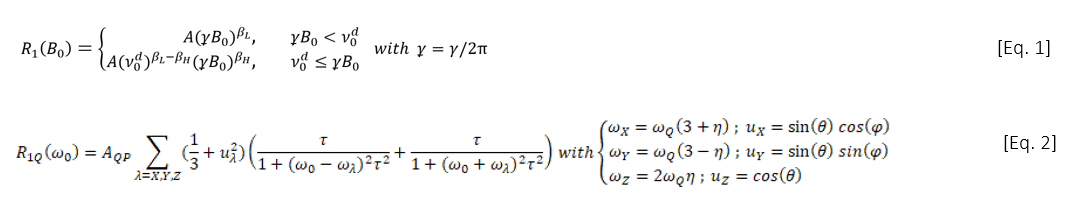
T1-dispersion curves were analysed using a power-law model3, given in [Eq.1] to describes the background T1-dispersion curve with two regimes at low and high fields (Fig.3). A is the amplitude at the origin; βL and βH the exponents at low and high fields, known to relate the molecular dynamics3 and ν0d is the frequency at the discontinuity. [Eq.2] is the model that describes the QPs4, where AQP their amplitude, ωQ and η set the peak frequencies, τ is the rotational correlation time and θ and φ are the spherical coordinates of the quadrupole vector.
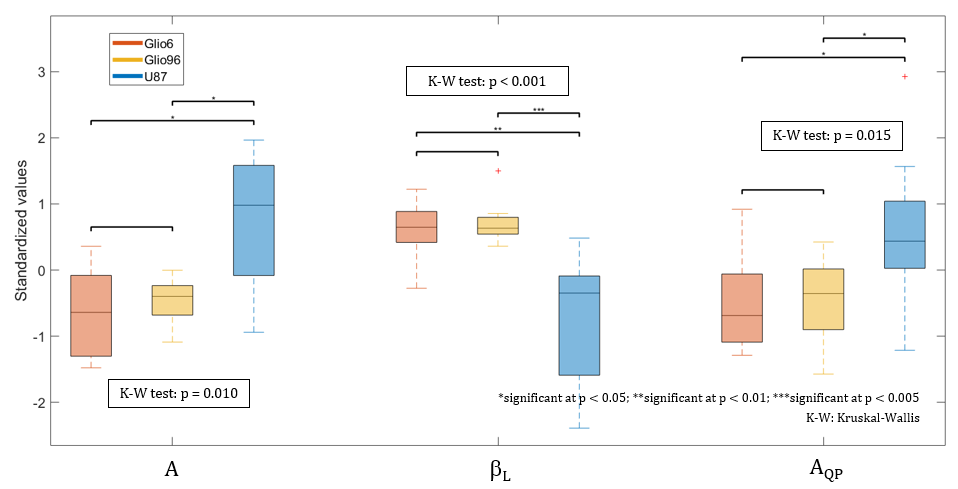
Three parameters (A, βL, AQP) were then selected using the non-parametric Kruskal–Wallis test which investigate the distribution differences between the classes and thus their separability. All the analysis was achieved using the software MATLAB R2017a (Natick, Massachusetts,US).
Results
Fig.2b presents the mean R1-dispersion curves of Glio6, Glio96 and U87 glioma. The curves showed an excellent power-law shapes (R>0.98) indicating dominant relaxation by protein matrix3. In all curves the signal of QPs was present and accurately fitted to Eq.2. Glio6 and Glio96 curves were well separated from U87 glioma.
In Fig.4, we see that the parameters A, amplitude and βL, low-field exponent derived from the power model and the QPs amplitude AQP clearly discriminate solid tumour class from infiltrative glioma cells. The parameter A indicated a net differences in T1 relaxation, while the component βL showed molecular dynamics in its frequency range. The amplitude of the QP is known to be sensitive to immobile protein molecules5, an feature completely invisible to conventional (fixed‐field) NMR/MRI which can also be exploited giving additional protein information.
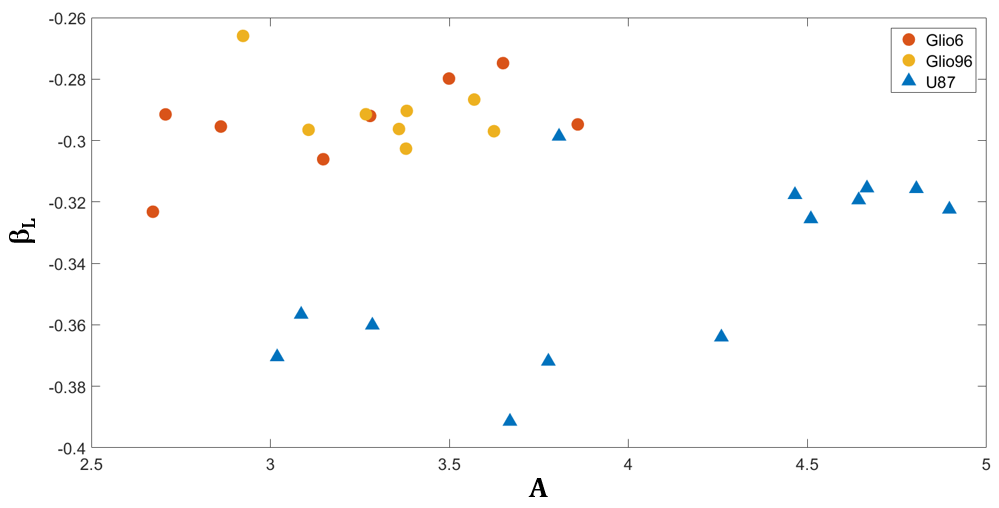
From Fig.4, the two most discriminant parameters, the power-law offset A and the low-field exponent βL evaluated by the Kruskal–Wallis test were used as a visual example of the U87 and Glio6/Glio96 separability (Fig.5).
Discussion/Conclusion
Peritumoural regions invaded by infiltrative glioma cells are not adequately and sufficiently early diagnosed by MRI or any current medical imaging method. This study highlights the great interest of low fields accessible by FFC methods to discriminate tissue of infiltrative glioma cells from solid tumours.
These results were also observed in human resection1 and highlights the interest to develop FFC-MRI for clinical investigations.
Acknowledgements
No acknowledgement found.References
1. Broche LM , Huang Y , Pierre S, Berger F , Lurie D J , Fries PF , and Lahrech H, Fast Field-Cycling NMR of human glioma resections: characterization of heterogeneity, ISMRM Honolulu USA (2017)
2. Gimenez U, Perles-Barbacaru AT, Apaix F, El-Attifi M, Pernel-Galley K, Berger F, Lahrech H, Microscopic DTI accurately identifies early glioma cell migration: correlation with multimodal imaging in glioma stem model, NMR in Biom 29:1553-1562 (2016)
3. Kimmich R, Winter F, Nusser W, Sspohn KH, Interactions and Fluctuations Deduced from Proton Field-Cycling Relaxation Spectroscopy of Polypeptides, DNA, Muscles, and Algae, JMR 68: 263-282 (1986)
4. Fries PH, Belorizky E, Simple expressions of the nuclear relaxation rate enhancement due to quadrupole nuclei in slowly tumbling molecules, Journal of Chemical Physics 143 (2015)
5. Kimmich, Rainer & Anoardo, Esteban, Field-cycling NMR relaxometry, Progress in Nuclear Magnetic Resonance Spectroscopy, 44. 257-320 (2004).
Figures