5571
T1-dispersion curves modelling and analysis of human glioma resections: a novel biomarker of molecular dynamics1BrainTech Lab - INSERM U1205, Grenoble, France, 2INAC-CEA, Grenoble, France, 3Aberdeen University, Aberdeen, United Kingdom
Synopsis
Here we aim to characterize human glioblastoma with FFC-NMR using cerebral tissue of normal pig as a reference. Power-law models and Fries-Belorisky model (quadrupolar 14N-1H coupling peaks (QPs)) were used to analyse the T1-dispersion. Linear Discriminant Analysis and statistical tests of derived fit parameters were used for classification. T1 values at low field were found significantly different between cerebral tissues and glioblastoma, a result which is well admitted by the NMR community. However our most relevant finding is the role of the molecular dynamics related parameters to discriminate glioblastoma from cerebral tissues. QPs parameters also appear as a possible biomarkers but require higher signal sensitivity.
Purpose
Fast-Field-Cycling NMR (FFC-NMR) consists in measuring relaxation times T1 at different magnetic field values at low regime (<1T) and has the unique capability to probe the molecular dynamics of tissues, an information invisible to standard NMR. In our pilot works1 we have shown the interest in studying glioma by FFC-NMR. Here, using mathematical models, we aim to describe T1-dispersion curves and to find how the numerical parameters derived either from T1-dispersion profiles or quadrupolar peaks (QPs of 14N-1H nuclei coupling) could be exploited as biomarkers for glioma characterization.Subjects and Methods
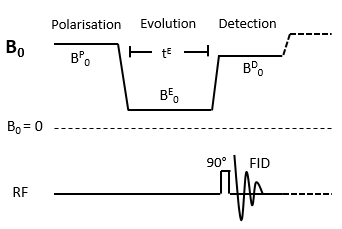
Fig.1 shows FFC-NMR sequence for measuring T1‐dispersion curves. The magnetisation is polarised at field strength B0P, T1 relaxation occurs during the evolution period tE at B0E and the NMR signal is detected during at B0D using the same radiofrequency coil. All experiments were performed with a Stelar relaxometer using 30 B0E values [0.1mT-0.5T]. To describe T1 relaxation, 12 tE were used for each B0E. Acquisition of QPs required 30 magnetic fields values around 58.7mT.
Samples of white and grey matter (WM, GM) of normal pig brains obtained from the Grenoble abattoir were used as references (n=18 (GM) and n=19 (WM), [80-200mg] weight). Human glioblastoma resections (n=5, [30-125mg] weight) were obtained directly from the neurosurgery room under the Biological Resources Center control in charge to manage patient consent and biopsy conservations according to European rules. All samples have been put in dry carbon ice and then in NMR tubes (5mm diameter) filled with Fomblin for FFC NMR acquisitions performed at 37oC. Hematoxylin/Eosin stain (HE) and Hematoxylin/Eosin/Safran stain (HES) histology were performed to control the nature and grade of resections.
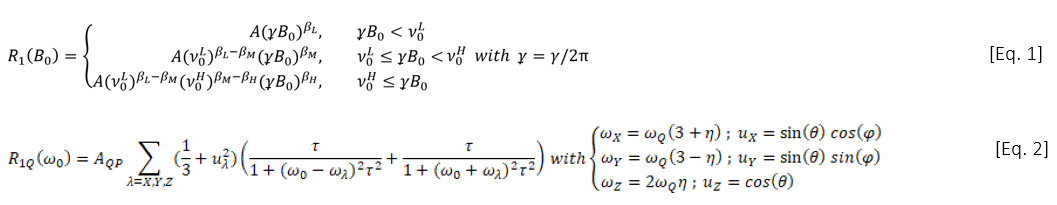
Water and bio-macromolecule interactions are considered to be the main source of relaxation in biological tissue2 and T1-dispersion curves from previous studies were found to fit very well with the power-law model1, which was therefore re-used here. The model is given in [Eq.1] in three regimes at low, intermediate and high fields. A is the amplitude at the origin; βL, βM, βH the exponents components at low, medium and high fields, known to reflect the molecular dynamics2 and ν0L, ν0H: the discontinuity frequency points at low/intermediate and intermediate/high fields. [Eq.2] is the model that describes the QPs3, where AQP their amplitude, ωQ and η parameters that calculate peak frequencies, τ the rotational correlation time; θ and φ the spherical coordinates of the quadrupole vector.
WM, GM and Glioblastoma were classified with a Linear Discriminant Analysis (assuming a normal distribution) and validated using 10-fold cross-validation. The imbalanced dataset situation was solved with a specific cost matrix to penalize the classifier during the training phase. Parameters that could discriminate were pre-selected by the non-parametric Kruskal–Wallis test which investigates the distribution differences between the classes and thus their separability. The five selected features (A, βL, βM, ωQ, θ) were then simplified to retain only the three power-law parameters (A, βL, βM). All the analysis was achieved using the software MATLAB, R2017a (Natick, Massachusetts, US).
Results
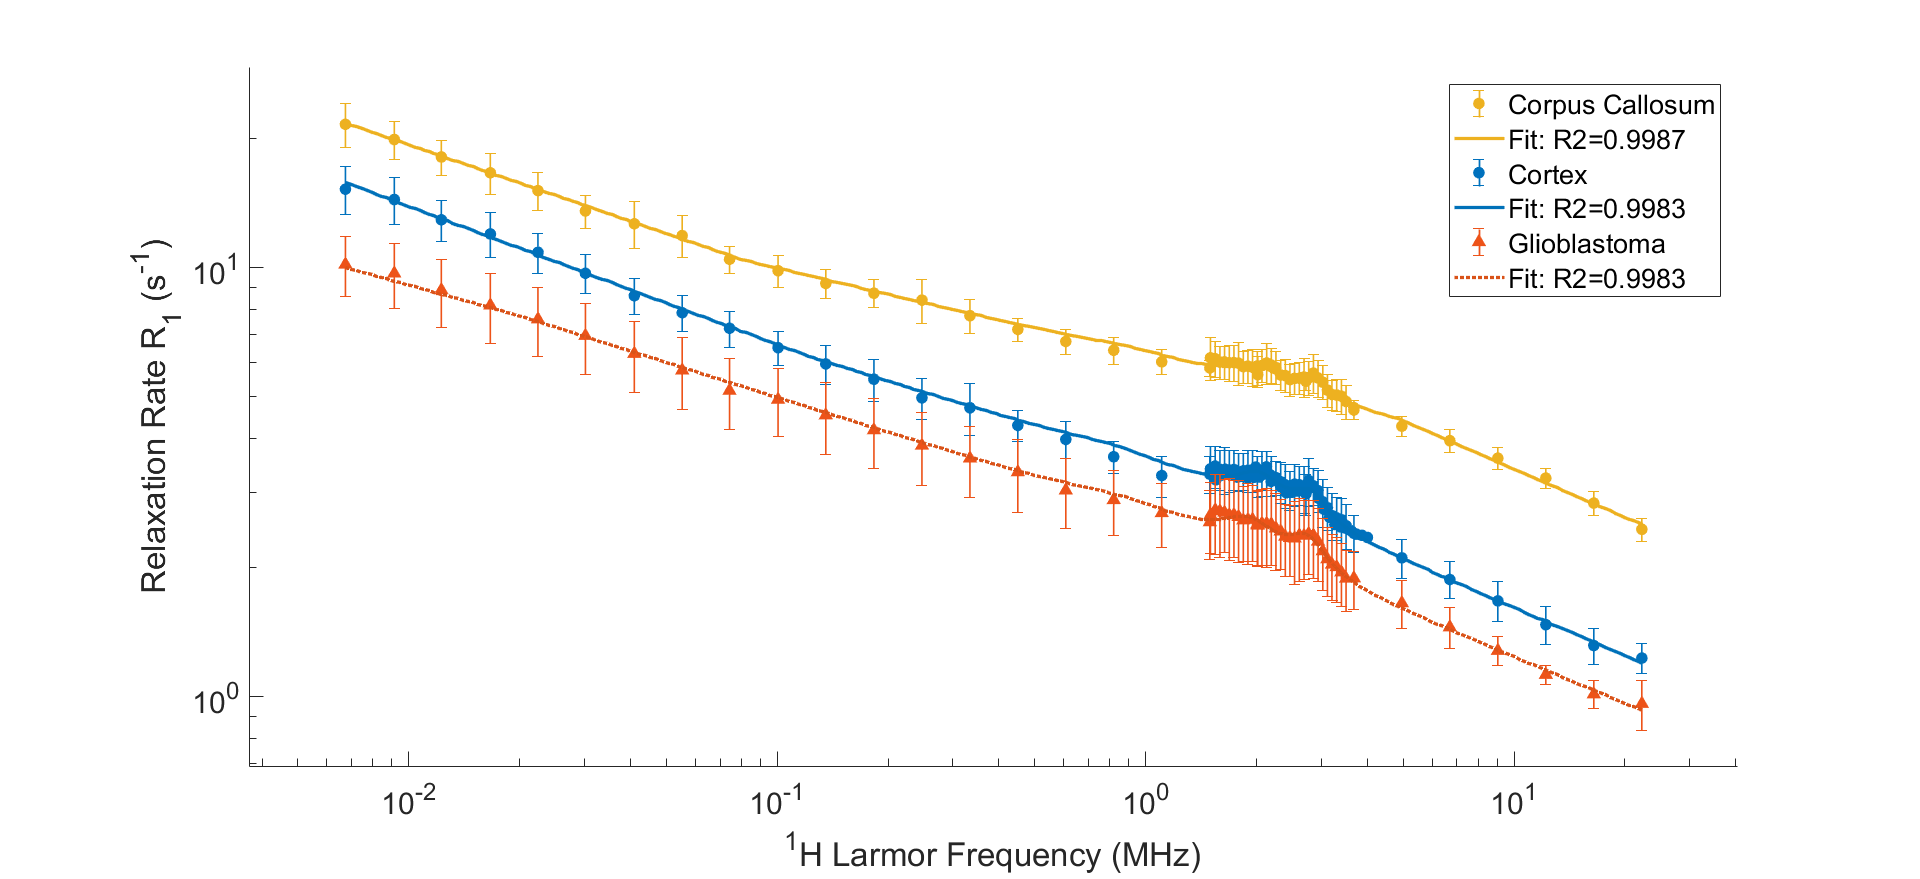
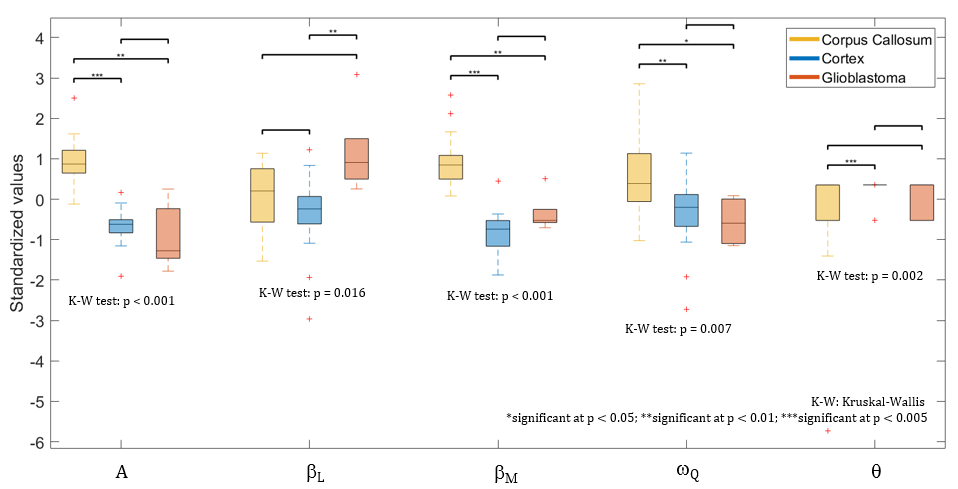
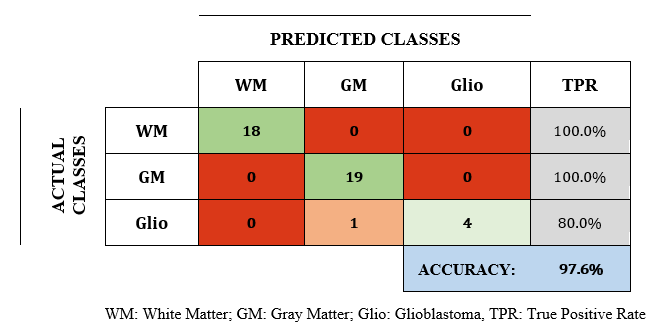
In Fig.2 the mean dispersion curves of human glioblastoma and of pig WM and GM are presented. The curves show a perfect power-law shapes (R>0.99) indicating dominant relaxation by protein matrix2. In all curves the signal of QPs is present and accurately fitted to Eq.2. GM and WM curves are well separated and both are clearly distinct from glioblastoma. In Fig.3, differences are quantified by 5 parameters (A, βL, βM , ωQ, θ) pre-selected according the non-parametric Kruskal–Wallis test. However, classification results are equivalent by retaining only A, βL, βM parameters achieving a classification rate of 100% for WM and GM and 80% for glioblastoma. This result underlines the fact that low fields accessible by FFC are advantageous to discriminate between normal and diseased tissue.Discussion/Conclusion
The mathematical models and analysis were found powerful to exploit T1-dispersion curves. Only one glioblastoma sample was wrongly classified but its histology indicated a low tissue heterogeneity.
The parameter A confirms that T1 differences at low field are much greater between normal and diseased tissue but this study reveals in particular the role of βL, βM parameters to characterize glioblastoma with a new contrast of molecular dynamics.
QPs parameters also appear as possible biomarkers but signal sensitivity should be increased. This work will be extended to understand βL and βM correlations with tissue micro-environment changes.
Acknowledgements
No acknowledgement found.References
1. Broche LM , Huang Y , Pierre S, Berger F , Lurie D J , Fries PF , and Lahrech H, Fast Field-Cycling NMR of human glioma resections: characterization of heterogeneity, ISMRM Honolulu USA (2017)
2. Kimmich, Rainer & Anoardo, Esteban, Field-cycling NMR relaxometry. Progress in Nuclear Magnetic Resonance Spectroscopy, 44. 257-320 (2004).
3. Fries PH, Belorizky E, Simple expressions of the nuclear relaxation rate enhancement due to quadrupole nuclei in slowly tumbling molecules, Journal of Chemical Physics 143 (2015)
Figures