5568
The application of ZOOMit-BOLD for motor function localization in glioma1Department of Neurosurgery, Beijing Tiantan Hospital, Capital Medical University, Beijing, China, Beijing, China, 2HC NEA DI MR COL, SLC, Beijing, China
Synopsis
ZOOMit blood oxygen level dependent fMRI (ZOOMit-BOLD) can excite only a small field of view using simultaneous parallel radiofrequency pulse sequences. It provides high spatial resolution while minimizing aliasing artifacts. This prospective study compared the clinical performances of ZOOMit-BOLD and conventional-BOLD in pre-surgical hand motor function localization. Compared with conventional EPI-based BOLD acquisition, ZOOMit-BOLD is a reliable technology with higher accuracy in preoperative motor functional localization in clinical patients with gliomas, particularly when the glioma directly invades the primary motor cortex.
Introduction
The conventional-BOLD fMRI has been used to localize the motor function cortex and guide intraoperative function mapping for nearly 30 years. Although this technique has some limitations that can lead to inaccurate localization, it remains the most prevalent technique.1-8 The new ZOOMit-BOLD sequence can selectively excite a small field of view (FOV) using simultaneous parallel radiofrequency pulse sequences,9-12 which can provide high spatial resolution while avoiding or minimizing aliasing artifacts. This prospective study compared the reliability of task-fMRI based on ZOOMit-BOLD and conventional-BOLD for pre-surgical motor functional mapping in the same series of patients with gliomas involving the motor areas. Intraoperative direct cortical stimulation (DCS) was used as the gold standard.Methods
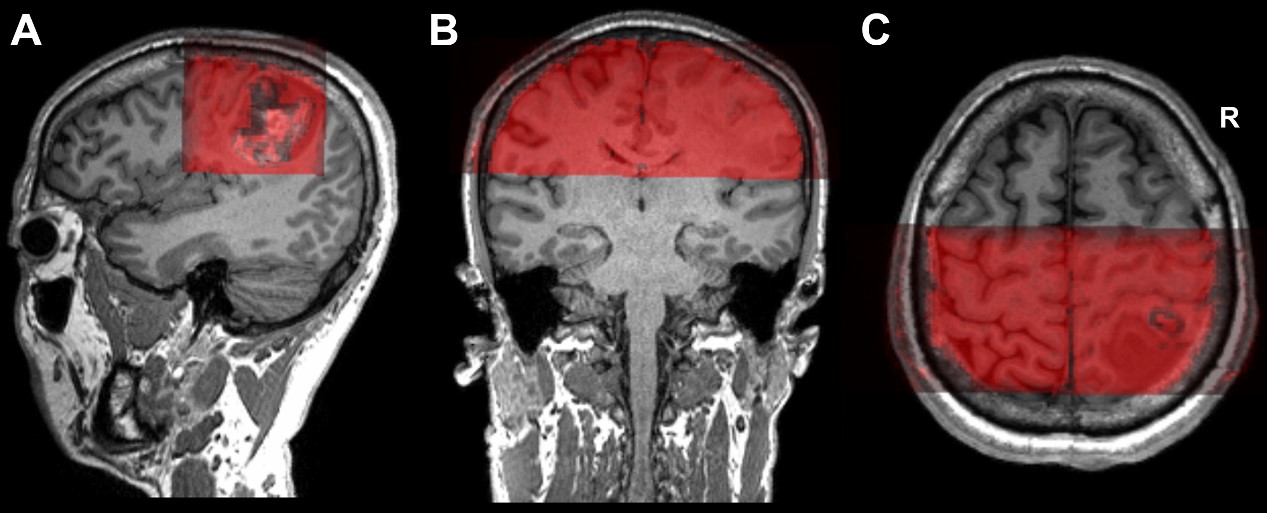
In this study, twelve patients with motor area gliomas were enrolled. MR data was collected on a MAGNETOM Prisma 3T MR scanner (Siemens Healthcare, Erlangen, Germany) with a 64-channel head/neck coil. Anatomical images of each lesion were collected with T1 Magnetization-Prepared Rapid Acquisition Gradient Echo (MPRAGE) (TR = 2300 ms, TE = 2.3 ms, flip angle = 8º, FOV = 240 × 240 mm2, voxel size = 1 × 1 × 1 mm3, slice number = 192, and slice thickness = 1 mm). The parameters of the conventional BOLD were as follows: single-shot echo-planar imaging sequence, TR = 3000 ms, TE = 30 ms, flip angle = 90º, FOV = 220 × 220 mm2, voxel size = 3 × 3 × 3 mm3, slice number = 44, and slice thickness = 3 mm). The parameters of the ZOOMit-BOLD were as follows: TR = 1500 ms, TE = 30 ms, flip angle = 90º, FOV = 220 × 76 mm2, FOV phase = 34.4% (Fig. 1), voxel size = 1.5 × 1.5 × 3.0 mm3, slice number = 21, and slice thickness = 3 mm. The hand motor cortex was identified by one of the authors with experience over 10 years in awake craniotomy. The procedure of intraoperative brain mapping was similar to that used in a previous study.13 To characterize the DCS results, a spherical region of 5 mm diameter was delineated based on each positive site. According to the intraoperative photos and videos, two neuroradiologists individually drew the positive region manually using MRIcron software . If the areas of the selected region varied from each other by more than 5%, another neuroradiologist with 20 years’ experience made the final decision. The number of overlapping voxels between DCS and conventional-BOLD, or between DCS and ZOOMit-BOLD, was calculated using MATLAB 2014a. In addition, an overlap index was calculated as a ratio with the following formula: $Overlap Index =(Number of Overlapping Voxels)/(Total Voxels of conventional BOLD or ZOOMit BOLD)$
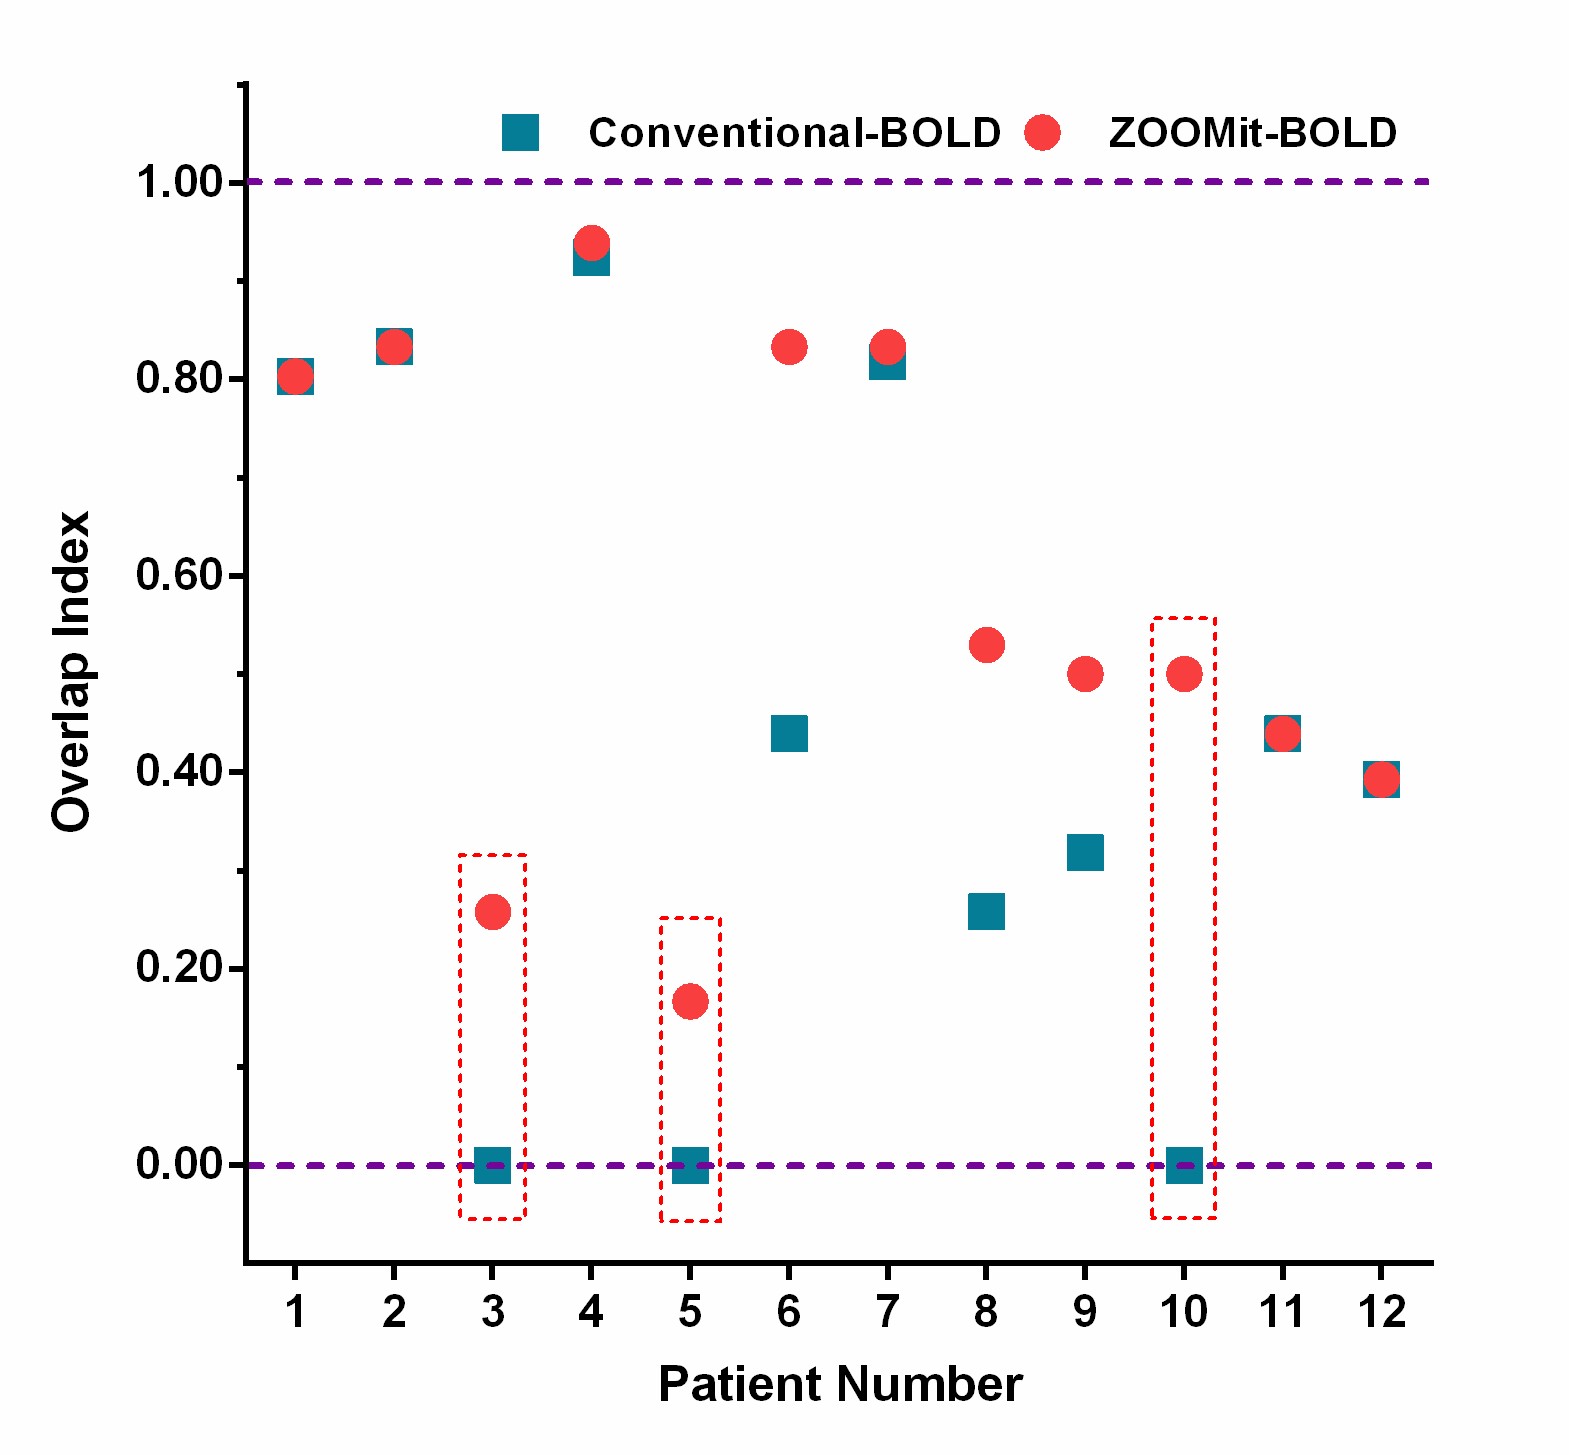
An overlap phenomenon was defined as the overlap index being higher than zero. In contrast, a no n-overlap phenomenon was defined when the index was zero.
Result
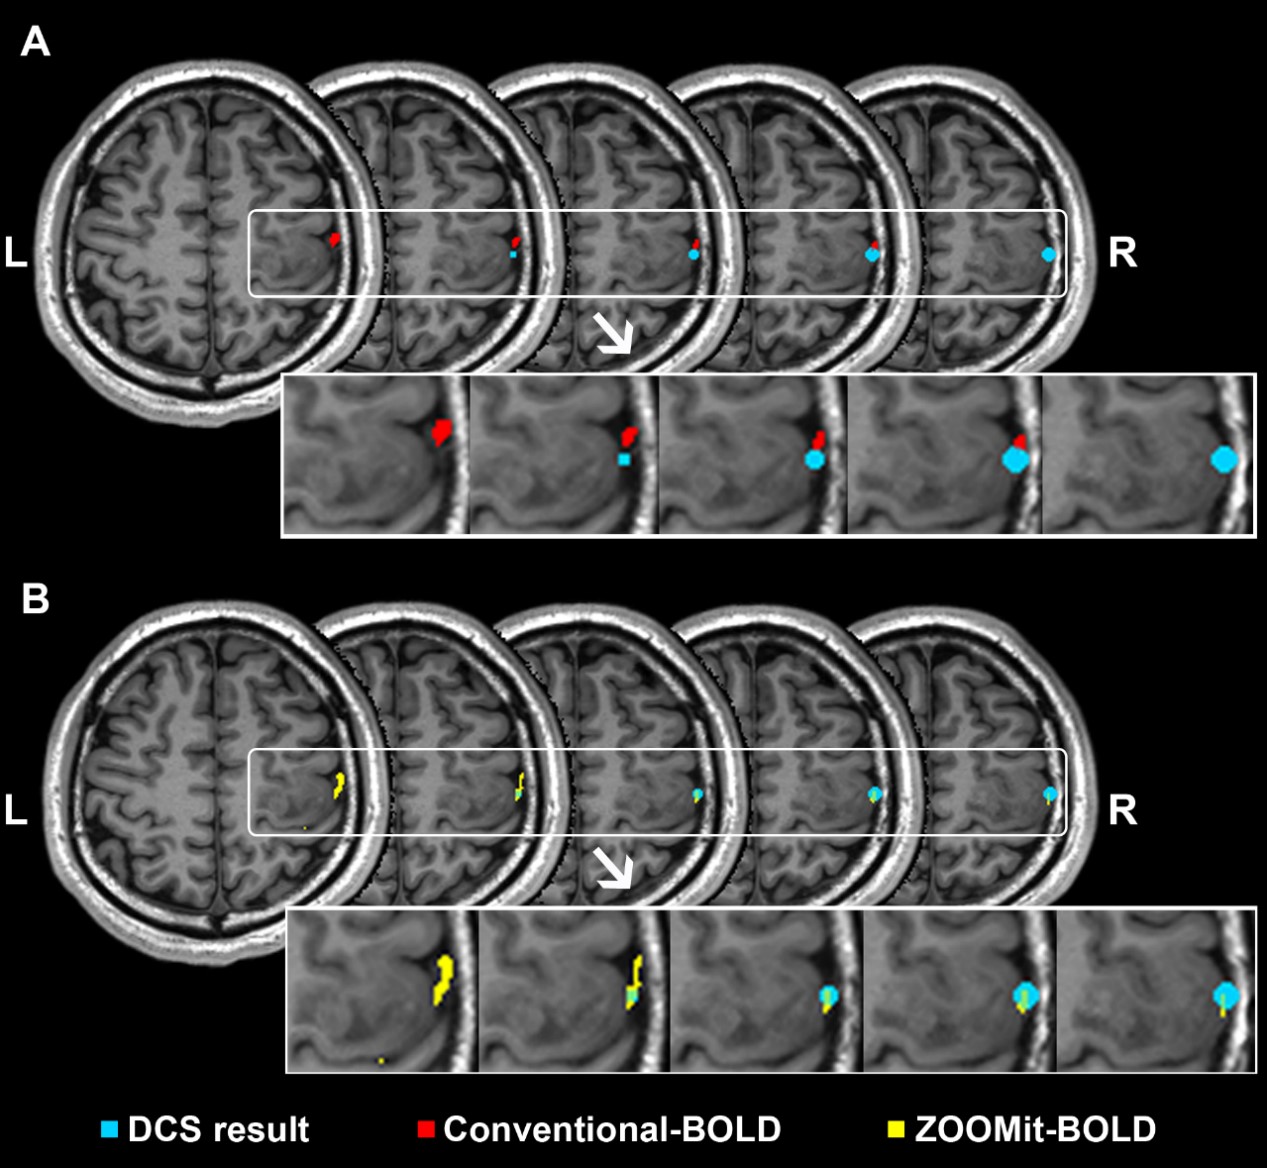
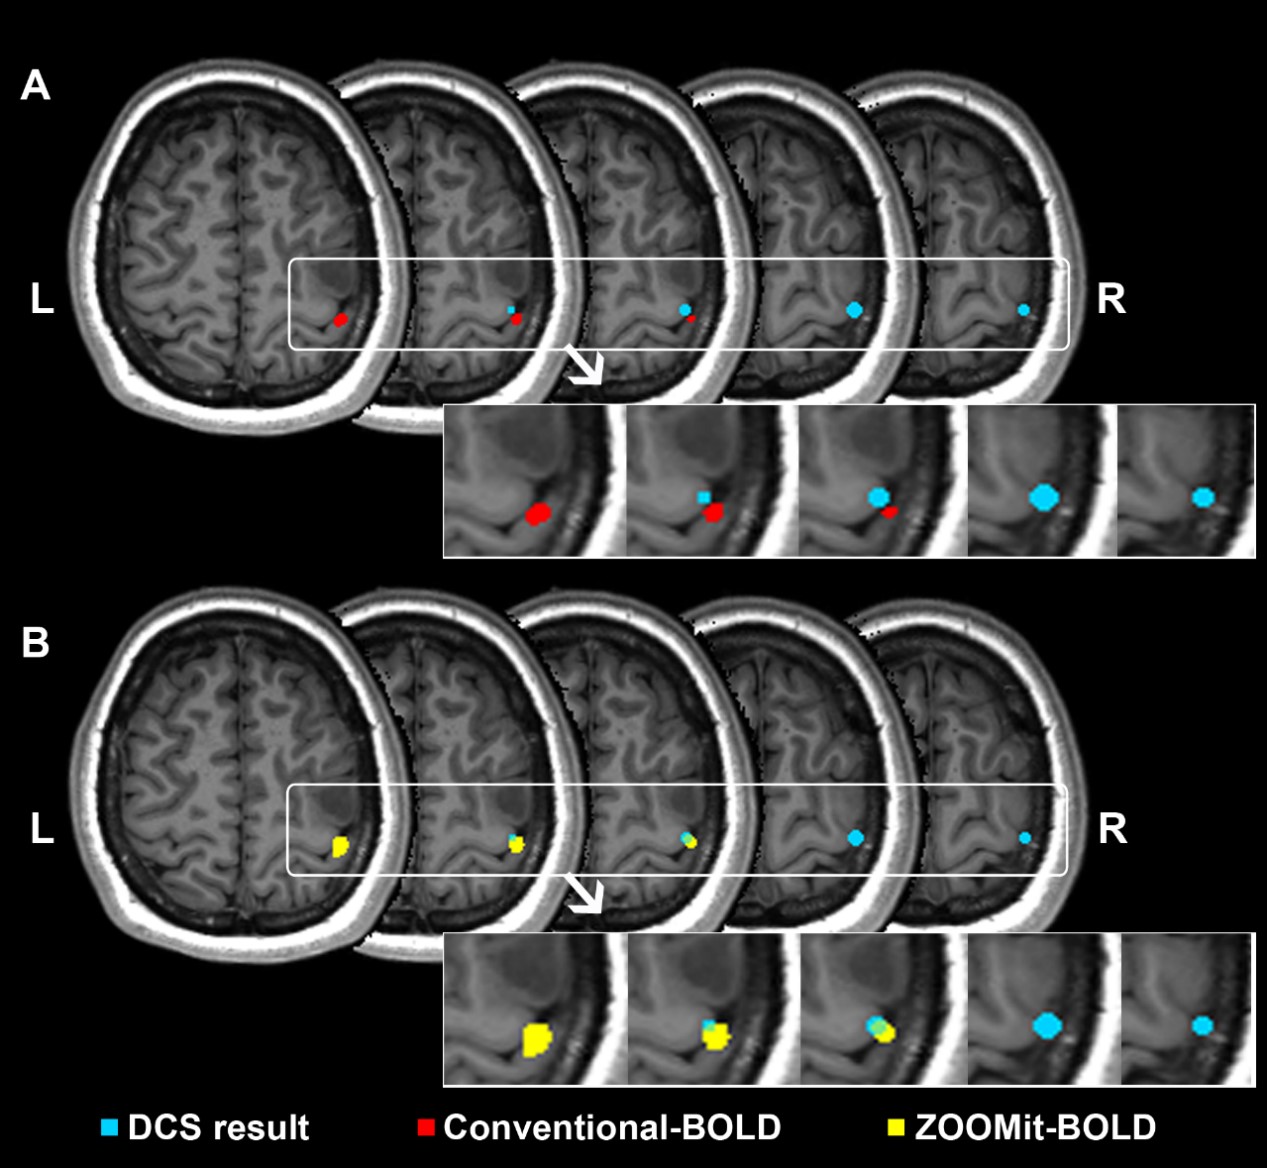
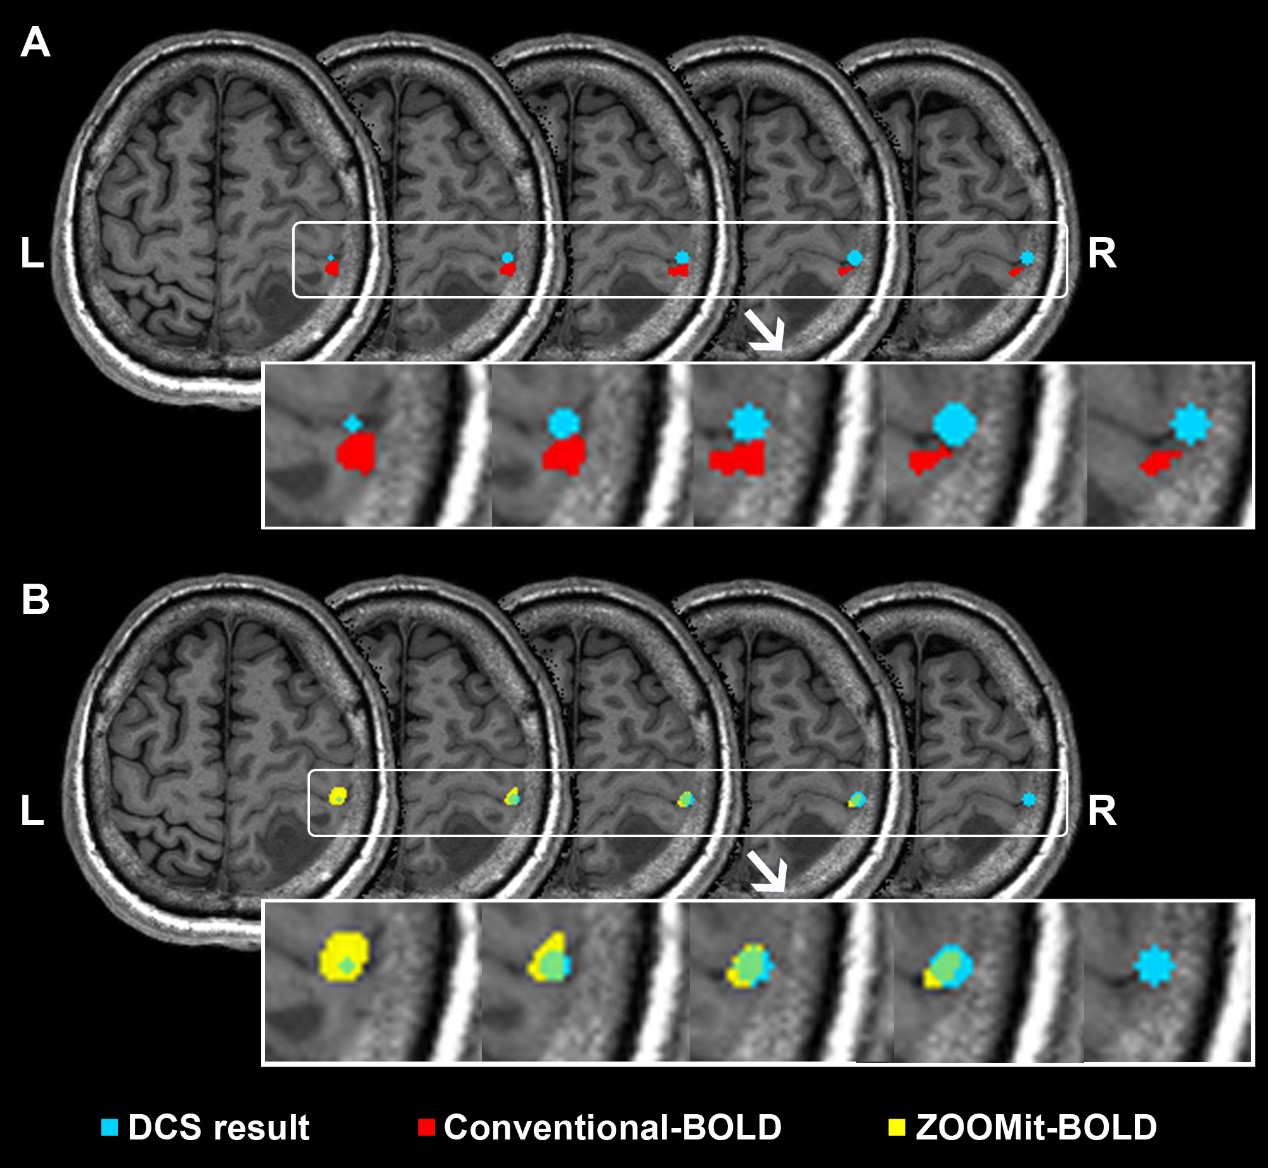
When using ZOOMit-BOLD technology, all activated regions were localized on the region of hand-knob. The average overlap index was 0.59. None of the patients had non-overlap phenomena. In contrast, when using conventional-BOLD, three patients (No. 3, No. 5, and No. 10; their results are shown in Fig. 2, Fig. 3 and Fig. 4) demonstrated a non-overlap pattern (overlapping index = 0). Their cortices-related motor functions were located on the posterior central gyrus and the accuracy of localization was 75.0% (9/12). There were eight patients (66.7%) whose overlap indexes were higher in the ZOOMit-BOLD session than in the conventional-BOLD session. In the other four patients (33.3%), no differences in the overlap indexes were found between the ZOOMit-BOLD localization and conventional-BOLD localization (Fig. 5).Discussion
Conclusion
Compared with conventional-BOLD, ZOOMit-BOLD is a reliable technology with higher accuracy in preoperative motor function localization in clinical patients with gliomas, particularly when the glioma directly invades the primary motor cortex.Acknowledgements
No acknowledgement found.References
1. Yamaki T, Nonaka T, Akiyama K, Tanabe S, Hashi K. Supratentorial glioma manifesting as acute onset of pure motor hemiparesis--case report. Neurologia medico-chirurgica. May 1997;37(5):422-425. 2. Pujol J, Conesa G, Deus J, Lopez-Obarrio L, Isamat F, Capdevila A. Clinical application of functional magnetic resonance imaging in presurgical identification of the central sulcus. J Neurosurg. May 1998;88(5):863-869. 3. Lehericy S, Duffau H, Cornu P, et al. Correspondence between functional magnetic resonance imaging somatotopy and individual brain anatomy of the central region: comparison with intraoperative stimulation in patients with brain tumors. J Neurosurg. Apr 2000;92(4):589-598. 4. Majos A, Tybor K, Stefanczyk L, Goraj B. Cortical mapping by functional magnetic resonance imaging in patients with brain tumors. Eur Radiol. Jun 2005;15(6):1148-1158. 5. Pirotte B, Voordecker P, Neugroschl C, et al. Combination of functional magnetic resonance imaging-guided neuronavigation and intraoperative cortical brain mapping improves targeting of motor cortex stimulation in neuropathic pain. Neurosurgery. Jun 2008;62(6 Suppl 3):941-956. 6. Pujol J, Deus J, Acebes JJ, et al. Identification of the sensorimotor cortex with functional MRI: frequency and actual contribution in a neurosurgical context. J Neuroimaging. Jan 2008;18(1):28-33. 7. Xie J, Chen XZ, Jiang T, et al. Preoperative blood oxygen level-dependent functional magnetic resonance imaging in patients with gliomas involving the motor cortical areas. Chin Med J (Engl). Apr 5 2008;121(7):631-635. 8. Bartos R, Jech R, Vymazal J, et al. Validity of primary motor area localization with fMRI versus electric cortical stimulation: a comparative study. Acta Neurochir (Wien). Sep 2009;151(9):1071-1080. 9. Wheeler-Kingshott CA, Parker GJ, Symms MR, et al. ADC mapping of the human optic nerve: increased resolution, coverage, and reliability with CSF-suppressed ZOOM-EPI. Magn Reson Med. Jan 2002;47(1):24-31. 10. Thierfelder KM, Scherr MK, Notohamiprodjo M, et al. Diffusion-weighted MRI of the prostate: advantages of Zoomed EPI with parallel-transmit-accelerated 2D-selective excitation imaging. Eur Radiol. Dec 2014;24(12):3233-3241. 11. Rosenkrantz AB, Chandarana H, Pfeuffer J, et al. Zoomed echo-planar imaging using parallel transmission: impact on image quality of diffusion-weighted imaging of the prostate at 3T. Abdom Imaging. Jan 2015;40(1):120-126. 12. Ream JM, Glielmi C, Lazar M, et al. Zoomed echo-planar diffusion tensor imaging for MR tractography of the prostate gland neurovascular bundle without an endorectal coil: a feasibility study. Abdom Radiol (NY). May 2016;41(5):919-925. 13. Duffau H, Capelle L, Denvil D, et al. Usefulness of intraoperative electrical subcortical mapping during surgery for low-grade gliomas located within eloquent brain regions: functional results in a consecutive series of 103 patients. J Neurosurg. Apr 2003;98(4):764-778. 14. Zhang D, Fox MD, Leuthardt EC, et al. Preoperative sensorimotor mapping in brain tumor patients using spontaneous fluctuations in neuronal activity imaged with functional magnetic resonance imaging: initial experience. Neurosurgery. Dec 2009;65(6 Suppl):226-236. 15. Schreiber A, Hubbe U, Ziyeh S, Hennig J. The influence of gliomas and nonglial space-occupying lesions on blood-oxygen-level-dependent contrast enhancement. AJNR Am J Neuroradiol. Jun-Jul 2000;21(6):1055-1063. 16. Chen CM, Hou BL, Holodny AI. Effect of age and tumor grade on BOLD functional MR imaging in preoperative assessment of patients with glioma. Radiology. Sep 2008;248(3):971-978. 17. Zaca D, Jovicich J, Nadar SR, Voyvodic JT, Pillai JJ. Cerebrovascular reactivity mapping in patients with low grade gliomas undergoing presurgical sensorimotor mapping with BOLD fMRI. J Magn Reson Imaging. Aug 2014;40(2):383-390.Figures