5561
Intra- and inter-scanner reliability of scaled subprofile model of principal component analysis in resting-state fMRI1Center for Brain Imaging Science and Technology, Key Laboratory for Biomedical Engineering of Ministry of Education, College of Biomedical Engineering and Instrumental Science, Zhejiang University, Hangzhou, China, 2Center for Cognition and Brain Disorders and the Affiliated Hospital,Zhejiang Key Laboratory for Research in Assessment of Cognitive Impairments, Institutes of Psychological Sciences, Hangzhou Normal University, Hangzhou, China, 3Research Center of Brain and Cognitive Neuroscience, Liaoning Normal University, Liaoning, China, 4Center for Neurosciences, the Feinstein Institute of Medical Research, Manhasset, NY, United States
Synopsis
Scaled subprofile model of principal component analysis (SSM-PCA) is a multivariate statistical method, widely used in positron emission tomography (PET). Recently, SSM-PCA has been applied to resting-state functional MRI (RS-fMRI). However, the intra- and inter-scanner reliability of SSM-PCA in RS-fMRI is not investigated systematically yet. Results from eyes-open (EO) and eyes-closed (EC) dataset demonstrate that both the intra- and inter-scanner reliability is excellent for EO and EC related covariance pattern (EOEC-pattern) and fair to good for EOEC-pattern’s expression. Moreover, SSM-PCA and conventional T-test are complementary for neuroimaging researches. This study illustrates the great potential of SSM-PCA for further applications in RS-fMRI.
Introduction
Scaled subprofile model of principal component analysis (SSM-PCA) is a multivariate statistical method and has been widely used in positron emission tomography (PET)1~3. Recently, SSM-PCA has been applied to successfully discriminate patients with Parkinson’s disease and healthy controls with amplitude of low frequency fluctuation (ALFF) from resting-state functional magnetic resonance imaging (RS-fMRI)4. As RS-fMRI scans are more generally available than PET scans and increasing research interest is focused on the ability to combine the data from multiple scanners into larger and integrative data sets, the intra- and inter-scanner reliability is very important for a data analysis method for its wide application in RS-fMRI. However, the intra- and inter-scanner reliability of SSM-PCA in RS-fMRI is yet to be investigated systematically. The present study aims to: 1) investigate the intra- and inter-scanner reliability of SSM-PCA on the difference in ALFF between eyes open (EO) and eyes closed (EC) RS-fMRI conditions; 2) assess the similarity between the EO and EC difference-related pattern and the conventional univariate statistical T map.Materials and Methods
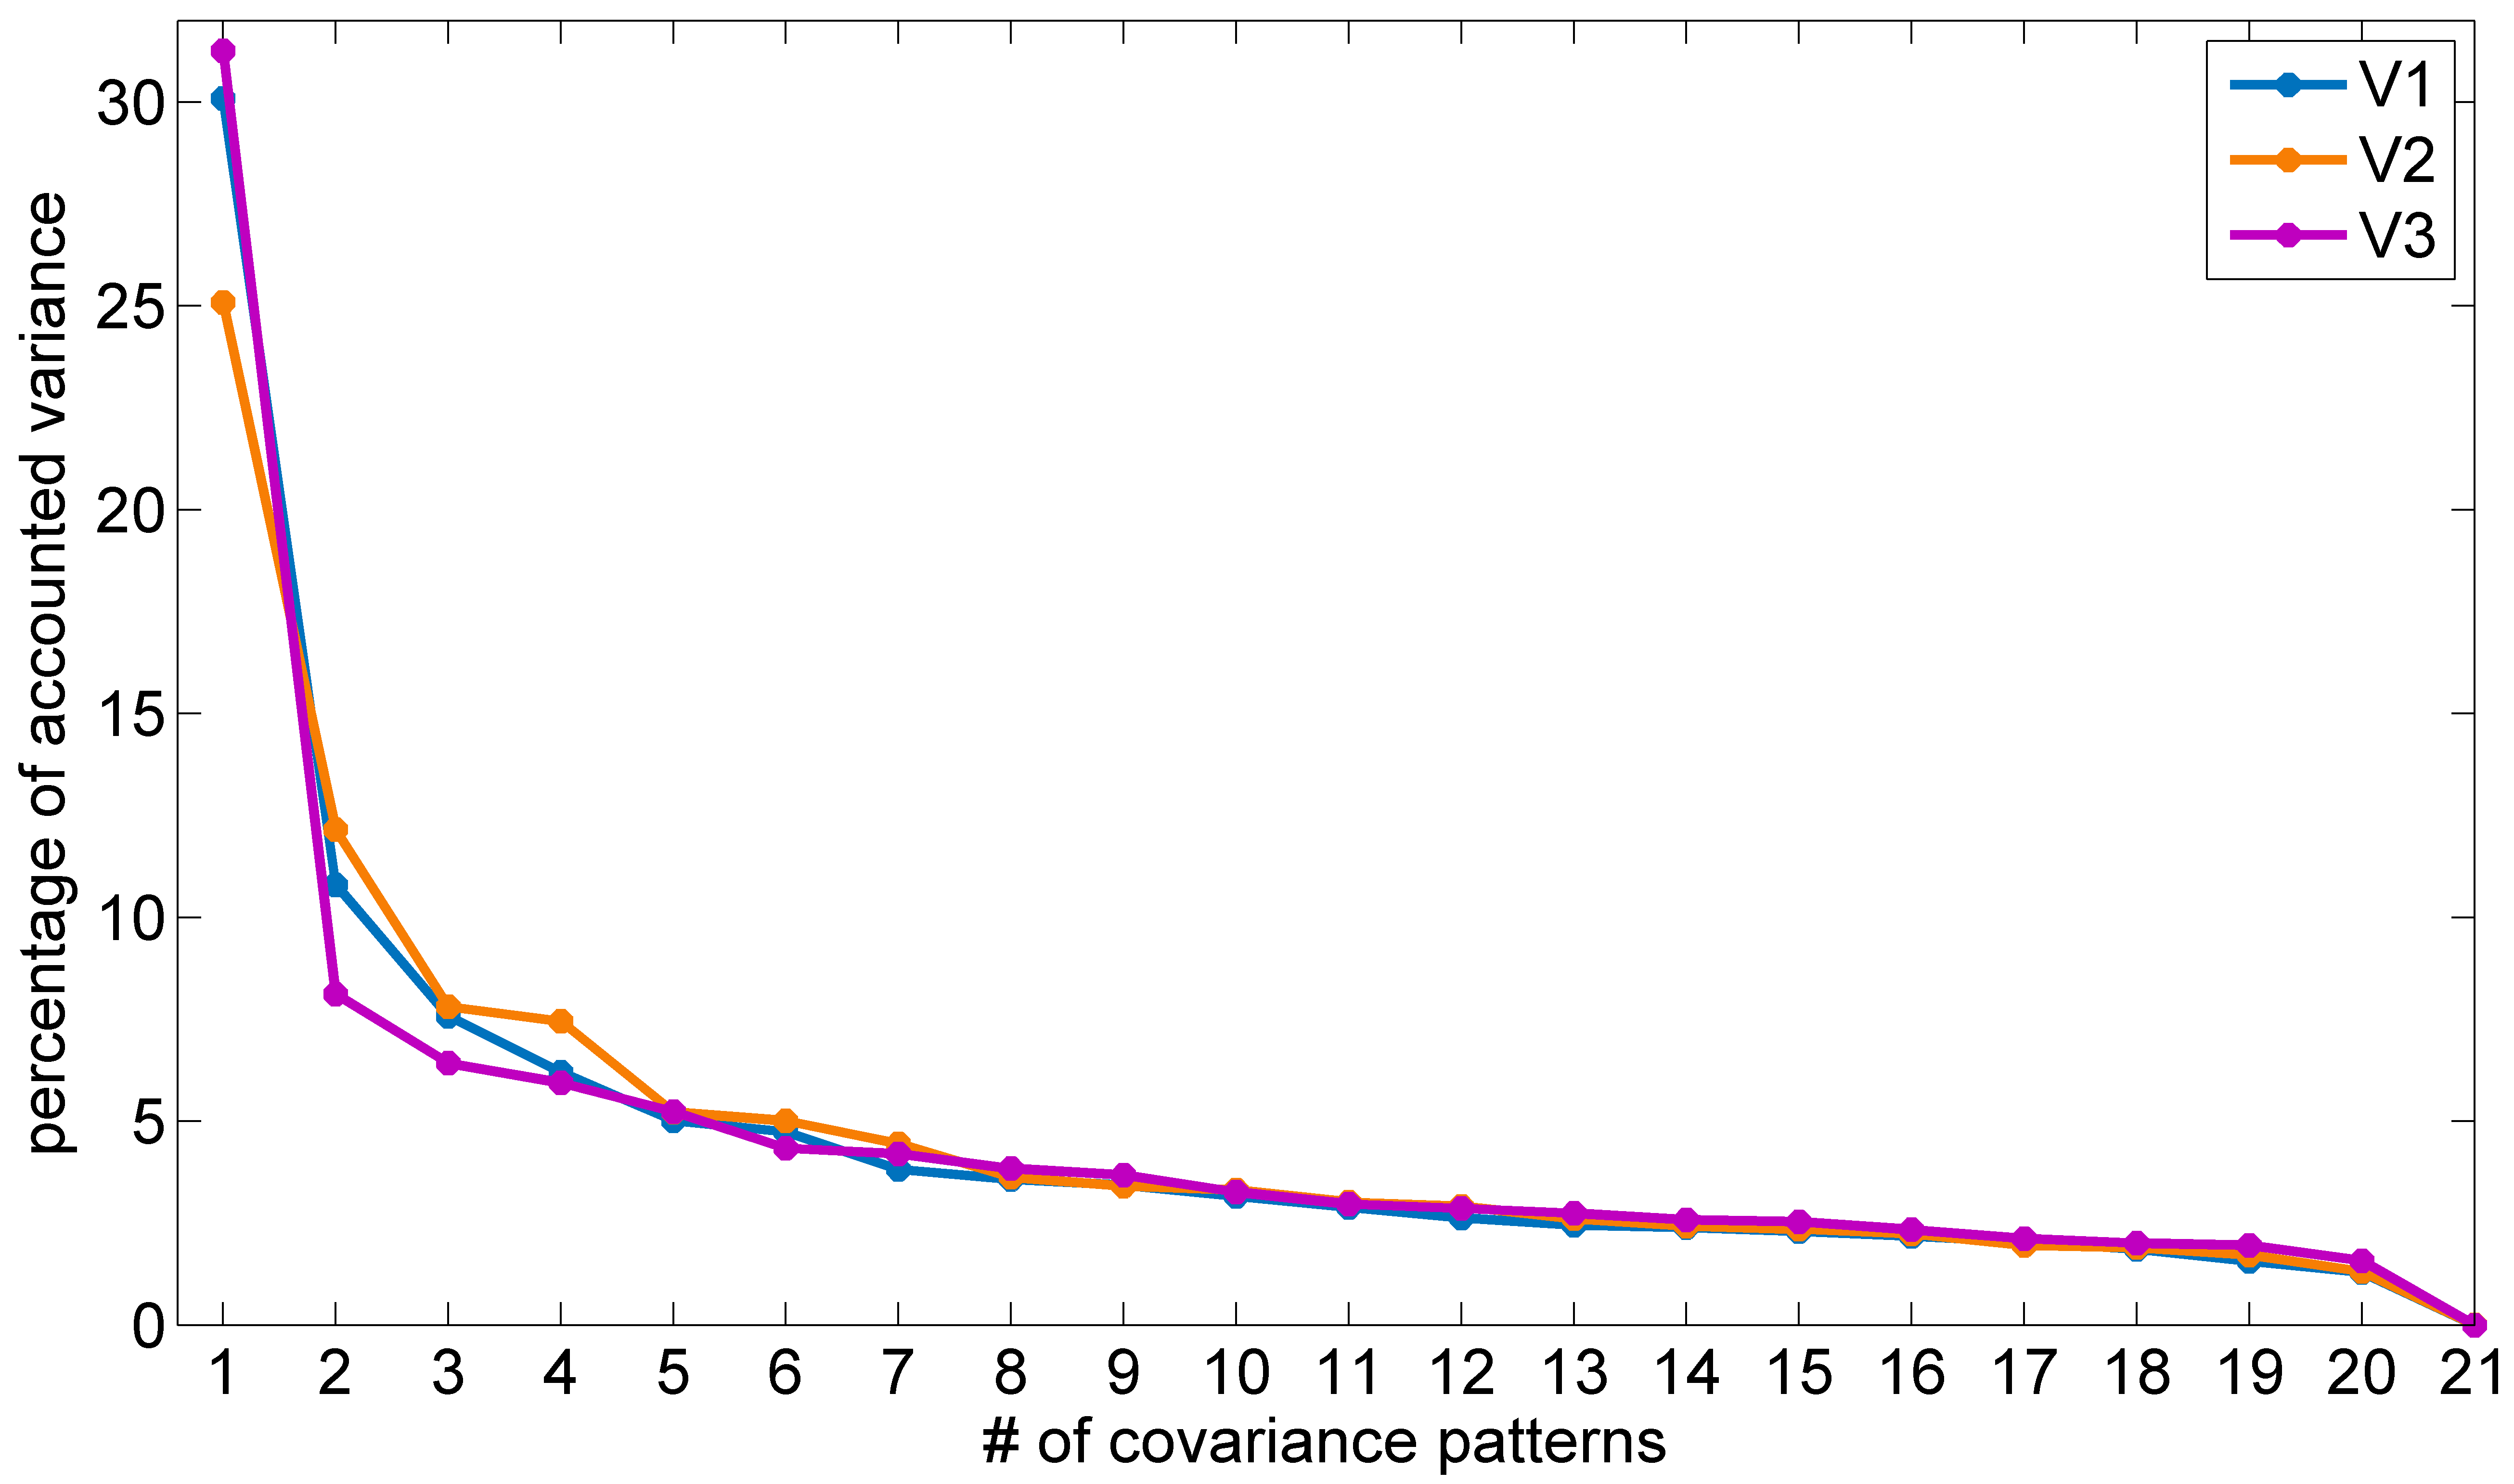
RS-fMRI dataset with EO and EC was obtained in 21 healthy subjects (21.8 ± 1.8 years old, 11 females) on 3 visits (V1, V2, and V3), with V1 and V2 (about 14 days apart) on a GE MR-750 3T scanner (GE Medical Systems, Milwaukee, WI) and V3 (about 8 months from V2) on a Siemens MAGNETOM Prisma 3T scanner (Siemens Healthineers, Erlangen, Germany). The blood-oxygenation-level-dependent (BOLD) images were acquired using a gradient echo echo-planar imaging pulse sequence with the following parameters: repetition time/echo time = 2000/30 ms, flip angle = 60°, 43 slices with interleaved acquisition, thickness/gap = 3.4/0 mm, field of view = 220 × 220 mm2 with an in-plane resolution of 3.44 × 3.44 mm2. The duration of each resting-state fMRI scan was 8 minutes. For data of V3, the BOLD imaging parameters were the same as V1 and V2 except FA = 90°. The 3D T1-weighted images were acquired with a resolution of 1×1×1 mm3. To simulate between-group analysis in conventional SSM-PCA studies, 21 subjects were randomly divided into two groups, i.e., EO-EC group (EO ALFF map minus EC ALFF map, n = 10) and EC-EO group (n = 11). A series of covariance patterns and their expressions in each subject were derived for each visit with same procedures detailed in Ref.4. The similarity between EO and EC difference-related pattern and the conventional univariate statistical T map was assessed with dice similarity coefficient (DSC).Results
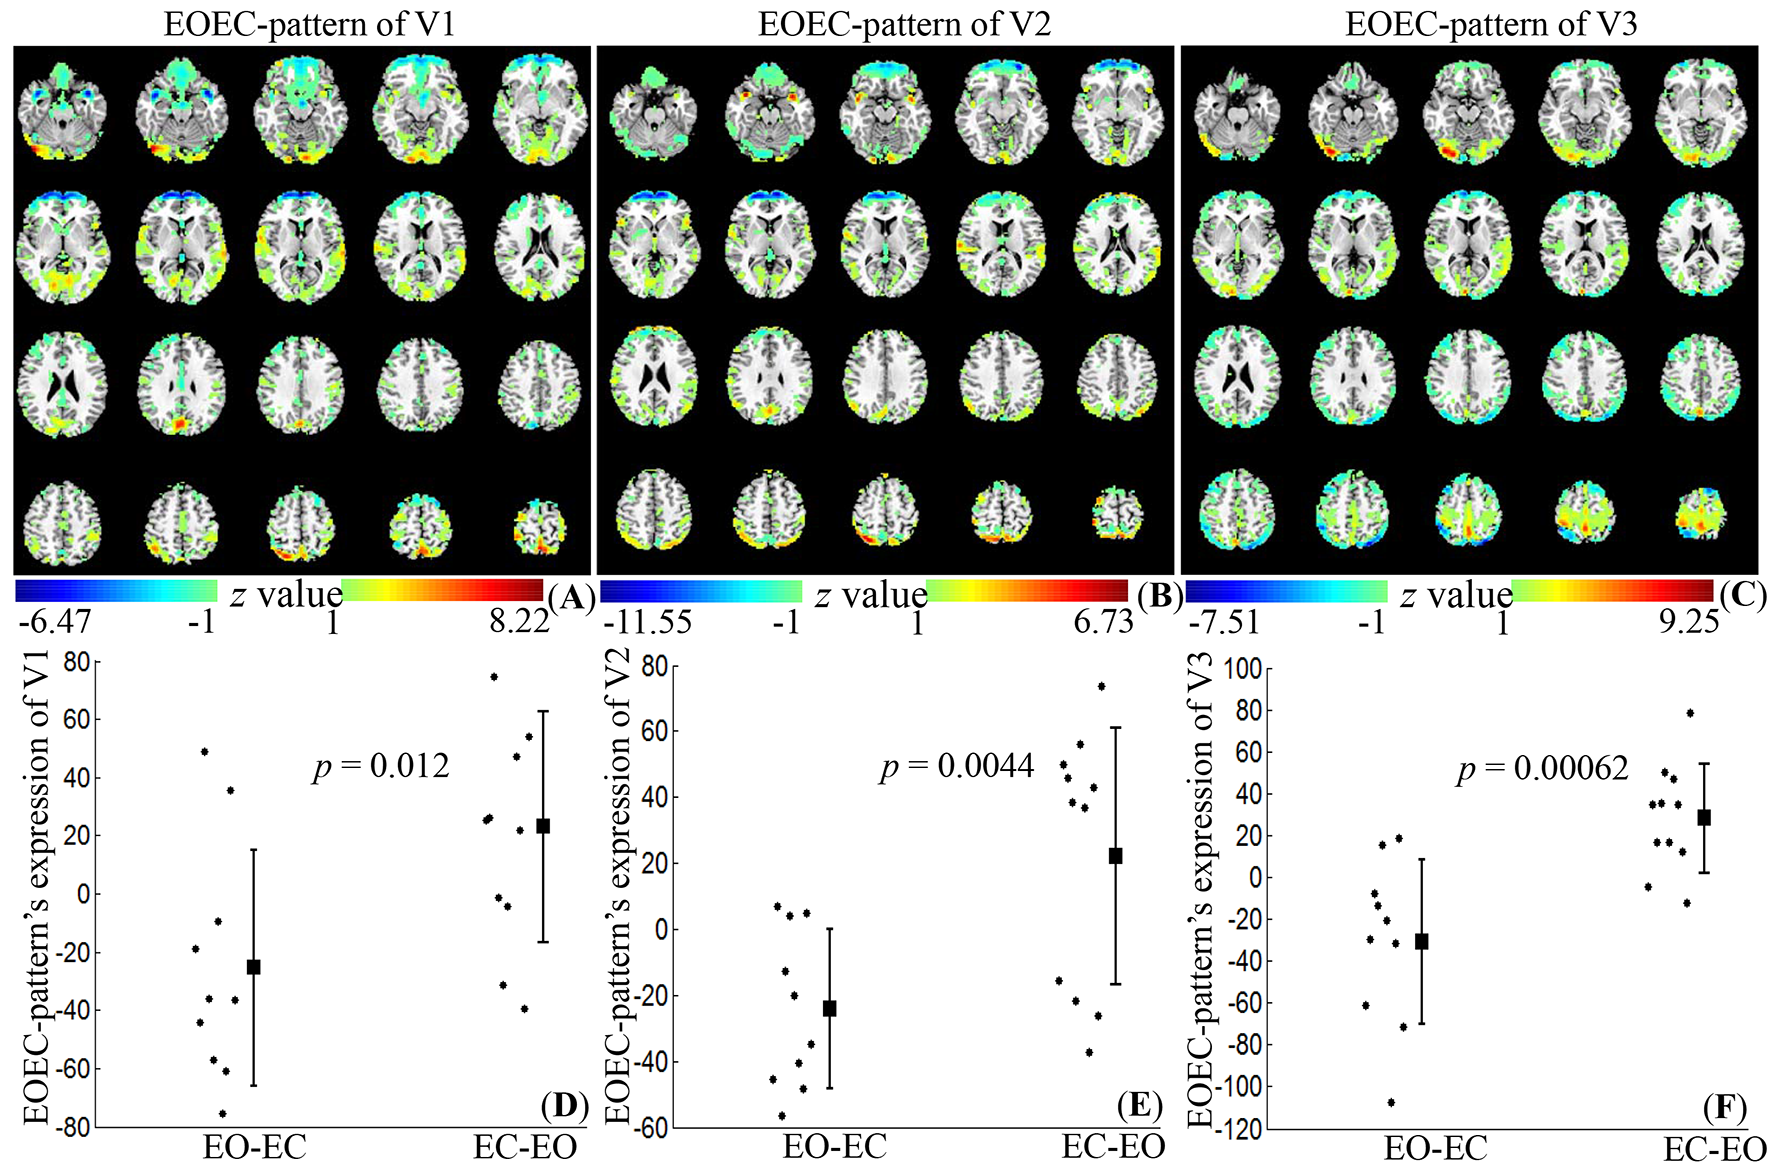
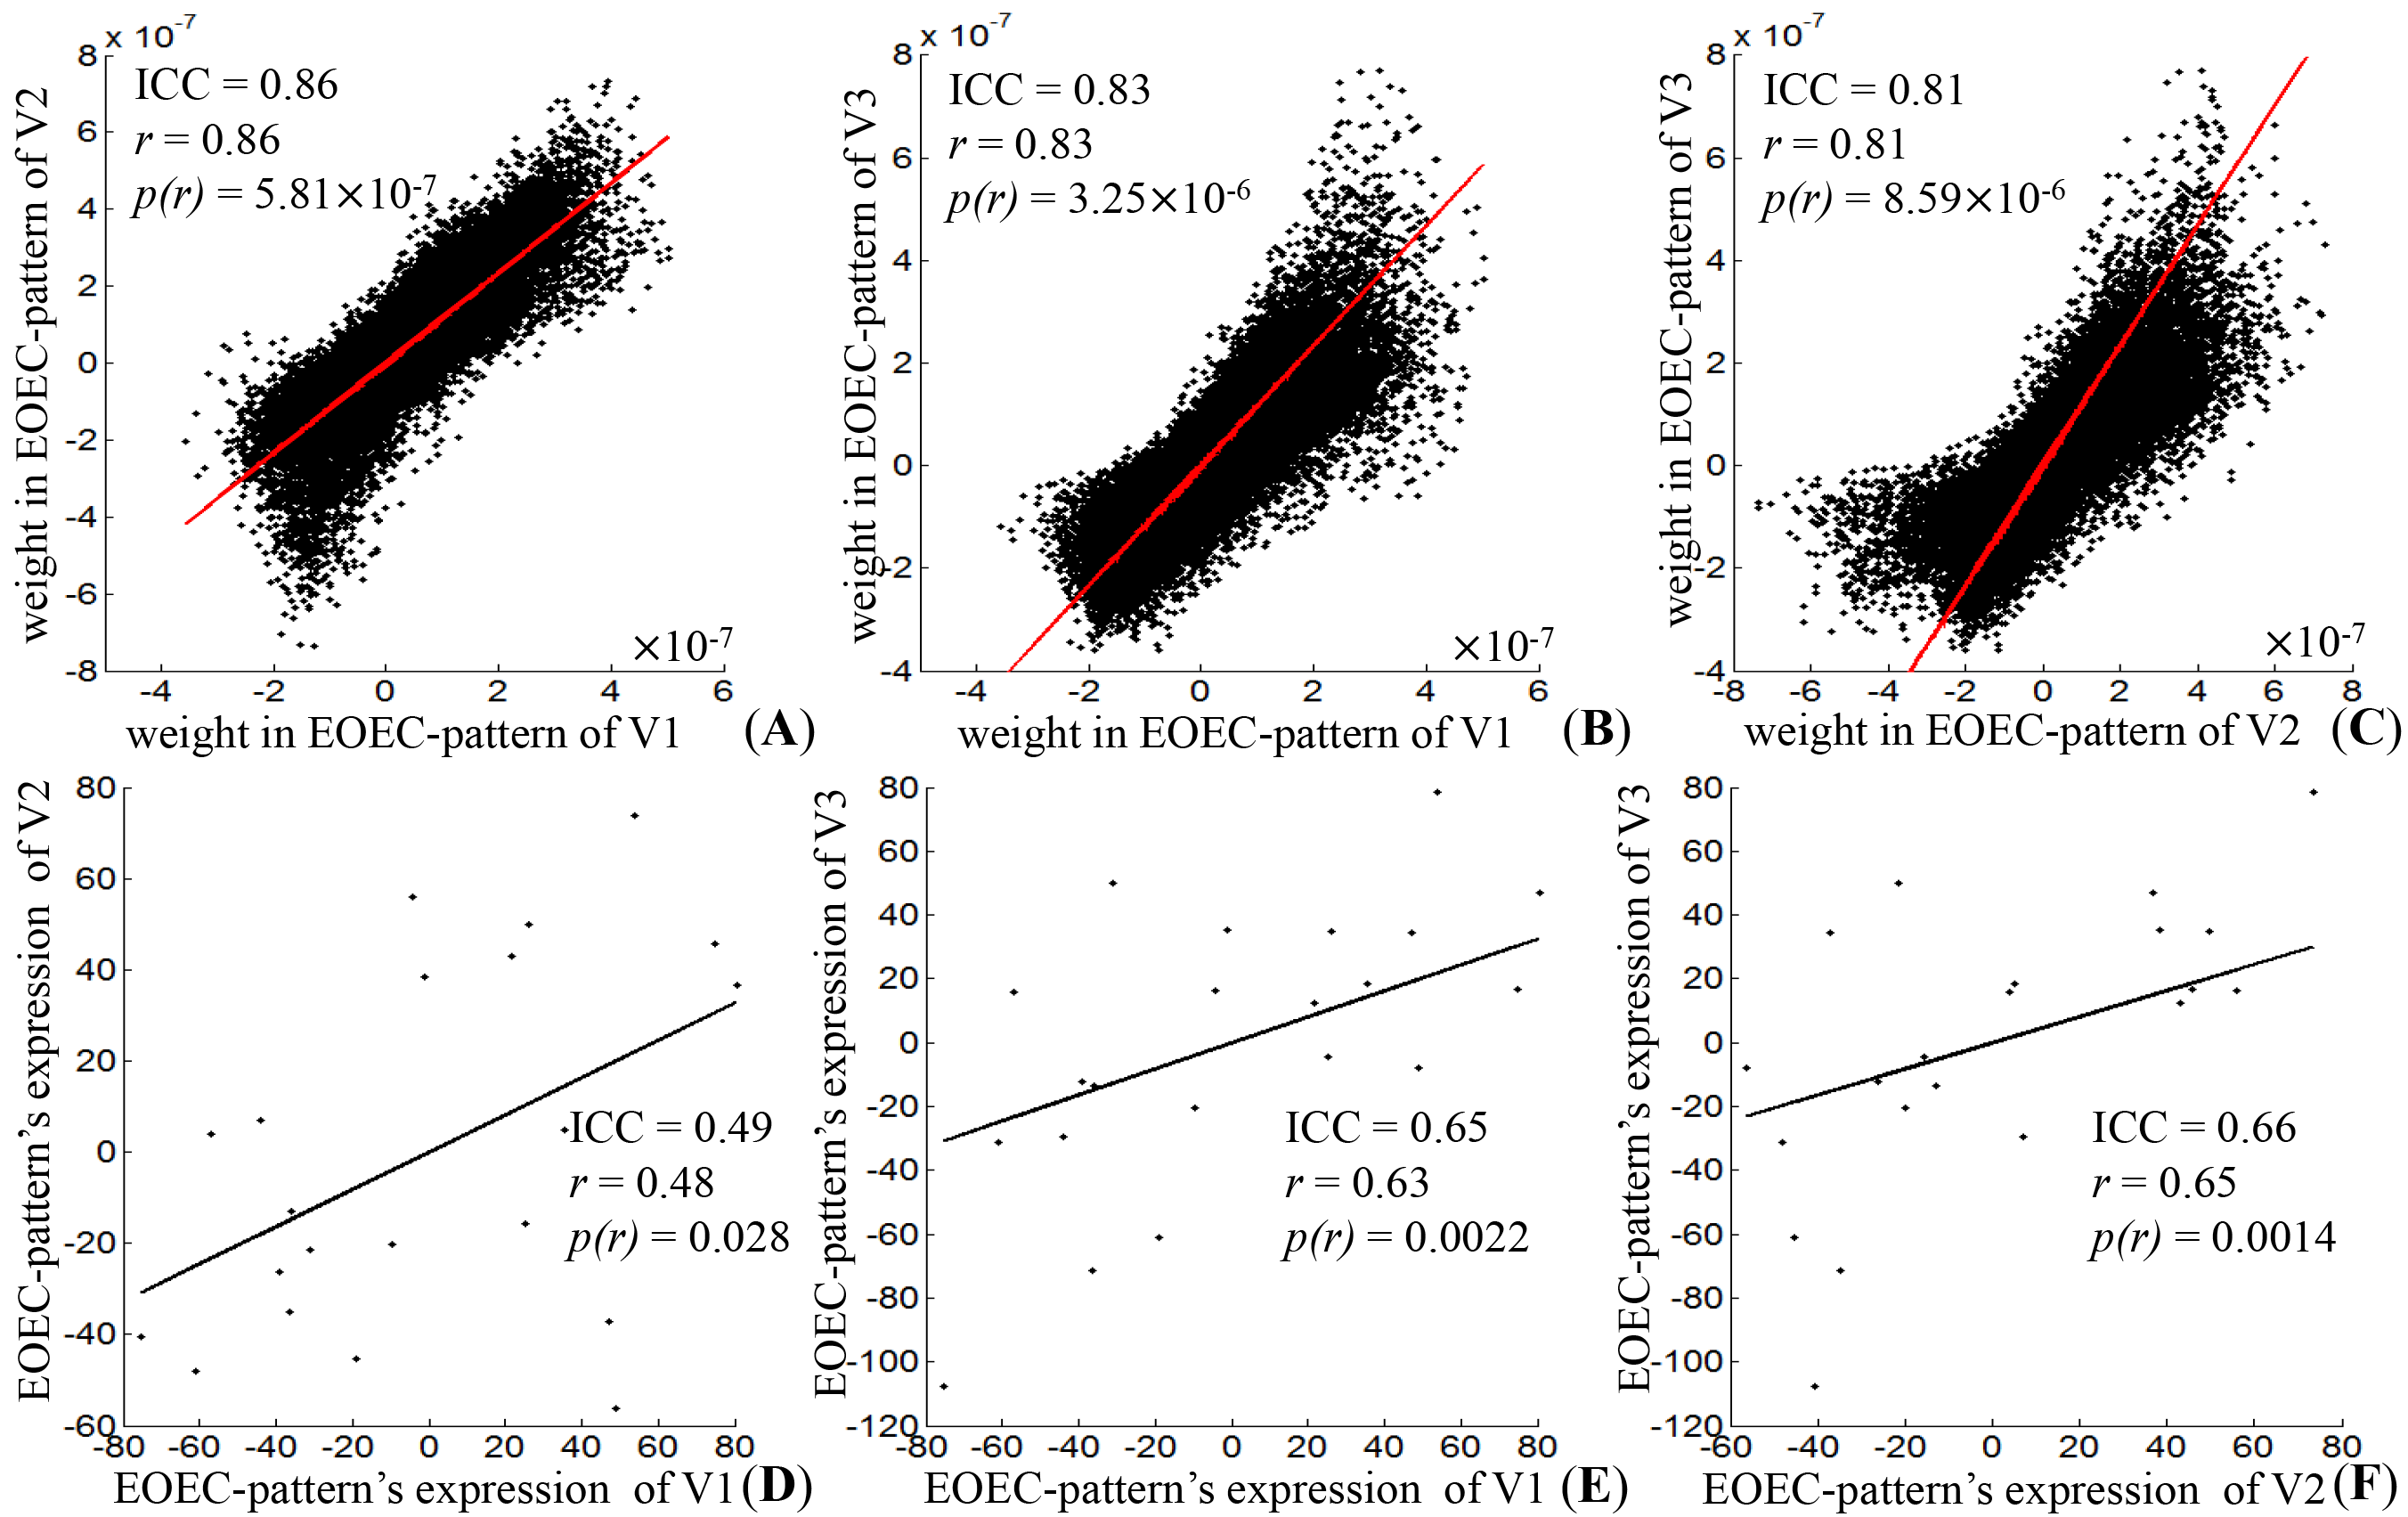
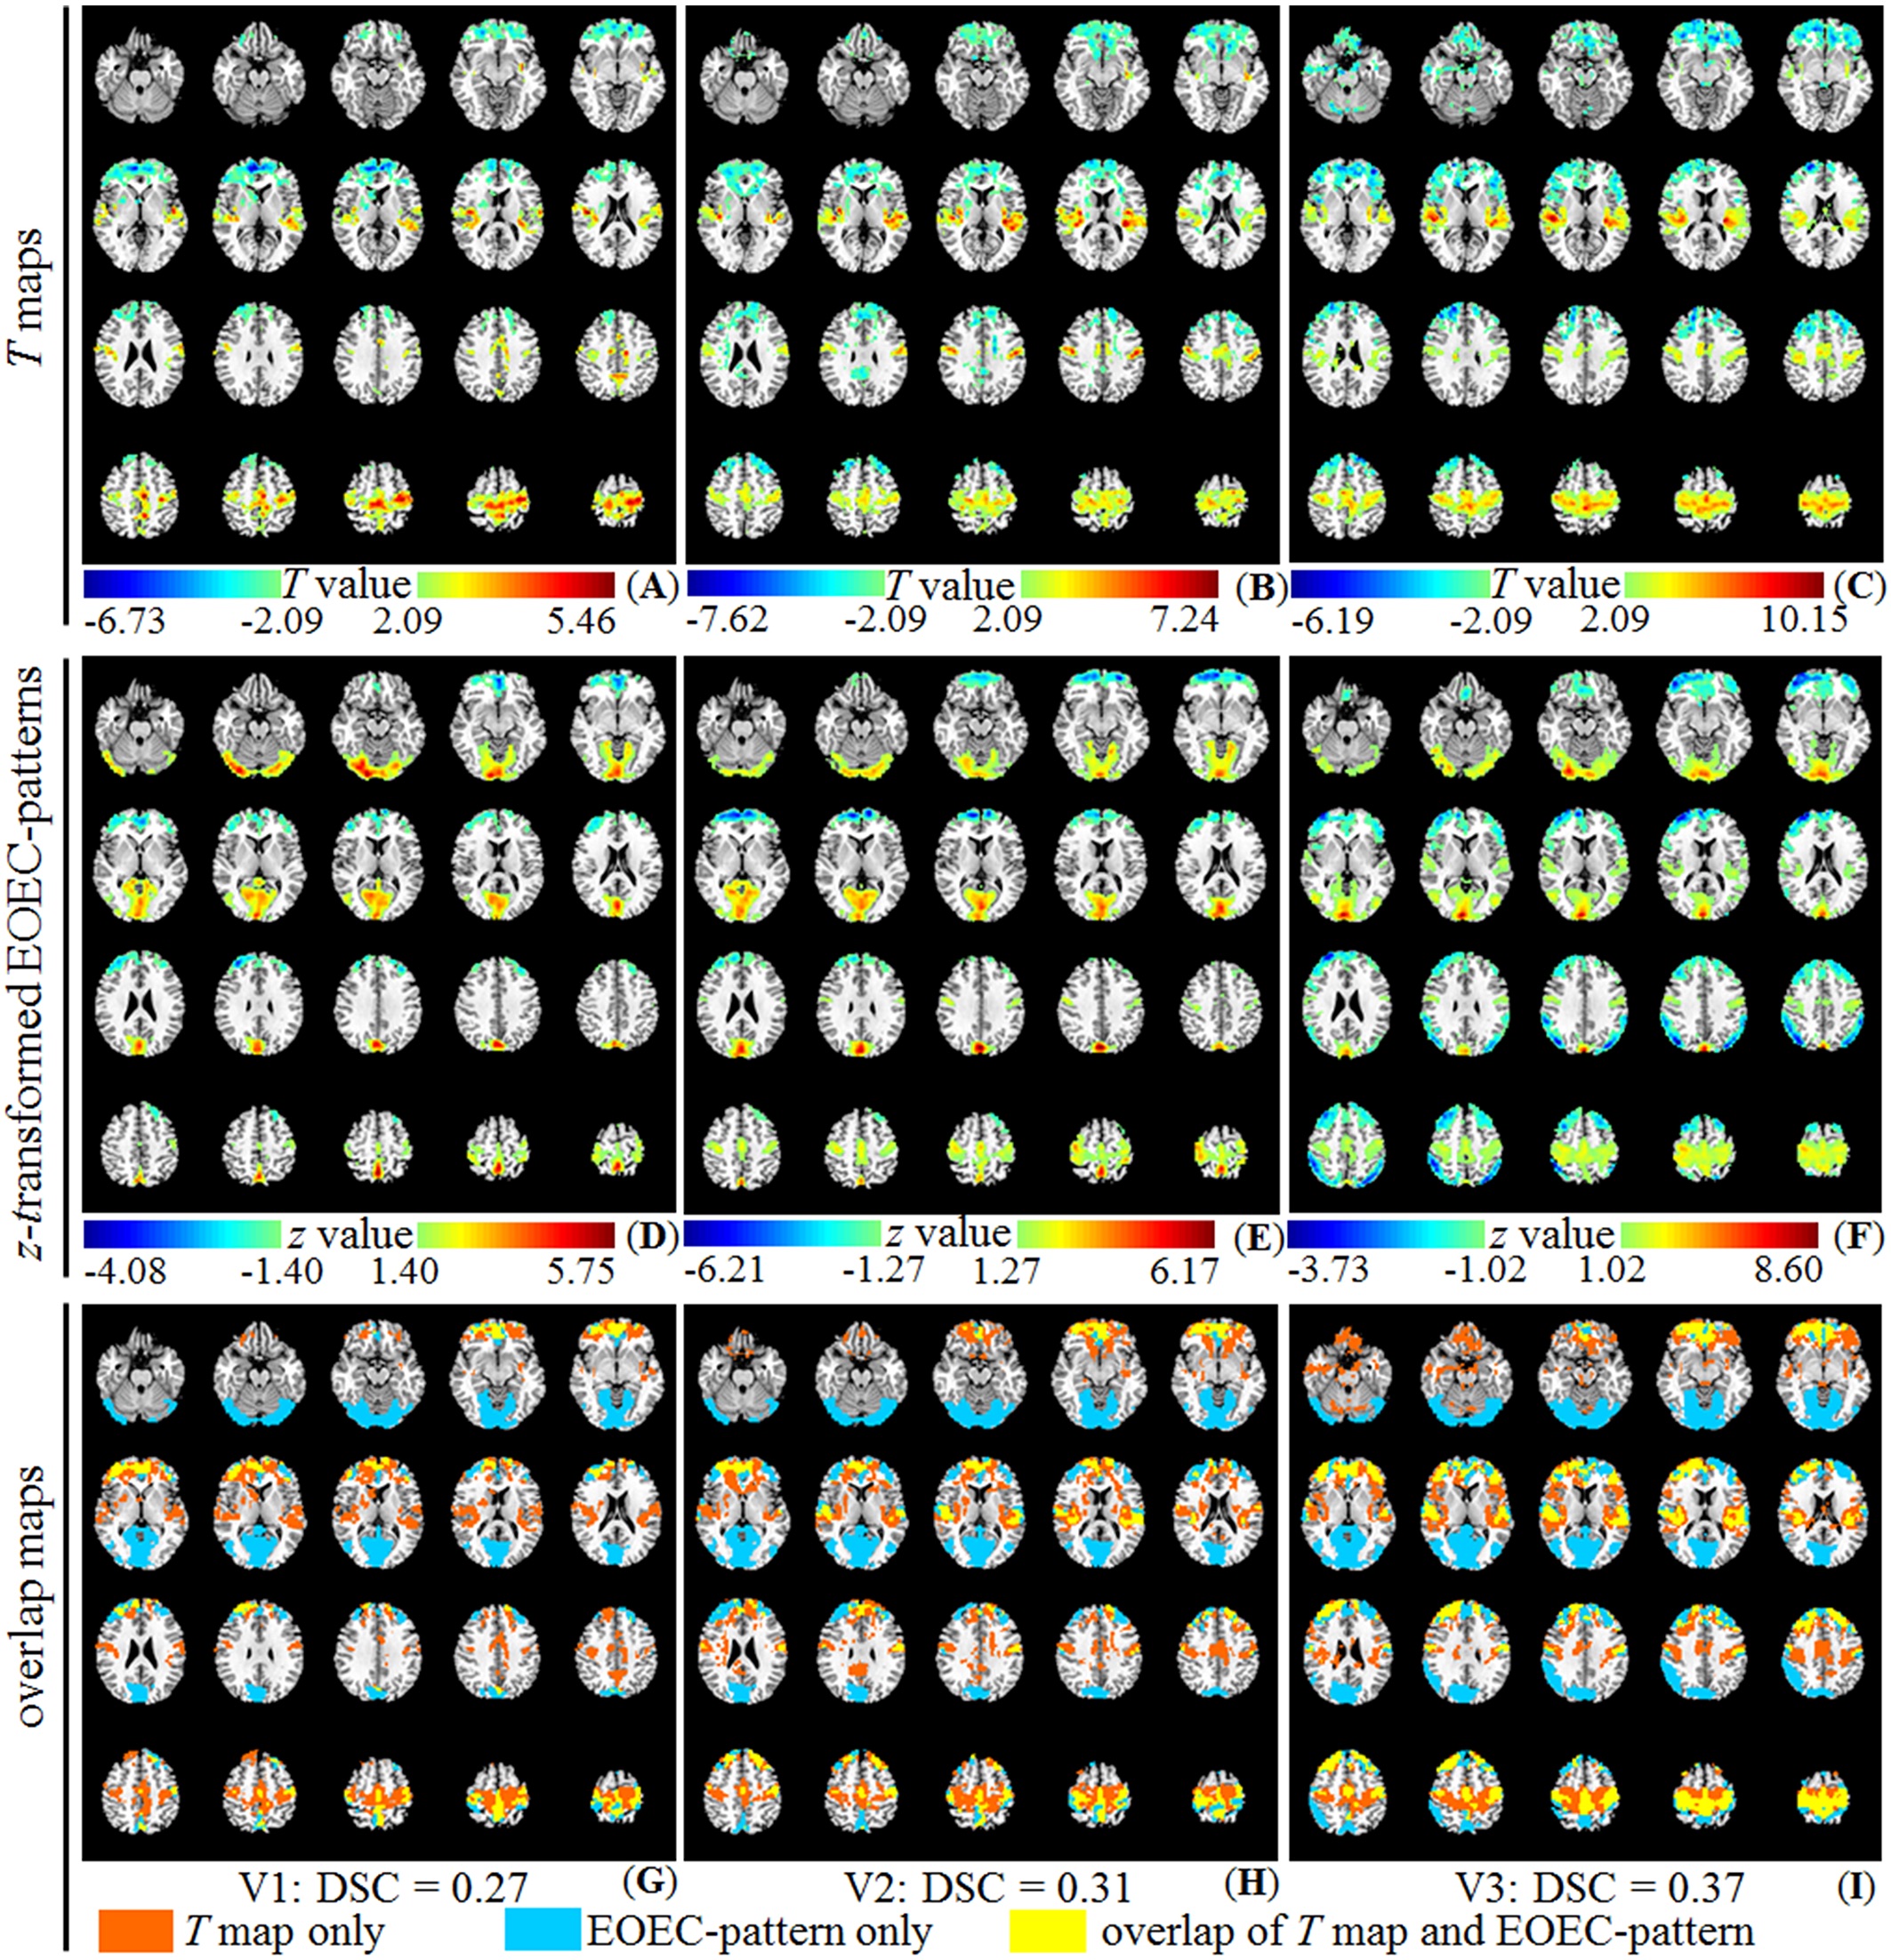
Only the expression of the first pattern showed significant differences between the EO-EC group and the EC-EO group for all the visits (p = 0.012, 0.0044, and 0.00062 for V1, V2, and V3, respectively). The first pattern, referred to as EOEC-pattern, mainly involved the sensorimotor cortex, superior temporal gyrus, frontal pole, and visual cortex. Among all covariance patterns, EOEC-pattern and its expression showed the highest reliability. The intra-scanner intra-class correlation (ICC) of the EOEC-pattern was 0.86 and the inter-scanner ICC was 0.83 (V1 vs. V3) and 0.81 (V2 vs. V3). For its corresponding expression, the intra-scanner ICC was 0.49, but the inter-scanner ICC was 0.65 (V1 vs. V3) and 0.66 (V2 vs. V3), respectively. Comparing the EOEC-pattern with the conventional two-sample T-test map, the DSCs for V1, V2, and V3 were 0.27, 0.31, and 0.37, respectively. The T-test detected larger brain regions in the primary sensorimotor area and superior temporal gyrus, while SSM-PCA detected exclusively large visual areas.Discussion
After centralization, the voxel-wise similarity between groups was reduced, while the difference between groups was highlighted. Thus, the first pattern was the EO and EC difference pattern, which is consistent with many previous PET studies5~7, where the first pattern was the disease-related pattern. The relatively low intra- and inter- scanner reliability of EOEC-pattern’s expression is due to the overall ALFF changes between visits probably caused by the state alteration of subjects and MRI scanners8. The difference in results from SSM-PCA and univariate T-test was attributed to the difference of these two statistical methods. SSM-PCA based on the covariance matrix of all the voxels from all the subjects, which is a kind of network analysis, whereas for univariate statistical method, such as voxel-wise T-test, comparison is made between the values of each single voxel from two groups or two conditions within one group.Conclusion
The moderate to high intra- and inter-scanner reliability of SSM-PCA provides the foundation for its further applications in RS-fMRI. Moreover, SSM-PCA and conventional T-test are complementary for neuroimaging studies.Acknowledgements
This work was supported by the National Key R&D Program of China (2017YFC0909200),
the National Natural
Science Foundation of China (81661148045, 81520108016, 81271652, 31471084,
81401473, and 91632109), the Fundamental Research Funds for the Central
Universities (2017QNA5016) of China.
References
- Moeller, J. R., Strother, S. C., Sidtis, J. J., & Rottenberg, D. a. (1987). Scaled subprofile model: a statistical approach to the analysis of functional patterns in positron emission tomographic data. Journal of Cerebral Blood Flow and Metabolism, 7(5), 649–658.
- Alexander, G. E., & Moeller, J. R. (1994). Application of the scaled subprofile model to functional imaging in neuropsychiatric disorders: A principle component approach to modeling brain function in disease. Human Brain Mapping, 2(1–2), 79–94.
- Ma, Y., Johnston, T. H., Peng, S., Zuo, C.,
Koprich, J. B., Fox, S. H., ... & Brotchie, J. M. (2015). Reproducibility
of a Parkinsonism‐related metabolic brain network in non‐human
primates: A descriptive pilot study with FDG PET. Movement Disorders, 30(9),
1283-1288.
- Wu, T., Ma, Y., Zheng, Z., Peng, S., Wu, X., Eidelberg, D., & Chan, P. (2015). Parkinson's disease-related spatial covariance pattern identified with resting-state functional MRI, Journal of Cerebral Blood Flow & Metabolism, 35(11), 1764-1770.
- Ma, Y., Tang, C., Spetsieris, P. G., Dhawan, V., & Eidelberg, D. (2007). Abnormal Metabolic Network Activity in Parkinson’s Disease: Test-Retest Reproducibility. Journal of Cerebral Blood Flow & Metabolism, 27(3), 597–605.
- Pagani, M., Giuliani, A., Öberg, J., Chincarini, A., Morbelli, S., Brugnolo, A., ... & Sambuceti, G. (2016). Predicting the transition from normal aging to Alzheimer's disease: A statistical mechanistic evaluation of FDG-PET data. NeuroImage, 141, 282-290.
- Tomše, P., Jensterle, L., Grmek, M., Zaletel, K., Pirtošek, Z., Dhawan, V., ... & Trošt, M. (2017). Abnormal metabolic brain network associated with Parkinson’s disease: replication on a new European sample. Neuroradiology, 59(5), 507-515.
-
Bennett, C. M., &
Miller, M. B. (2010). How reliable are the results from functional magnetic
resonance imaging? Annals of the New York Academy of Sciences.
Figures