5557
Resting-State Functional Connectivity of Subcortical Grey Matter Correlates with Fatigue in Young Adults with Multiple Sclerosis1Biomedical Engineering, Stony Brook University, Stony Brook, NY, United States, 2Multiple Sclerosis Comprehensive Care Center, NYU, New York, NY, United States, 3Radiology, Stony Brook University, Stony Brook, NY, United States
Synopsis
While striatal and thalamic networks have been linked with fatigue in MS, they haven’t been explored in any young adult MS population. Further probing is needed to fully understand the fatigue correlate in MS and how it compares with differences between healthy controls and MS patients. In this study, we compared resting state functional connectivity measures in healthy controls, fatigued, and non-fatigued MS patients. Our results demonstrate that fatigue correlates with deficits in subcortical connectivity with several resting state networks. We found overlap between certain MS-related and fatigue-related changes, providing further insight into MS pathology and its fatigue correlate.
Introduction
Fatigue is a common clinical symptom in MS. Resting-state fMRI functional connectivity (FC) changes in subcortical grey matter has been shown to correlate with MS-related fatigue. However, the neural correlate of fatigue-related networks is not fully understood in MS patients. Moreover, fatigue-related rsfMRI FC changes haven’t been explored in young adults with MS. The goal of this study was to investigate resting-state FC in young adults with MS and its correlation with clinical fatigue ratings in four subcortical regions – the Thalamus, Pallidum, Putamen and Caudate – which have previously been implicated in MS and fatigue disorders1.Methods
Three groups of participants were studied: young adult relapsing-remitting multiple sclerosis (RR-MS) patients with fatigue (F-MS, 3M/7F, 27.1±5.6yo with Fatigue Severity Scale (FSS) ratings ≥ 4), without fatigue (NF-MS, 6M/6F, 25.8±5.5yo), and age- and sex-matched healthy controls (HC, 10M/14F, 22.1±2.6yo). Resting-state BOLD fMRI (3.2x3.2x3.2mm, TR=2.38s, 370 time points) and T1-weighted MRI (1x1x1mm) were acquired.
Data analyses were carried out in MATLAB with CONN (www.nitrc.org/projects/conn) and SPM12 (www.fil.ion.ucl.ac.uk/spm) toolboxes. Preprocessing of fMRI data included within-subject realignment, temporal smoothing, outlier volume detection (peak-to-peak motion threshold=0.5mm, global signal z-value threshold=3), normalization to MNI space after coregistration with T1w image, spatial smoothing with a 5mm FWHM Gaussian kernel, nuisance and motion regression using aCompCor2 and motion scrubbing, and bandpass filtering between 0.01-0.1Hz. Simultaneous segmentation and normalization was also performed on T1 images. Whole-brain seed-to-voxel analysis was carried out using 8 seed regions: L/R Thalamus, L/R Pallidum, L/R Putamen, and L/R Caudate derived from the 90-parcellation AAL atlas3. All seeds were masked out with subject-specific grey matter to account for potential volumetric differences between RRMS and HC subjects4.
Statistical tests for differences in FC amongst the 3 groups were determined via the general linear model (GLM), utilizing t-tests for group differences and linear regression for correlation with FSS (3.60±0.86) in MS patients. Voxel-wise significance was set at a threshold of p<0.001 (uncorrected), while Family Wise Error correction was performed on cluster size statistics to correct for false discoveries with a threshold of p-FWE<0.05.
Results and Discussion
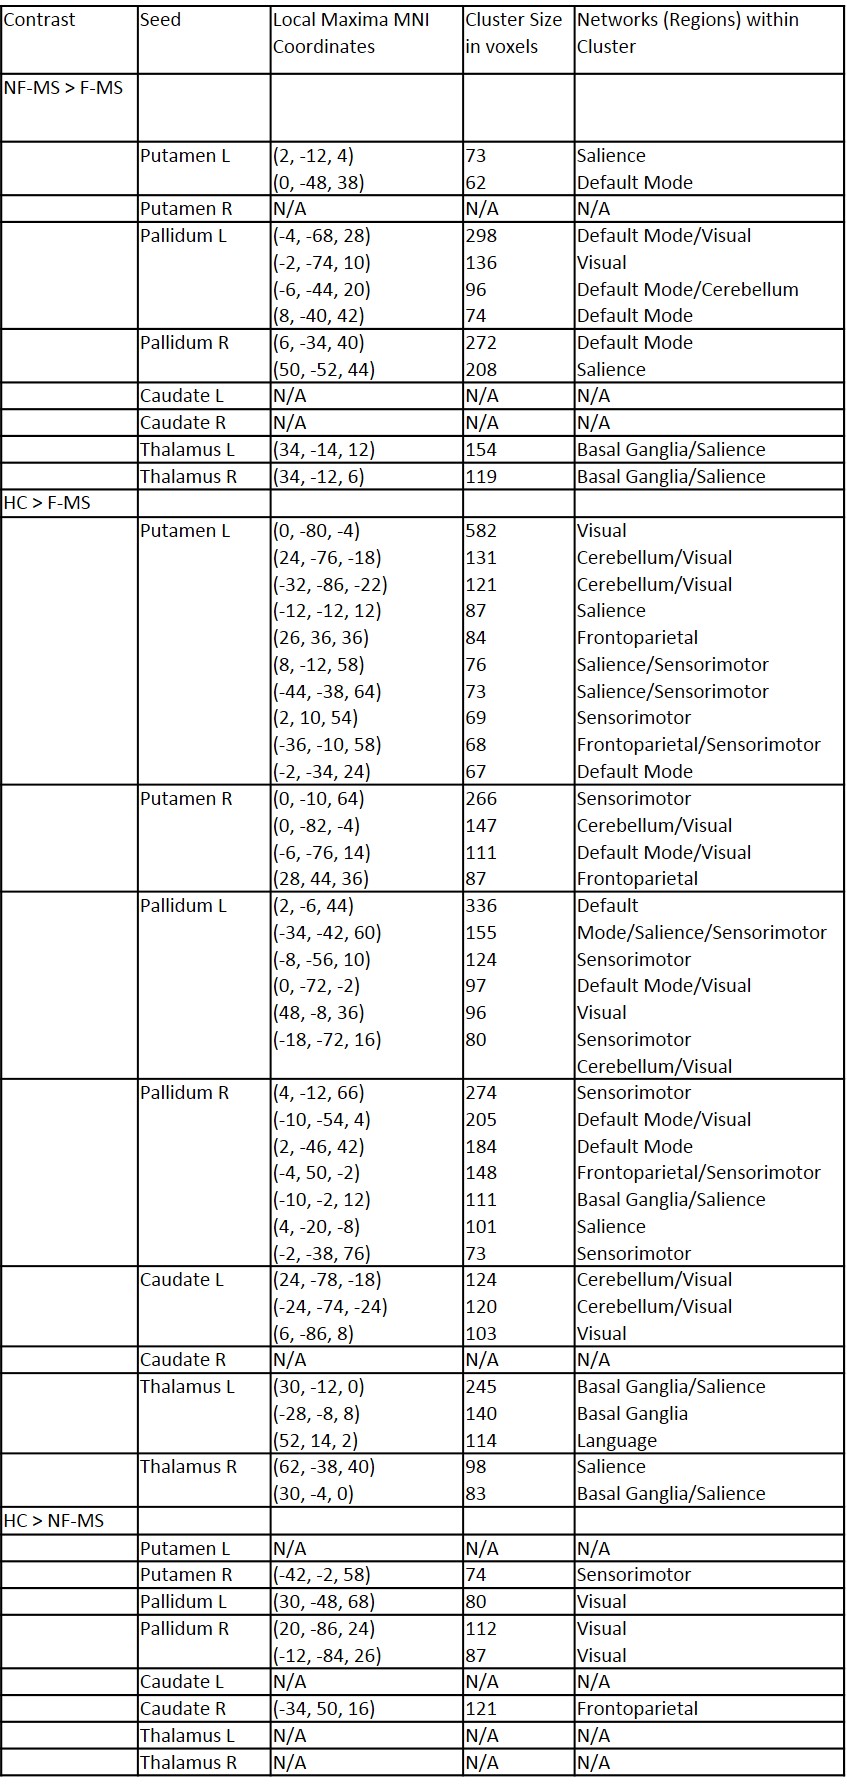
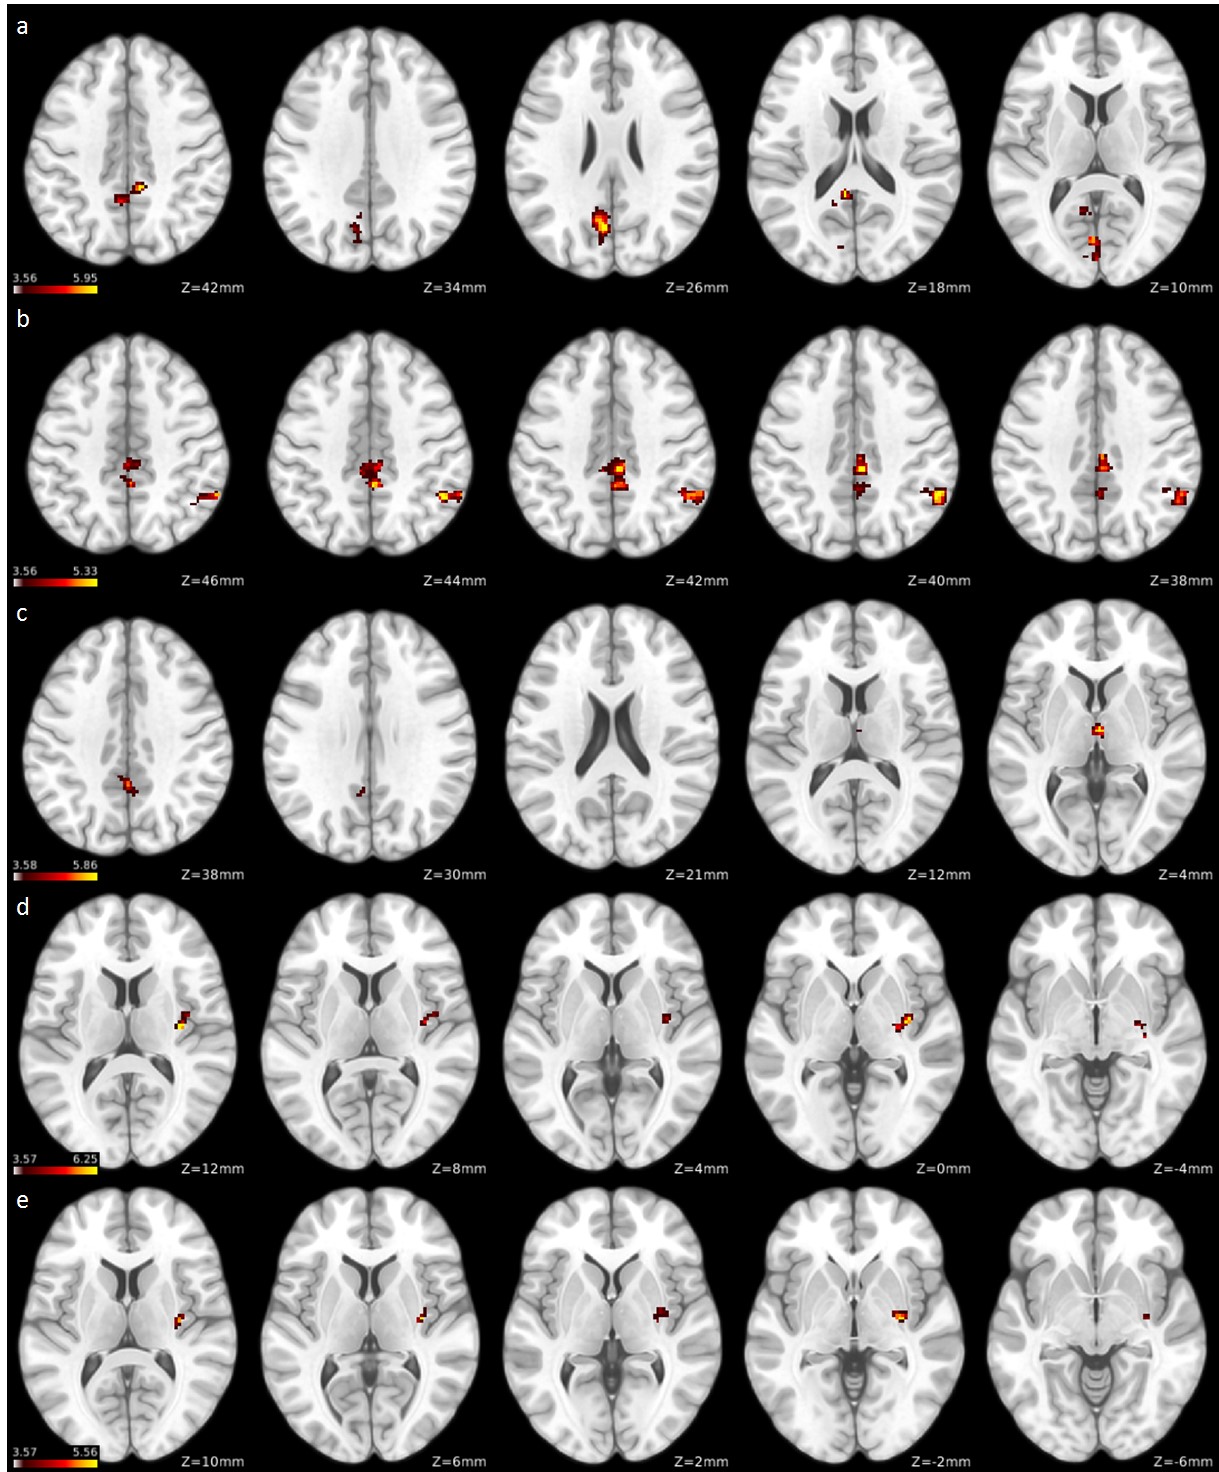
F-MS patients showed decreased subcortical FC when compared with NF-MS patients in regions associated with the visual network, cerebellum, basal ganglia network, default mode network, sensorimotor network and salience network (Figure 1, Table 1).
Similarly, compared with HCs, F-MS patients showed widespread decreased FC between subcortical grey matter and various grey matter regions, particularly in clusters associated with the visual network, cerebellum, basal ganglia network, default mode network, frontoparietal network, language network, sensorimotor network and salience network (Table 1).
Compared with HCs, NF-MS patients displayed decreased basal ganglia FC with frontoparietal network, visual network and sensorimotor network regions (Table 1). None of the specified contrasts displayed statistically significant increased functional connectivity between groups.
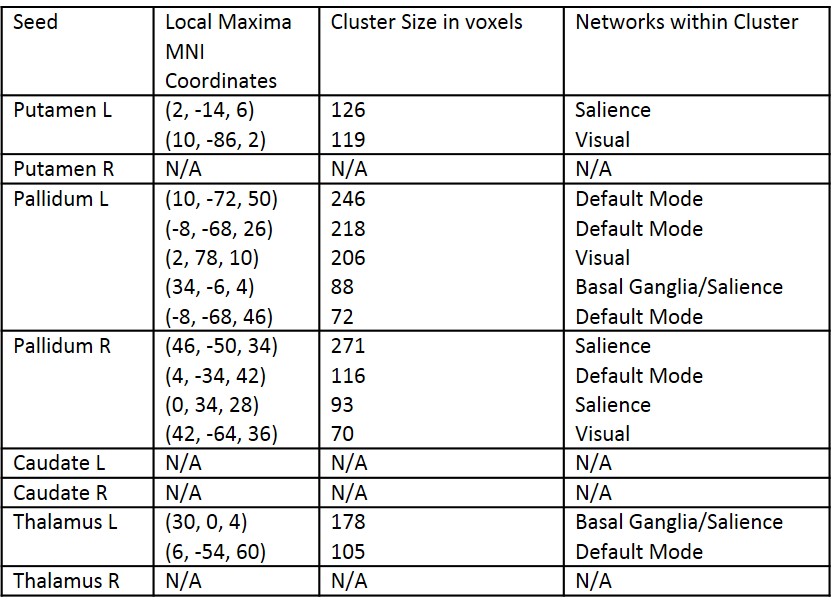
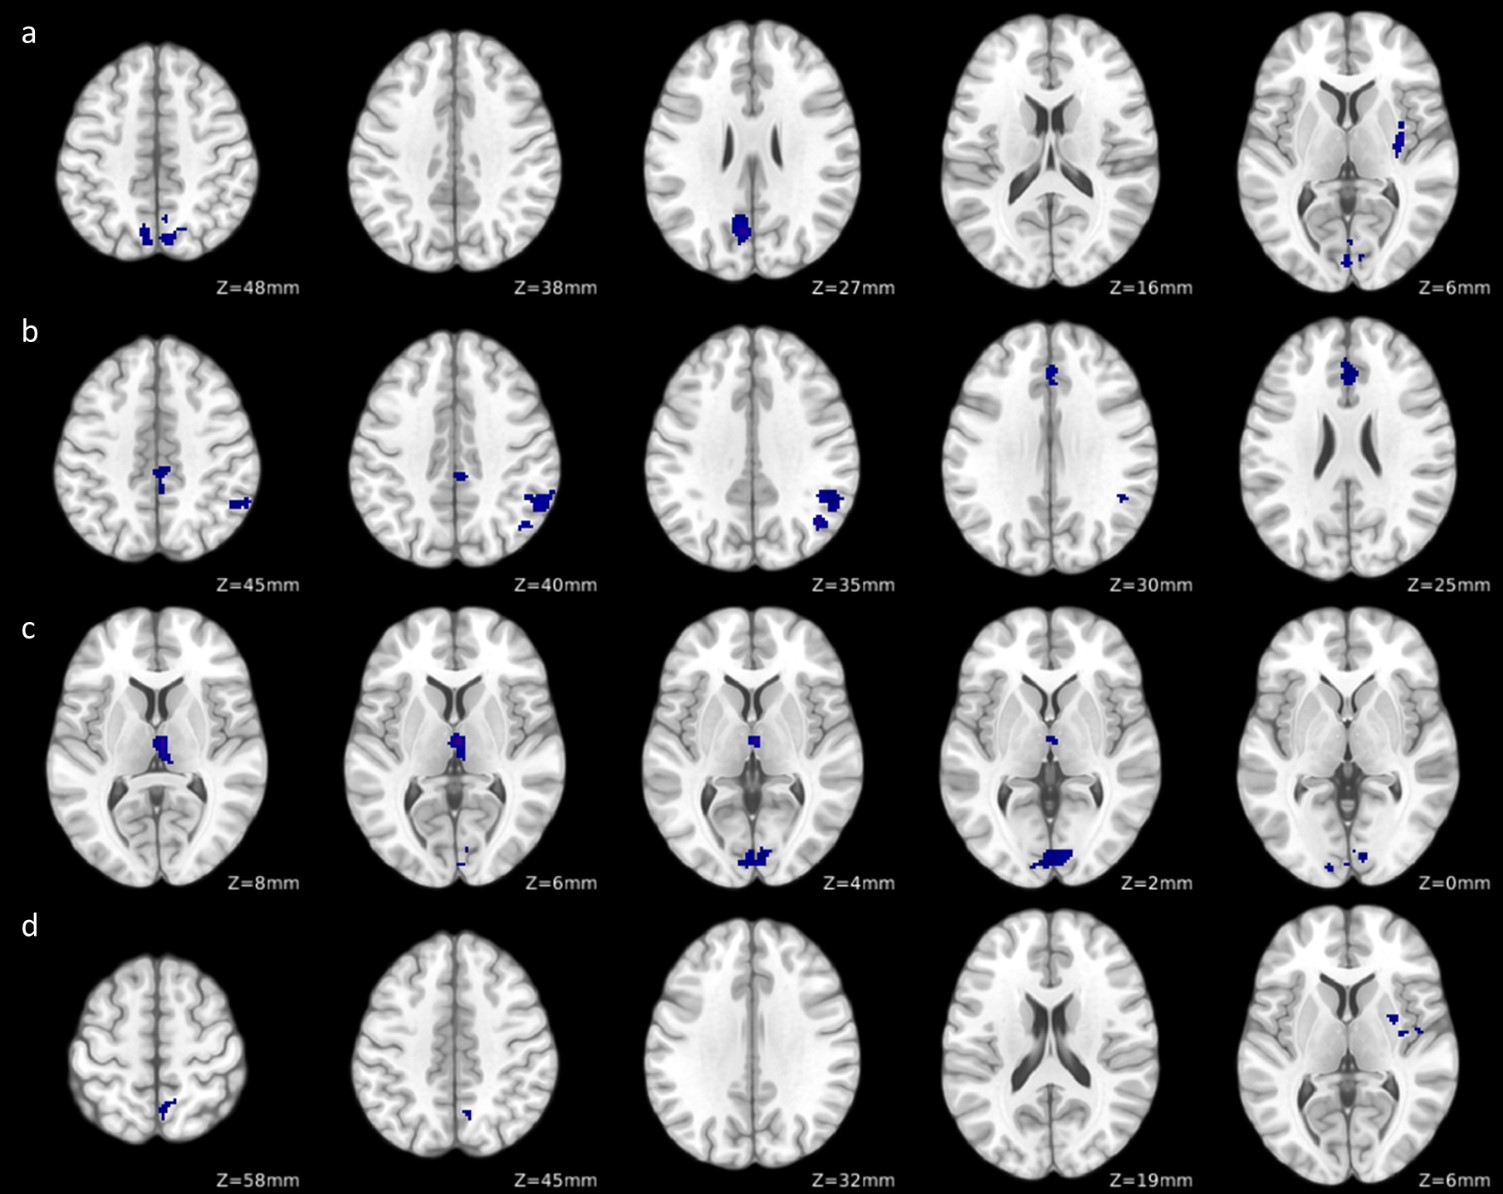
FSS scores were significantly correlated with negative FC changes in MS patients between subcortical grey matter regions and regions in the salience network, visual network, basal ganglia network and default mode network (Figure 2, Table 2).
Common differences between HCs and all MS patients are decreases in patients in basal ganglia FC with clusters in frontoparietal, sensorimotor and visual regions. Conversely, when comparing F-MS to HCs and NF-MS subjects, the thalamus shows decreased FC with basal ganglia and salience regions, both of which networks are functionally connected to the thalamus at resting state5. In addition, basal ganglia regions show more drastic reduction in FC in F-MS vs. HCs and NF-MS subjects in visual and sensorimotor regions, while also demonstrating decreased connectivity in default mode, basal ganglia, salience and cerebellar regions. This effectively shows that visual and sensorimotor connectivity changes with the basal ganglia aren’t solely associated with the MS phenotype, as they’re also shown to be further decreased in F-MS vs. NF-MS patients.
Based on the group and linear regression analyses, the FC correlate with MS-related fatigue appears to exist primarily in the pallidum, putamen, thalamus, default mode network and salience network. In addition, FC changes in the thalamus are shown to be unique to the fatigue effect in MS, which is consistent with recent findings of a large MS study6.
Conclusion
This study demonstrates subcortical FC changes are correlated with fatigue in a unique MS population. Our analysis shows consistent widespread deficits in FC between resting state networks and the basal ganglia and thalamus in MS patients. In addition, our analysis distinguishes MS-related FC changes with fatigue-related changes, while also revealing commonalities in both. Our findings are consistent with other studies on older MS populations.Acknowledgements
No acknowledgement found.References
1. Engström, M., Flensner, G., Landtblom, A., Ek, A., & Karlsson, T. (2013). Thalamo-striato-cortical determinants to fatigue in multiple sclerosis. Brain and Behavior, 3(6), 715-728. doi:10.1002/brb3.181
2. Behzadi Y, Restom K, Liau J, Liu TT. A Component Based Noise Correction Method (CompCor) for BOLD and Perfusion Based fMRI. NeuroImage. 2007;37(1):90-101. doi:10.1016/j.neuroimage.2007.04.042.
3. Tzourio-Mazoyer N., Landeau B., Papathanassiou D., Crivello F., Etard O., Delcroix N., Mazoyer B., Joliot M.. Automated Anatomical Labeling of Activations in SPM Using a Macroscopic Anatomical Parcellation of the MNI MRI Single-Subject Brain. NeuroImage. 2002:15(1):273-289. https://doi.org/10.1006/nimg.2001.0978.
4. Tiberio M.,Chard D. T., Altmann D. R., Davies G., Griffin C. M., Rashid W., Sastre-Garriga J., Thompson A. J., and Miller D. H. Gray and white matter volume changes in early RRMS: A 2-year longitudinal study. Neurology. 2005,:64(6):1001-1007. doi:10.1212/01.WNL.0000154526.22878.30: 1526-632X
5. Tang L, Ge Y, Sodickson DK, et al. Thalamic Resting-State Functional Networks: Disruption in Patients with Mild Traumatic Brain Injury. Radiology. 2011;260(3):831-840. doi:10.1148/radiol.11110014.
6. Hidalgo de la Cruz M, et al. Abnormal functional connectivity of thalamic sub-regions contributes to fatigue in multiple sclerosis. Multiple Sclerosis. 2017:[Epub ahead of print] doi: 10.1177/1352458517717807.
Figures