5555
Resting-State Functional Connectivity of the Language Network in Multiple Sclerosis in Young Adults1Biomedical Engineering, Stony Brook University, Stony Brook, NY, United States, 2Multiple Sclerosis Comprehensive Care Center, NYU, New York, NY, United States, 3Radiology, Stony Brook University, Stony Brook, NY, United States
Synopsis
Multiple Sclerosis is affiliated with many clinical symptoms, including language deficiencies. However, the neural mechanism behind these problems hasn’t yet been explored. In this study, we use resting-state fMRI to probe the known language network in MS patients. We found that functional connectivity of the language network in MS patients is significantly correlated with clinical disability and results of a verbal learning test. Based on our results, we believe resting-state fMRI may be a viable tool to monitor language deficiencies in MS patients along with clinical scores.
Introduction
Multiple sclerosis (MS) patients often exhibit language difficulties, including communication, speech, vocabulary and fluency deficiencies. Resting-state fMRI has shown to be a useful tool in probing functional connectivity of neural networks, which can be used to study patients with neurological and psychiatric disorders. Although many MS patients exhibit language-related difficulties, the neural correlates of language network dysfunction remain unexplored.
In this study, we used resting-state fMRI to investigate the language network in MS patients. Specifically, we evaluated functional connectivity of the well-established language network: Broca’s Area (Brodmann Areas 44 and 45) and Wernicke’s Area (Brodmann Area 22). Changes in functional connectivity were correlated with disability scores and verbal learning test scores. This study was performed on young adult MS patients, a relatively understudied population.
Methods
Young adult relapsing-remitting multiple sclerosis (RR-MS) patients (9M/13F, 26.4±5.5yo) were studied. Resting-state BOLD fMRI (3.2x3.2x3.2mm, TR=2.38s, 370 time points) and T1-weighted MRI (1mmx1mmx1mm) were acquired.
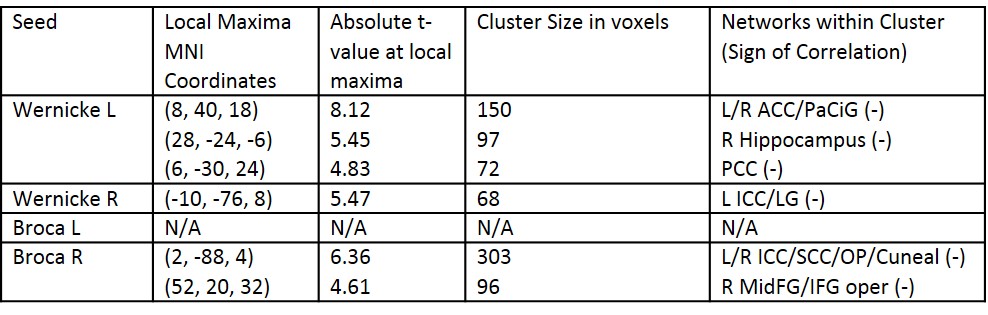
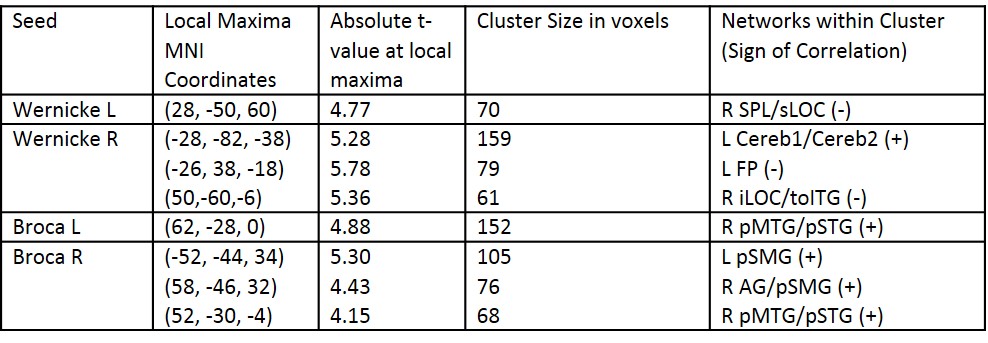
Data analyses were carried out in MATLAB with CONN (www.nitrc.org/projects/conn) and SPM12 (www.fil.ion.ucl.ac.uk/spm) toolboxes. Preprocessing of fMRI data included within-subject realignment, temporal smoothing, outlier volume detection (peak-to-peak motion threshold=0.5mm, global signal z-value threshold=3), normalization to MNI space after coregistration with T1w image, spatial smoothing with a 5mm FWHM Gaussian kernel, nuisance and motion regression using aCompCor1 and motion scrubbing, and bandpass filtering between 0.01-0.1Hz. Simultaneous segmentation and normalization was also performed on T1 images. Whole-brain seed-to-voxel analysis was carried out using 4 seed regions: L/R Wernicke’s Area (Brodmann Area 22) and L/R Broca’s Area (combination of Brodmann Areas 44 and 45). All seeds were masked out with subject-specific grey matter to account for potential volumetric differences between RRMS subjects2.
Statistical tests for differences in functional connectivity were carried out via the general linear model (GLM), utilizing linear regression to correlate whole-brain functional connectivity of language network regions with Expanded Disability Status Scale (EDSS, 1.85±1.72) and Rey Auditory Verbal Learning Test (RAVLT, 54.13±10.33) measures in MS patients. Voxel-wise significance was set at a threshold of p<0.001 (uncorrected), while Family Wise Error correction was performed on cluster size statistics to correct for false discoveries with a threshold of p-FWE<0.05.
Results
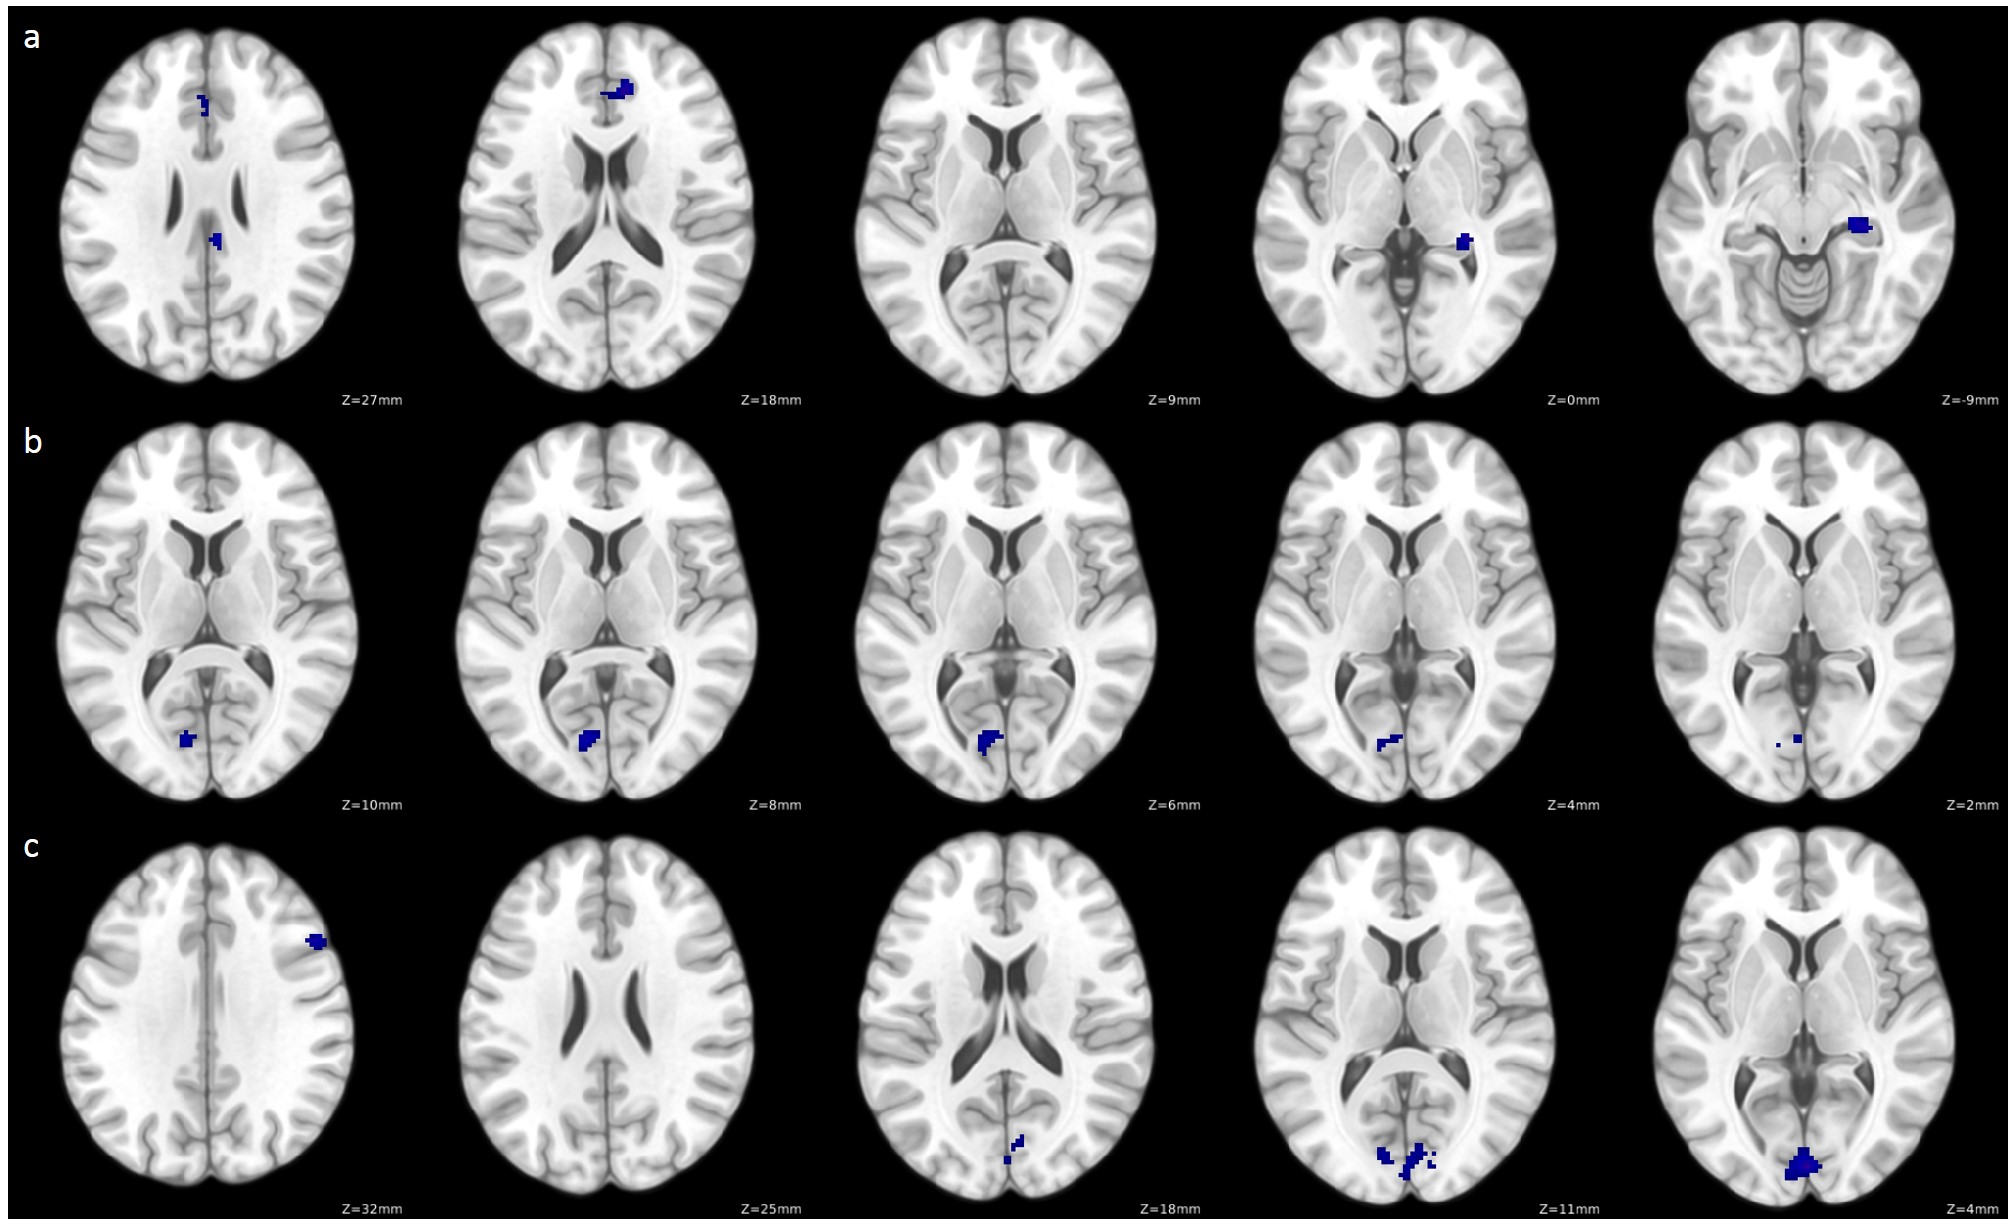
EDSS scores were significantly negatively correlated with FC between language network regions and regions associated with the default mode network, salience network, visual network, language network and hippocampus (Figure 1, Table 1).
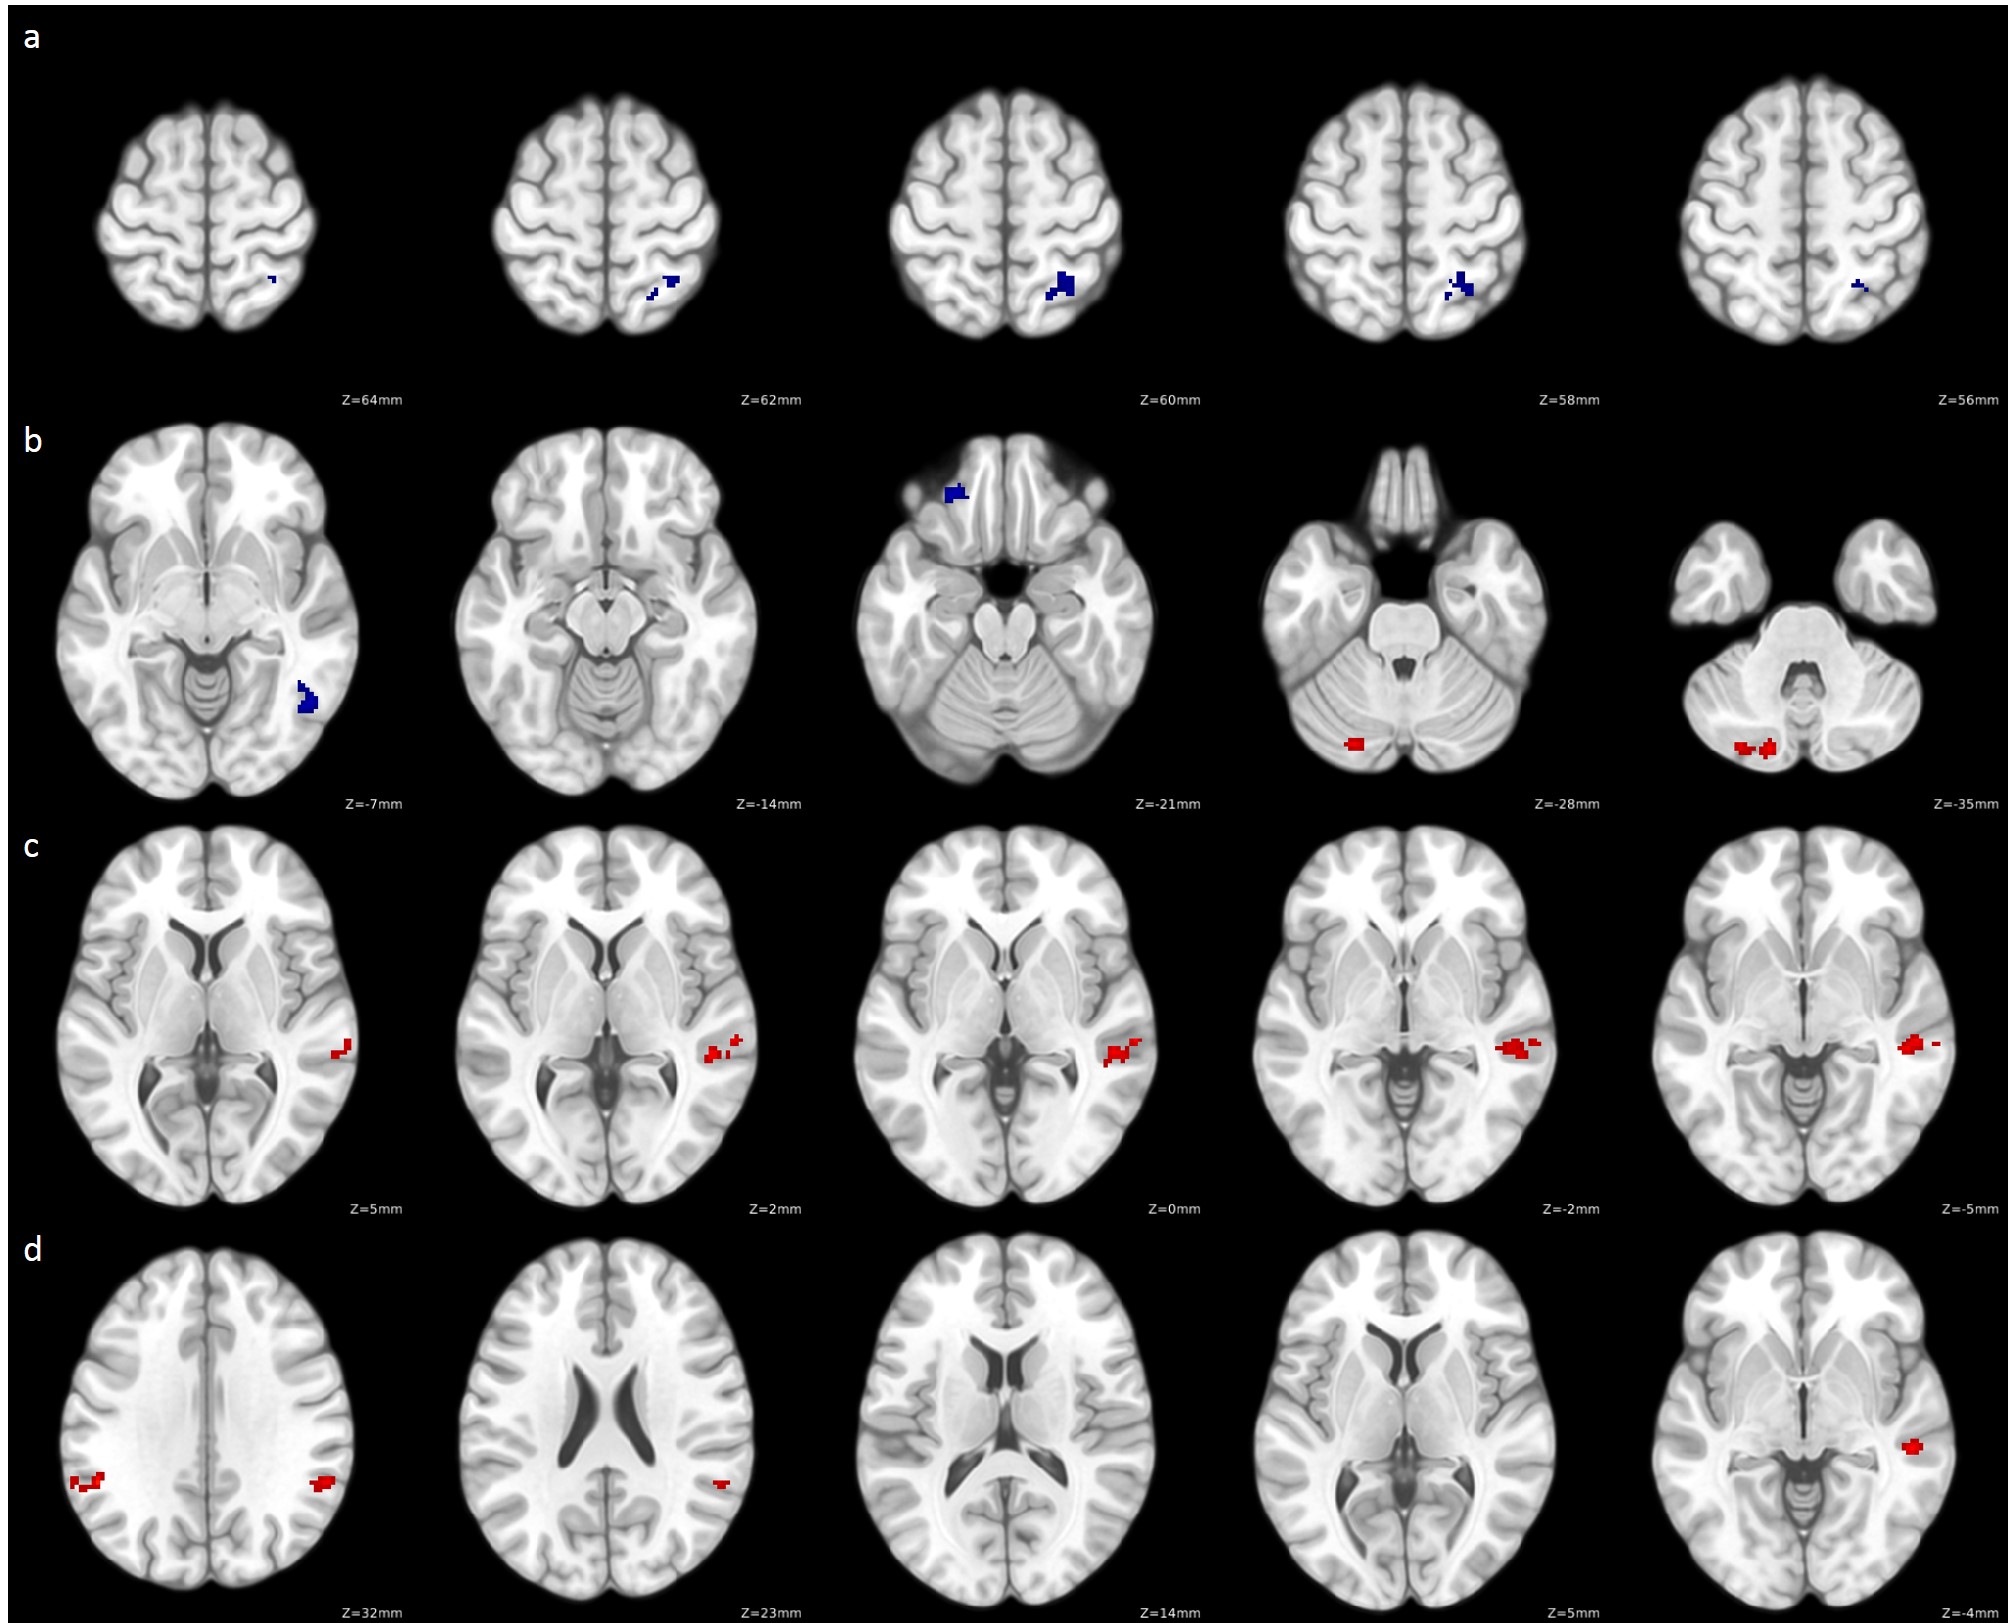
RAVLT scores were significantly negatively correlated with FC between language network regions and regions associated with the sensorimotor network, visual network, frontoparietal network, and language network (Figure 2, Table 2). In addition, RAVLT scores were significantly positively correlated with FC between language network regions and regions associated with the cerebellum, language network and salience network (Figure 2, Table 2).
Discussion
Our results demonstrate that language network FC is affected in MS patients and significantly correlated with self-reported clinical disability and performance on a verbal learning test. EDSS was correlated with widespread decreases in language network FC with a variety of resting-state networks, suggesting disability is directly associated with language difficulties. Since EDSS is a self-reported score commonly taken by MS physicians, it provides a useful correlate for language difficulties. However, an objective language-based performance measure could provide a more representative neural correlate of such functional changes.
Correlation analyses with RAVLT reveal an interesting pattern of both increases and decreases in language network FC with different networks. RAVLT performance is primarily correlated with lower FC between Wernicke’s Area and clusters in the lateral occipital cortex, frontal pole, inferior temporal gyrus and superior parietal lobule, as well as higher FC between Broca’s Area and clusters localized in the temporal gyrus, supramarginal gyrus, angular gyrus and cerebellum. This suggests there may be modularity in resting state FC patterns associated with language deficiencies in MS characterized by increased FC in the frontal language network (Broca’s Area) and decreased FC in the posterior language network (Wernicke’s Area). Further analysis is warranted to fully understand the resting-state modulation patterns of the language network as they relate to language dysfunction in MS patients.
Conclusion
This is the first study to explore language network FC changes in young adult MS patients. We demonstrate that FC changes in this network are significantly correlated with clinical disability and verbal learning test performance. This study provides a foundation for further probing of the language network in MS patients.Acknowledgements
No acknowledgement found.References
1. Behzadi Y, Restom K, Liau J, Liu TT. A Component Based Noise Correction Method (CompCor) for BOLD and Perfusion Based fMRI. NeuroImage. 2007;37(1):90-101. doi:10.1016/j.neuroimage.2007.04.042.
2. M. Tiberio, D. T. Chard, D. R. Altmann, G. Davies, C. M. Griffin, W. Rashid, J. Sastre-Garriga, A. J. Thompson, and D. H. Miller. Gray and white matter volume changes in early RRMS: A 2-year longitudinal study. Neurology. 2005,:64(6):1001-1007. doi:10.1212/01.WNL.0000154526.22878.30: 1526-632X
Figures