5552
Clustering-based identification of Regions-of-Interest in Functional Magnetic Resonance Images1Biomedical Engineering Department, Universidad de Valparaiso, Valparaiso, Chile, 2Advanced Center for Electrical and Electronic Engineering, Valparaíso, Chile
Synopsis
The first step of brain network analysis in fMRI is to detect regions of interest. The signals from these ROIs are then used to evaluate neural networks and quantify neuronal dynamics The two main methods to identify ROIs are based on brain atlas registration and clustering. In this work, both paradigms are combined by using a hierarchical two-level approach. In the first level, the anatomical parcellation is applied and then a clustering-based strategy within anatomical labels is performed. The proposed method is compared with a current approach based on spectral clustering.
Introduction
The first step of brain network analysis in fMRI data is to detect regions of interest (ROIs) within which fMRI signals have similar behaviors. The signals from these ROIs are then used to evaluate neural networks and quantify neuronal dynamics. Bayesian networks, Markov models, etc., are commonly used to estimate the relationships among voxels from different ROIs. A challenge in connectivity analysis is then to determine in a robust manner the regions of interest to be further analyzed.
The two main methods to identify ROIs are based on brain atlas registration and clustering. The former method, typically used in fMRI studies1, finds ROIs by registration of a brain atlas, such as AAL, Talairach, BSA, etc., and the subject’s images. The main disadvantage of this approach is that the number of ROIs is forced to match the anatomical atlas labels, regardless of the fact that ROI signals are truly involved in the connectivity network under study. Besides the specific location of neuronal groups contributing to a given task or brain state may vary among subjects and may not encompass the entire brain atlas label.
Being atlas-free, clustering-based methods overcome these disadvantages, offering an alternative to obtain groups of voxels presenting similar dynamic behavior that are involved in a connectivity network. Typically, the number of groups is a user-defined parameter. The main disadvantage of this paradigm is that the interpretation of analyses becomes difficult, as groups of voxels obtained have not a direct anatomical meaning. In addition, from a technical point of view, the huge amount and high dimensionality of fMRI signals on a regular brain volume makes this clustering problem difficult to be solved in an accurate and efficient manner.
It must be noted that the advantages of both approaches are complementary. Thus, with the purpose of overcoming the above-mentioned difficulties, we combined both the registration and clustering-based strategies.
Methods
A two-level hierarchical clustering is proposed. In the first level, an initial parcellation is made using Talairach atlas and, on each resulting label, a hierarchical clustering is applied based on a density-based clustering HDBSCAN of Campello et al.2. This approach also makes a hierarchical estimation of the clusters densities representing clusters in a tree-type structure. The resulting groups of signals are obtained by defining the most prominent clusters as a flat, non-overlapping partition. This results in signals that belong to the most prominent clusters and in signals that do not belong to any cluster, i.e. those signals do not form part of any ROI. The selection of the prominent clusters is made by maximizing the stability value associated to the clusters, therefore the number of clusters is determined automatically.
The proposed method was evaluated on fMRI data of 218 subjects acquired with the purpose of studying the spatial organization of the human voice areas3. This data was obtained from the OpenfMRI database. Its accession number is ds000158. Each data were processed using SPM124. Principal Component Analysis was performed before the application of the clustering proposed method.
The spectral clustering method proposed by Craddock et al.5 was also applied to data for comparison purposes. This approach is based on the well-known spectral clustering method that requires the definition of the number of clusters. In order to have a faithful comparison, the number of clusters estimated by the proposed method was used as the number of clusters in Craddock’s approach. The quality of the clustering obtained with both methods was quantified by using the taking the Silhouette index on the resulting clusters. The higher the Silhouette index values are, the higher the similarity among signals within ROIs, which is better in terms of the quality of the clustering.
Results and discussion
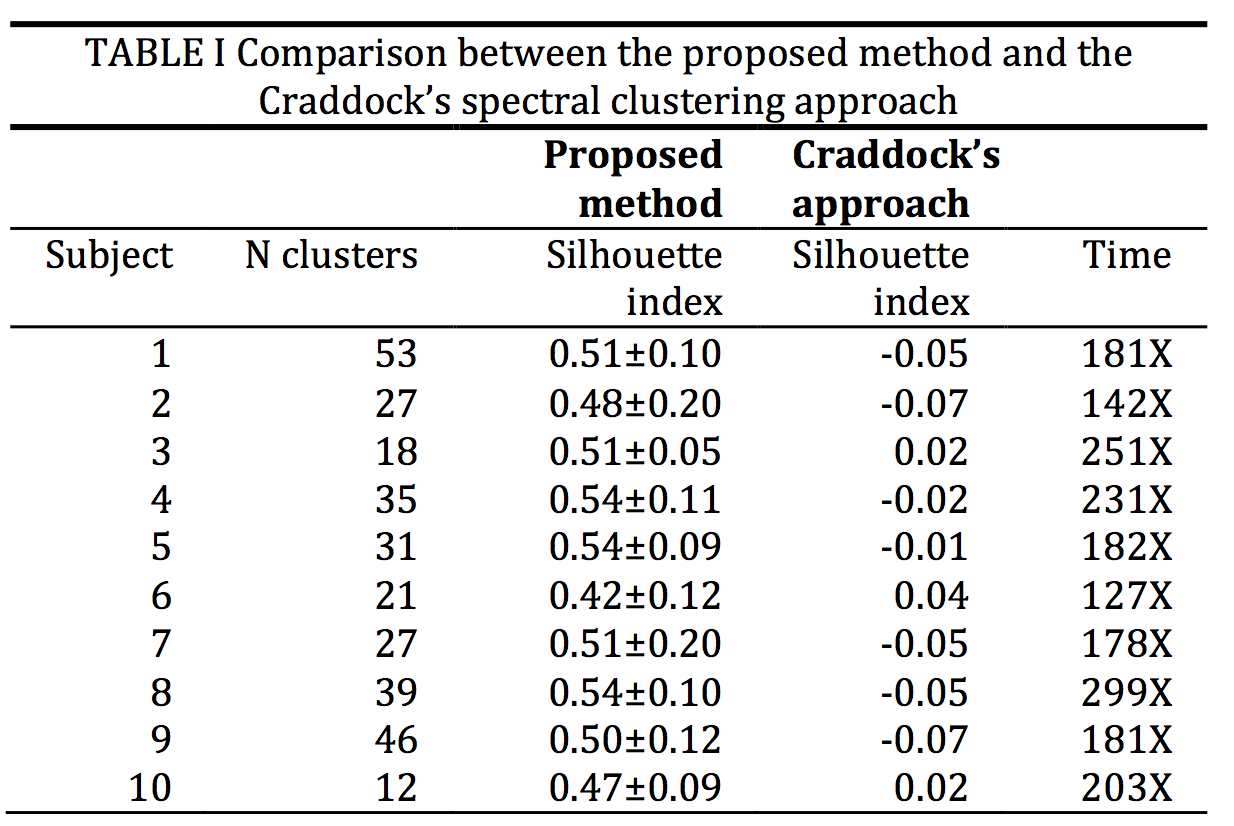
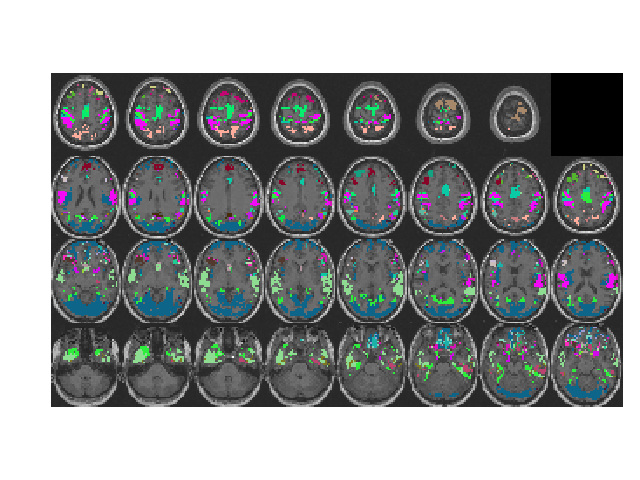
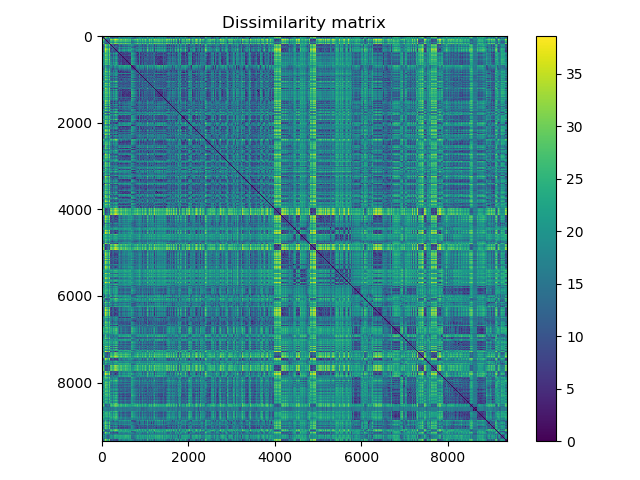
Table 1 presents the silhouette index obtained for 10 subjects. The number of clusters estimated on each case is also presented. It must be noted that the Silhouette index is much better in all the subjects shown. The Silhouette indices reported for the proposed method correspond to the mean and standard deviation of the Silhouette indices computed on each anatomical label. For the Craddock’s approach, the Silhouette index obtained is reported over the entire set of clusters. The additional time ratio needed by the Craddock’s approach is also reported. Fig. 2 and Fig. 3 presents the ROIs obtained and the dissimilarity matrix of the signals belonging to different clusters.
The results obtained show that our method identifies ROIs, as it founds signal groups within clusters more homogeneous than the ones obtained with existing approaches. Future work is needed in order to introduce spatial constraints to improve ROIs definition and to study the impact of the selection of ROIs in network estimation.
Acknowledgements
This work was supported by the
Advanced Centerfor Electrical and Electronic Engineering, AC3E,
Basal Project FB0008, CONICYT,
Project FONDEF-CONICYT ID16I10322
CONICYT - PIA - Anillo ACT1416
PMI UVA 1402
References
- Thomas Yeo. Automatic Labeling of the Human Cerebral Cortex. In: A. Toga, et al. Brain Mapping. Elsevier. 2015.
- Campello et al. Density-Based Clustering Based on Hierarchical Density Estimates. In: J. Pei et al. Advances in Knowledge Discovery and Data Mining, LNCS 7819, Springer. 2013.
- Pernet et al. The human voice areas: Spatial organization and inter-individual variability in temporal and extra-temporal cortices. Neuroimage. 2015;119:164-74.
- http://www.fil.ion.ucl.ac.uk/spm/
- Craddock et al. A Whole Brain fMRI Atlas Generated via Spatially Constrained Spectral Clustering. Human Brain Mapping. 2012; 33:1914-1928.
Figures