5550
Evaluation of fuzzy clustering for the identification of separate and joint dynamic functional connectivity patterns in resting-state fMRI1IDMEC, Instituto Superior Técnico, Universidade de Lisboa, Lisboa, Portugal, 2ISR-Lisboa/LARSyS and Department of Bioengineering, Instituto Superior Técnico, Universidade de Lisboa, Lisboa, Portugal
Synopsis
We propose to investigate the validity and applicability of fuzzy clustering (FCM) for the identification of dynamic functional connectivity (dFC) patterns in resting-state fMRI data, and comparing it with two approaches that have been used in this context (PCA and K-means). For such purpose, all methods were applied to data simulating either the joint or separate expression of dFC patterns, and to empirical data, collected from epilepsy patients. Both clustering methods, particularly FCM, outperformed PCA. Concomitantly, results from empirical data indicated that the occurrence of epileptic activity of patients was separately expressed by the dFC patterns.
Introduction
Several reports focused on the dynamic functional connectivity (dFC) of resting-state BOLD-fMRI have identified a limited number of reproducible dFC patterns1. However, the best methodology to be used, and whether dFC patterns are expressed separately or jointly over time in different conditions such as rest, task execution or epileptic activity, remain open questions2,3. Unsupervised pattern recognition techniques using k-means4 and principal component analysis (PCA)5 have been investigated in this context, with k-means clustering generally outperforming PCA3. In contrast to hard clustering approaches such as k-means, fuzzy clustering returns a soft assignment of clusters with a given membership degree6. Here, we aim to investigate the validity and applicability of fuzzy clustering for dFC pattern identification and compare this with k-means and PCA, in simulated data of both separate and joint dFC expression, as well as empirical data from epilepsy patients.Methods
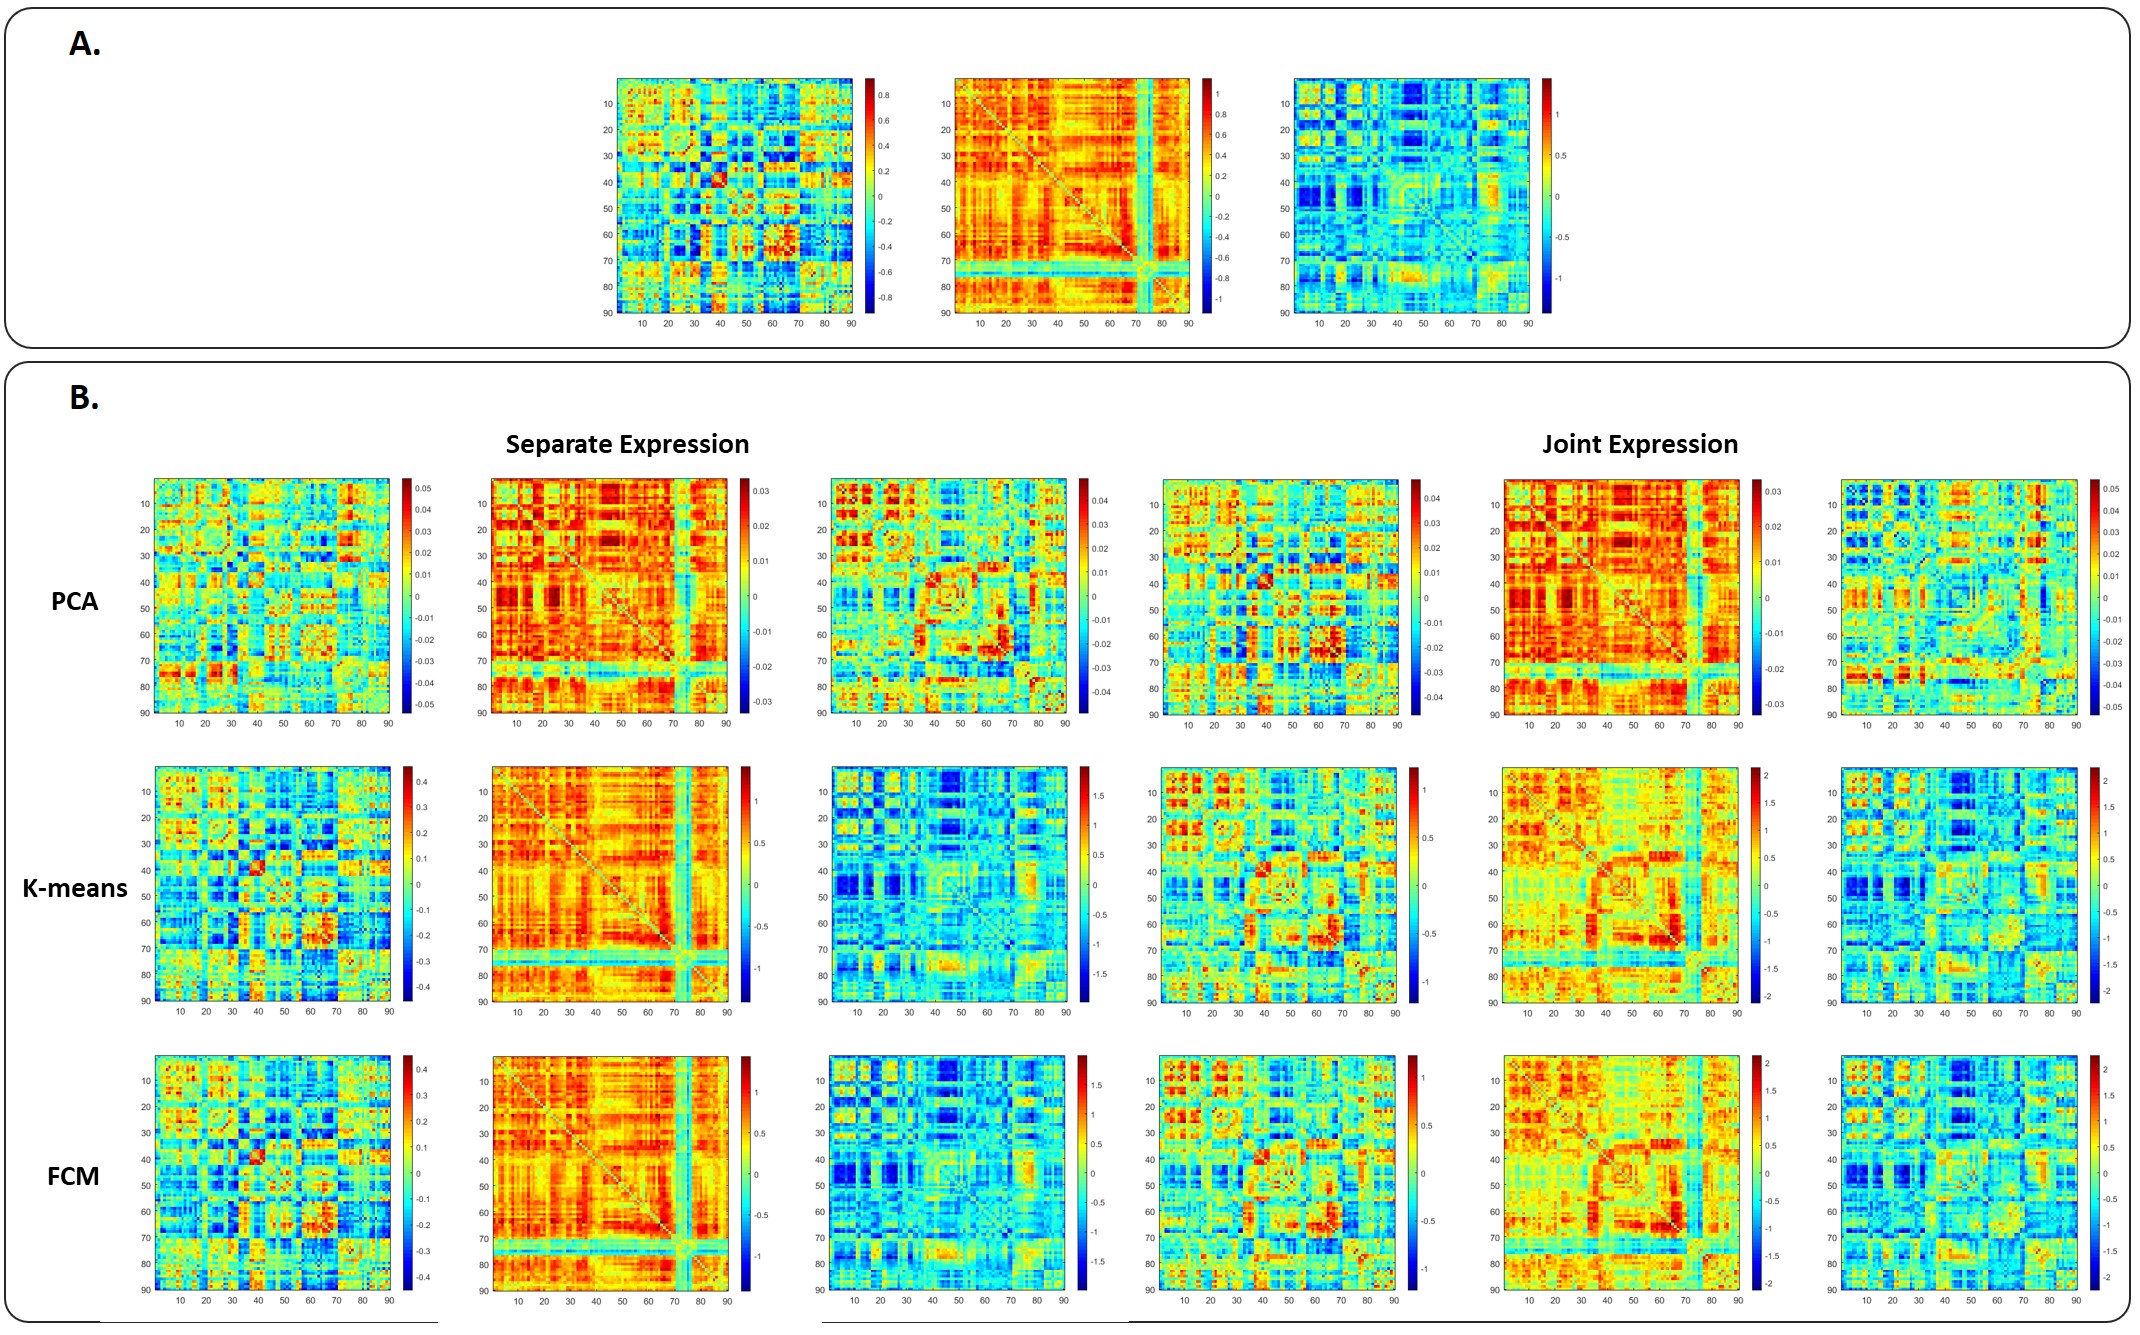
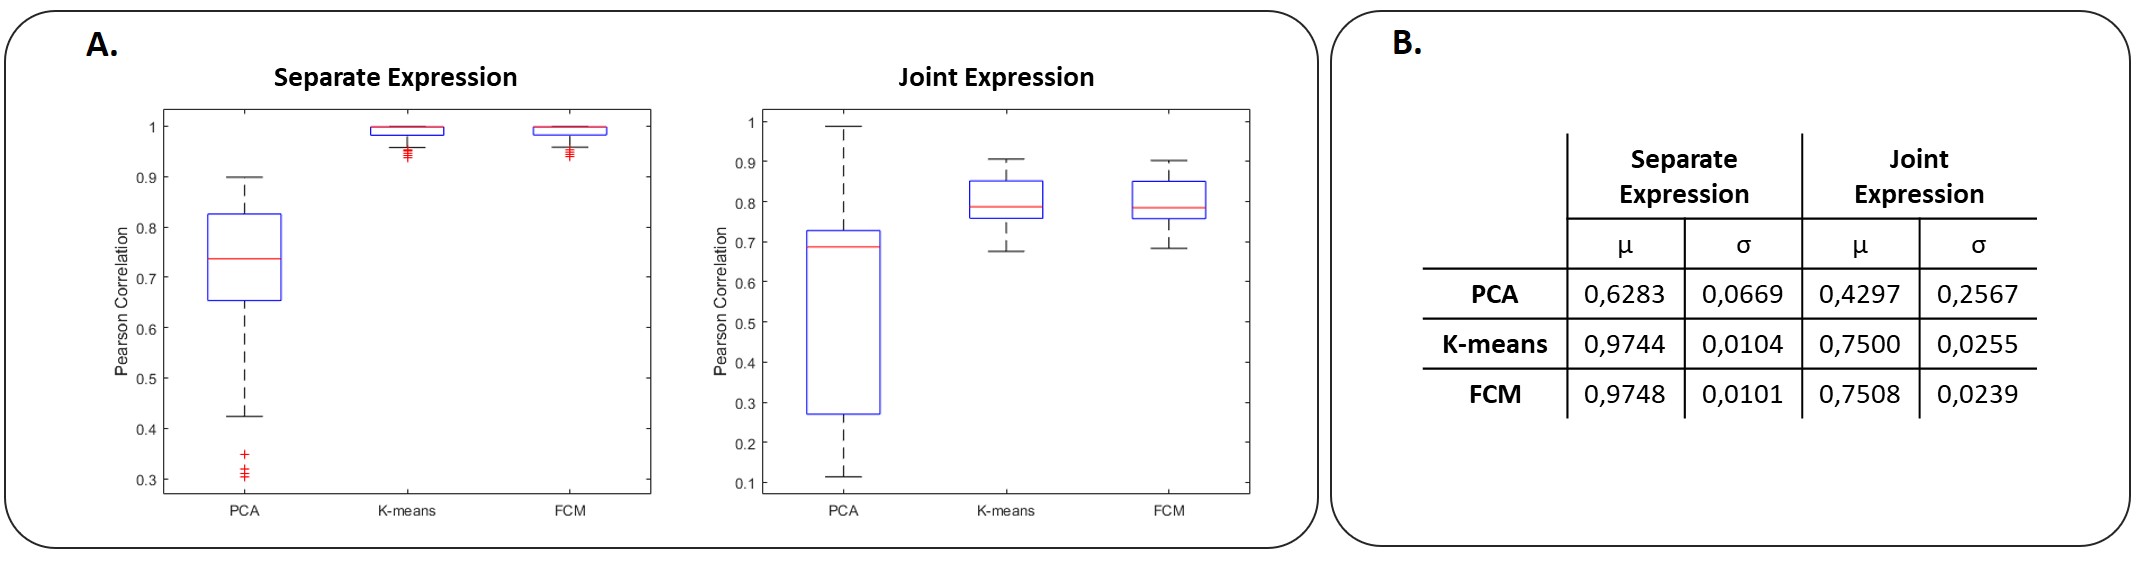
Data Simulation: Data were simulated under two hypotheses in which a single or multiple dFC patterns are expressed at each time window (separate and joint expression, respectively). The dFC data matrix X was factorized as X = DA, where D stores the true dFC patterns as columns, and A the time-dependent weights of each pattern. While three true dFC patterns were identified from the empirical data (below), random weight time-courses normally distributed with N(0; 1) were considered. Columns of A have only one randomly selected nonzero entry, for the separate expression, and all nonzero entries, for the joint expression. Lastly, Gaussian noise was added to the data. One hundred datasets were created under each hypothesis. The dFC patterns retrieved by each method were compared with the true dFC patterns using the Pearson correlation coefficient, and the correspondence between them was achieved using the Hungarian method7. The lowest Pearson correlation coefficient of the 3 corresponding pairs was used as a conservative estimate of the methods’ pattern recovery capacity measure.
Empirical Data: Resting-state BOLD-fMRI data were obtained from 7 epilepsy patients (4 of which undergoing a high density of epileptic discharges) on a 3T MRI system using 2D-EPI (TR/TE=2500/50ms), and subjected to standard pre-processing steps including physiological noise reduction8. Data were parcelled into 90 non-overlapping brain regions, according to the automated anatomical labelling (AAL) atlas. Region-specific representative BOLD time series were estimated by averaging across all voxels of each region. A sliding-window approach was applied to estimate dFC, by computing the Pearson correlation coefficient for each pair of regions in each time window (window size=30s, step=2s). dFC matrices were Fisher transformed, reshaped into vectors, concatenated in time, row-wise demeaned for each patient, and then further concatenated across patients to obtain the final data matrix X.
dFC pattern recognition: PCA, K-means and fuzzy C-means were applied to both simulated and empirical data. Regarding the former, we searched for as many patterns as those used to simulate the data: K=3 for both clustering methods and the first three principal components for PCA were considered. In the case of the empirical data, the number of patterns was predefined, using clustering validation criteria (K=15). The same number of principal components was required. In FCM, the fuzzification parameter controls the overlap degree of clusters; we applied the highest fuzzification parameter (m=1.1) that allowed the partition of empirical data into distinct clusters.
Results
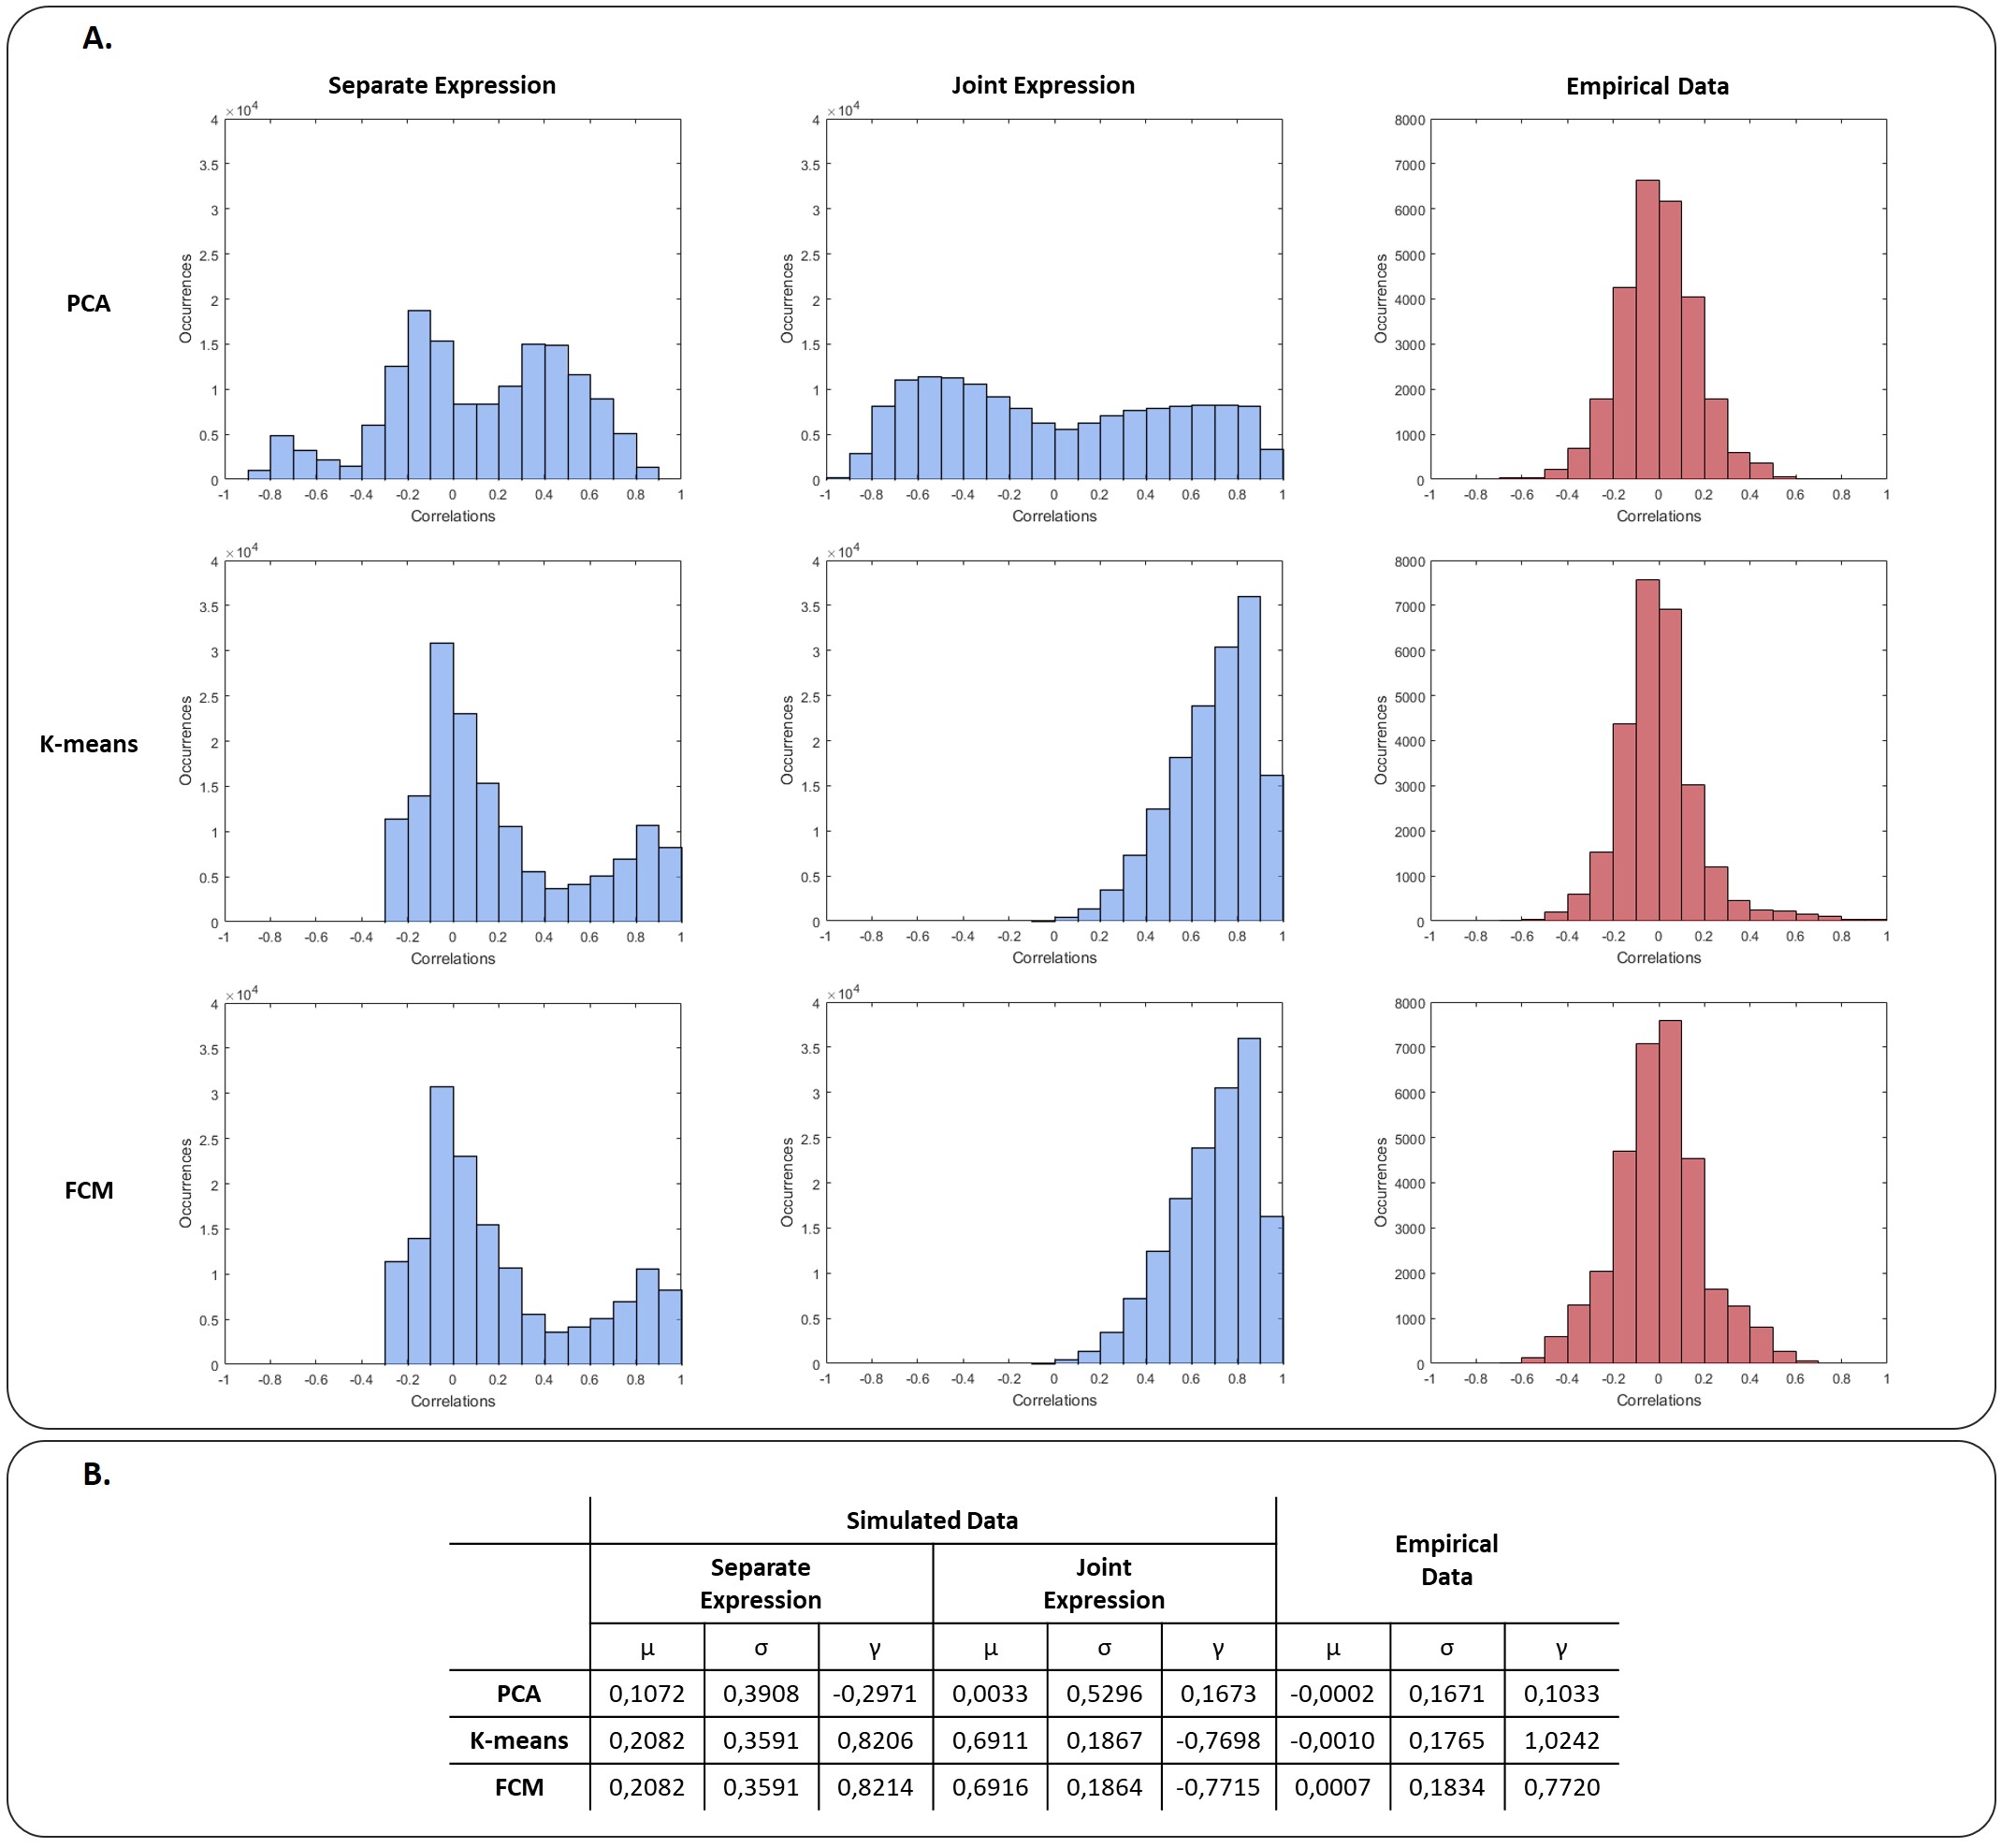
Figure 1 shows an example of the simulation results, including the true dFC patterns and the patterns identified by the 3 techniques for both separate and joint expressions. The overall results of dFC pattern recovery of simulated data are presented in Figure 2. PCA had the worst performance in both separate and joint expression conditions, while K-means and FCM produced similar results (although FCM slightly outperformed K-means). The histograms of all correlation coefficients between each dFC occurrence in each dataset and the estimated dFC patterns are shown in Figure 3, for both simulated and empirical data. The histograms obtained with the empirical data are more consistent with a separate than a joint expression.Conclusion
We showed that the soft assignment of FCM is appropriate for the identification of dFC patterns in resting-state fMRI, with similar results when the hard assignment of k-means is considered, and clearly outperforming PCA. Our results corroborate previous findings3, and further demonstrate the applicability of fuzzy clustering in this context. Furthermore, the application of these techniques to fMRI data collected from epilepsy patients undergoing a high density of epileptic activity indicates a separate, rather than joint, expression of dFC patterns in this case. Future work should further investigate the potential of fuzzy clustering methods, as well as dFC during epileptic states.Acknowledgements
We acknowledge the Portuguese Science Foundation (FCT) for financial support through Project PTDC/SAUENB/112294/2009, Projects PTDC/EEIELC/3246/2012, UID/EMS/50022/2013, and iDecision4Care (IF/00833/2014/CP1238/CT0002), and Grant UID/EEA/50009/2013. S. M. Vieira acknowledges the support by Program Investigador FCT (IF/00833/2014) from FCT, co-funded by the European Social Fund (ESF) through the Operational Program Human Potential (POPH).References
1. Hutchison, RM. et al. Dynamic functional connectivity: promise, issues, and interpretations. Neuroimage. 2013; 80: 360-378.
2. Preti, MG. et al. The dynamic functional connectome: State-of-the-art and perspectives. NeuroImage. 2016.
3. Leonardi, N. et al. Disentangling dynamic networks: separated and joint expressions of functional connectivity patterns in time. Human brain mapping. 2014; 35(12): 5984-5995.
4. Allen, EA. et al. Tracking whole-brain connectivity dynamics in the resting state. Cerebral cortex. 2014; 24(3): 663-676.
5. Leonardi, N. et al. Principal components of functional connectivity: a new approach to study dynamic brain connectivity during rest. NeuroImage. 2013; 83: 937-950.
6. Bezdek, James C et al. FCM: The fuzzy c-means clustering algorithm. Computers & Geosciences, 1984, 10.2-3: 191-203.
7. Kuhn, Harold W. The Hungarian method for the assignment problem. Naval Research Logistics (NRL), 1955, 2.1‐2: 83-97.
8. Abreu, R et al. Physiological noise correction using ECG-derived respiratory signals for enhanced mapping of spontaneous neuronal activity with simultaneous EEG-fMRI. Neuroimage, 2017, 154: 115-127.
Figures