5546
Baseline dynamic functional connectivity predicts response to repetitive transcranial magnetic stimulation in patients with treatment-resistant depression1Sir Peter Mansfield Imaging Centre, University of Nottingham, Nottingham, United Kingdom, 2NIHR Nottingham Biomedical Research Centre, Nottingham, United Kingdom, 3Department of Psychiatry, Nottinghamshire Healthcare NHS Trust, Nottingham, United Kingdom, 4Departments of Psychiatry and Medical Biophysics & Robarts Research Institute, Western University, London, ON, Canada, 5Lawson Health Research Institute, London, ON, Canada
Synopsis
Repetitive transcranial magnetic stimulation (rTMS) is becoming increasingly popular for the treatment of depression. However, there is a need for improving response through identifying predictive biomarkers and understanding mechanisms underlying treatment response to enable stratified patient care. We investigated in a group of 27 patients with treatment resistant depression, whether dynamic interactions between brain networks (measured with resting-state fMRI) can predict clinical response following 4 weeks of rTMS treatment. We found that clinical response may be more related to ‘trait’ like dynamic balance among large-scale networks that are present at the outset of treatment.
Introduction
Repetitive transcranial magnetic stimulation (rTMS) is becoming increasingly popular for the treatment of depression. However, response rates remain suboptimal, highlighting the need for identifying predictive biomarkers as well as delineating mechanism of treatment response to enable stratified patient care. To date, studies have demonstrated rTMS-induced changes in cross-network functional connectivity (FC) in both patients1 and healthy controls.2 However, it is not yet known whether the dynamic interaction among these networks could predict clinical response to rTMS, irrespective of the methodological variations in stimulus delivery.Methods
Twenty-seven patients with treatment-resistant depression received 16 sessions of either FDA-approved rTMS treatment or intermittent theta-burst (iTBS) treatment over 4 weeks, both of which were delivered using neuronavigation based determination of individualised DLPFC targets localised using effective connectivity seeded from right anterior insula (rAI), as described in our previous work.3 Both prior to treatment and at 3-month follow up, each patient underwent clinical assessment (Hamilton Depression Scale (HAMD)), a resting-state fMRI scan on a GE 3 Tesla MR750 system with a 32 channel head coil (echo planar imaging sequence for a duration of 5 min 20 s with eyes open, TR=2 s, TE=32 ms, flip angle=90°, matrix size=64×64 mm, 160 volumes, 35 axial slices, 3.75×3.75×3.6 mm resolution) and an anatomical T1-weighted image acquired using a 3D fast spoiled gradient echo (FSPGR) sequence acquired in sagittal orientation and 1mm isotropic voxel size (field of view (FOV)=256×256×156, repetition time (TR)=8.156 ms, echo time (TE)=3.172 ms, inversion time (TI)=900 ms). Following preprocessing of the resting-state fMRI data, seed-based functional and effective connectivity analyses were used to calculate connectivity between rAI and DLPFC target. We also used independent components analysis (ICA) to extract the three major networks (i.e. default mode (DMN), central executive (CEN), salience(SN)) and ran dual regression to assess changes in large-scale networks following rTMS. These network maps were also used as seed masks for dynamic FC (dFC) using a sliding window of 100 seconds. The statistical analyses consisted of estimating a) FC changes between baseline and 3 months, b) correlation between FC and HAMD scores at baseline and 3 months, and c) correlations between FC changes and HAMD change.Results
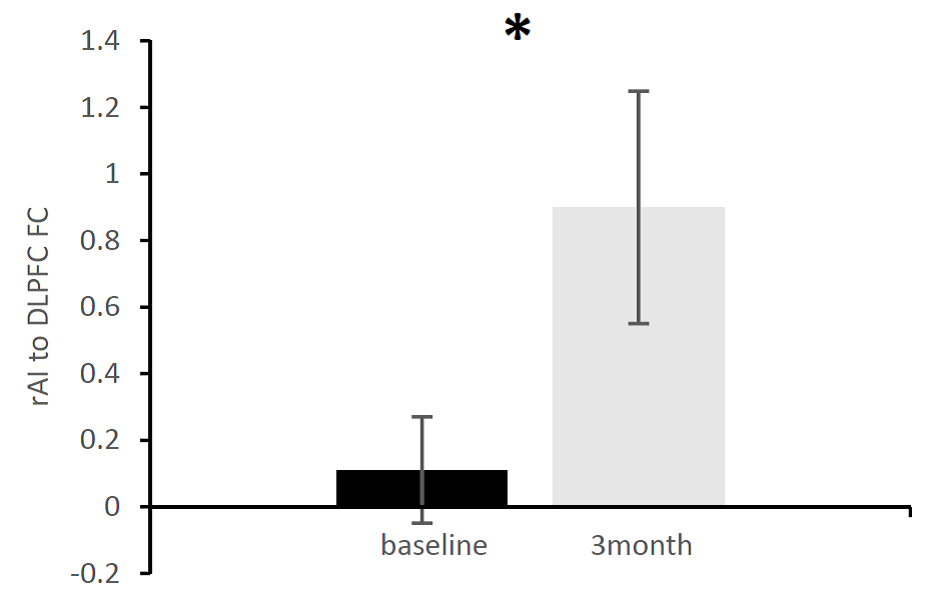
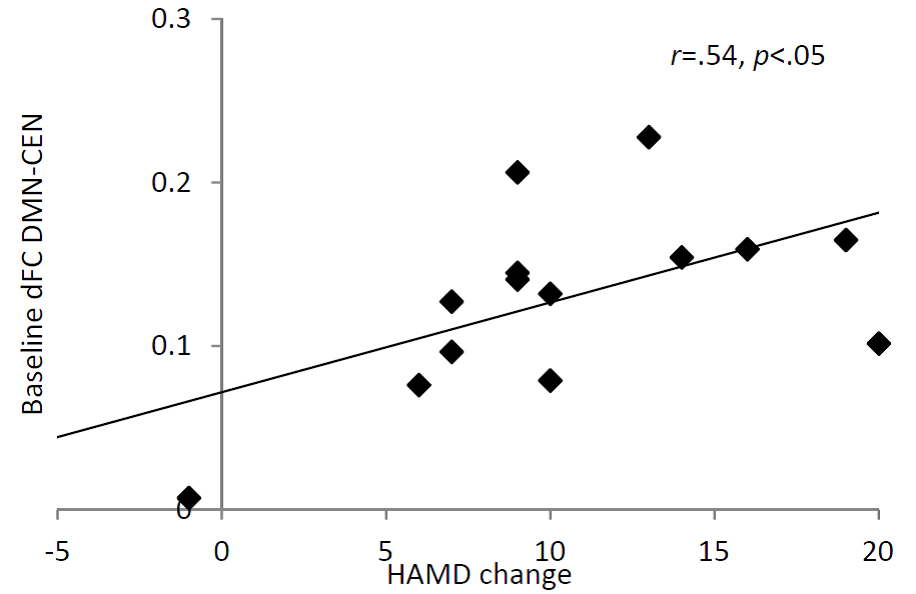
Response rate (defined as at least 50% reduction in HAMD score) across both rTMS protocols was 67%. The FDA protocol response rate was 44%, while the iTBS protocol response rate was higher at 89%, though this did not reach significance. FC between the rAI-to-DLPFC significantly increased following rTMS (p<.05) (Fig 1.). However, HAMD score was not associated with this FC change. In addition, HAMD score did not correlate with FC at either baseline or 3-month follow up. On the other hand, dFC within/between the major networks showed no change between the two timepoints, however the DMN-CEN dFC was predictive of change in HAMD score (r=.54, p<.05) (Fig 2.).Discussion
We demonstrated that individually targeted rTMS treatment modulates the FC between the rAI and DLPFC that was maintained even after the end of the 4-week treatment. However, this change was not related to clinical response measured by the HAMD scale. The large-scale network interactions on the hand, were not significantly affected by rTMS treatment, however, greater variability in connectivity between the DMN and CEN was predictive of better outcome at 3 months follow up. Indeed, recent work has reported similar regions (DLPFC and posterior cingulate cortex) showing highest discriminatory power for responders and non-responders to rTMS treatment,4 though this was investigating functional connectivity only. We posit that greater flexibility (i.e. within-subject variance) in communication between these large-scale networks may lead to a superior capacity for responding to rTMS.Conclusion
Targeted rTMS treatments modulate directly stimulated networks, however clinical response may be more related to the ‘trait’ like dynamic balance among large-scale networks that is present at the outset of treatment. The variability of connectivity between large-scale networks may therefore be relevant in the development of response prediction models.Acknowledgements
This
study was supported by Translational Imaging Competition funds from the SPMMRC and Imaging & Radiological Sciences, and the People Programme
(Marie Curie Actions) of the European Union’s Seventh Framework Programme
(FP7/2007-2013) under REA grant agreement No PCOFUND-GA-2012-600181.
References
1. Salomons, T. V. et al. Resting-State Cortico-Thalamic-Striatal Connectivity Predicts Response to Dorsomedial Prefrontal rTMS in Major Depressive Disorder. Neuropsychopharmacology. 2013;39: 488–498.
2. Tik, M. et al. Towards understanding rTMS mechanism of action: Stimulation of the DLPFC causes network-specific increase in functional connectivity. NeuroImage. 2017;162:289–296.
3. Iwabuchi, S. J. et al. Targeted transcranial theta-burst stimulation alters fronto-insular network and prefrontal GABA. NeuroImage. 2017;146:395–403.
4. Drysdale, A. T. et al. Resting-state connectivity biomarkers define neurophysiological subtypes of depression. Nat. Med. 2016;23:28-38.
Figures