5545
Altered Variability in Functional Connectivity of the Anterior Cingulate Cortex in Patients with Treatment-resistant and Non-treatment-resistant Depression1Radiology, West China Second University Hospital of Sichuan University, Chengdu, China, 2Huaxi MR Research Center, West China Hospital of Sichuan University, Chengdu, China
Synopsis
Although substantial efforts have been made to elucidate the neuronal basis of both Treatment-resistant depression (TRD) and non-TRD (nTRD), the results are inconsistant. We apply the resting-state dynamic functional connectivity (D-RSFC) to explore the divergence of neuronal basis of both depression subtypes. Our results demonstrated that the prefrontal-limbic circuit is the most stable dysfunctional brain network in depression. The D-RSFC method could reveal the altered dynamic functional connectivity in both MDD subtypes and the divergence of brain networks between TRD and nTRD. Additionally, we speculate that the caudate-ACC circuit might be the biomarker for evaluating treatment response in TRD.
Purpose
Major depressive disorder (MDD) is the most common unipolar affective disorder and is characterized by persistent and pervasive feelings of sadness, guilt, and worthlessness. Despite advances in the development of treatment strategies for MDD, up to 63% of MDD patients suffer at least one recurrence, and approximately 30% of patients do not respond to standard antidepressant treatment1. These patients are classified as having Treatment-resistant depression (TRD), which adversely affect an individual’s normal life and general health and lead to increased social and economic burdens2. Previous fMRI studies have related MDD to widespread local abnormalities in brain regions3. Although substantial efforts have been made to elucidate the neuronal basis of TRD, the results are inconsistent and little is known about whether or not there exist the divergent neuronal circuits between TRD and non-TRD (nTRD). We aim to assess the between-group differences of the mean strength and variance of the dynamical functional connectivity to explore the divergence of neuroal basis between both MDD subtypes.Methods
50 TRD patients and 50 nTRD patients as well as 50 healthy controls (HCs) underwent a resting-state fMRI scan with a 3-T MR system. The anterior cingulate cortex (ACC) was selected as the seed region. A variable parameter regression model combined with the Kalman filtering method4 was employed to detect the dynamic FC in the resting-state (D-RSFC) between the seed region and other voxels of the whole-brain.Results
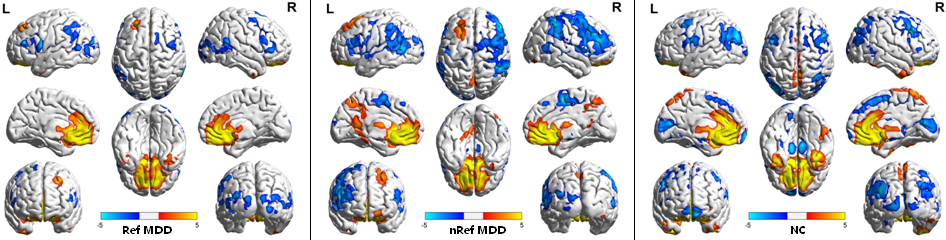
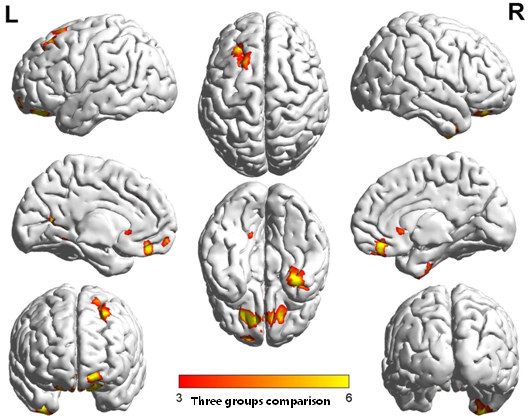
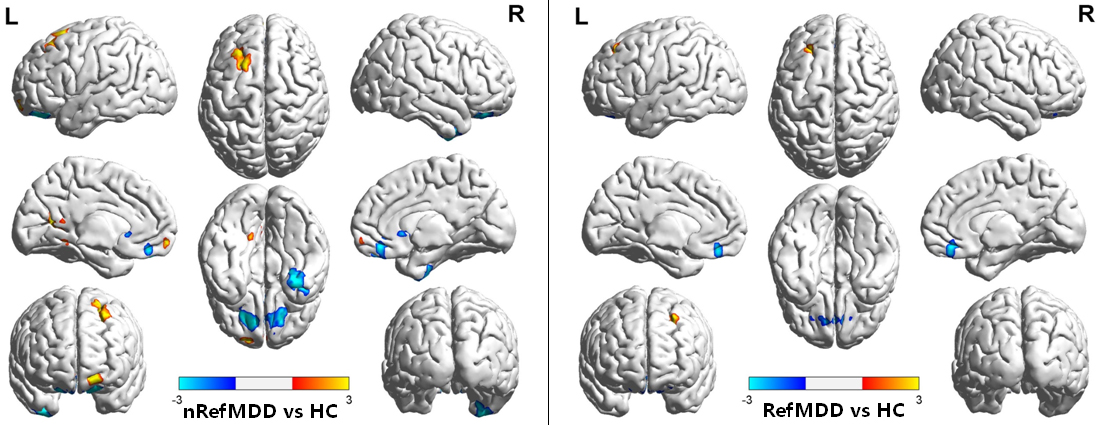
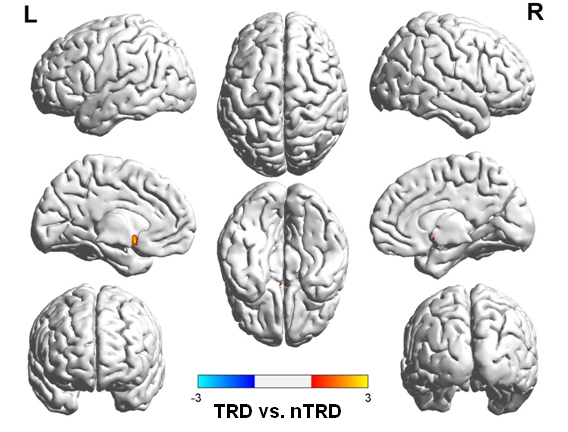
Widespread ACC D-RSFC patterns were found within each group (Figure 1). Among the three groups, significantly different D-RSFC were found in some frequently mentioned brain regions including bilateral orbitofrontal cortex (OFC), parahippocampus gyrus (PHG), prefrontal cortex and caudate (Figure 2). Relative to the HC group, both MDD subtypes exhibited increased positive D-RSFC in the left DPFC and decreased positive D-RSFC in the right hippocampus and bilateral OFC (Figure 3). The positive D-RSFC of bilateral OFC-left sgACC showed a significant negatively correlation with the HAM-D scores in the TRD group(r=-0.52). Relative to nTRD, the negative D-RSFC of TRD was found increased in the left OFC and decreased in the right post-central gyrus (Figure 4).Discussion
Traditional linear measurement may not entirely reflect the intrinsic interactions between the brain regions, particularly for regions that are linked by different anatomical structures. Currently, amount of studies have suggested that the functional connectivity between regions could be categorized as static or dynamic components. There are different characteristics between static and dynamic RSFC derived from resting-state fMRI data: the static RSFC primarily reflects the average relationship across time between the BOLD signals of brain regions; in contrast, the D-RSFC depicts the time-varying association in the BOLD signals between regions. Using a variable parameter regression analysis and the Kalman filtering model, we investigated the D-RSFC patterns of MDD subtypes and HCs in the whole brain using the left sgACC as seed region. Both mean strength and varieablity D-RSFC were used as basic parameters to assess the D-RSFC differences between MDD subtypes or between MDD patients and HCs. In particular, one display the mean connectivity strength throughout the entire scanning process and the other depict the fluctuating characters in the specific neurociruit. Using D-RSFC method, our results demonstrated that the prefrontal-limbic circuit is the most stable dysfunctional brain network in both MDD subtypes.Conclusion
The D-RSFC method can well reveal the altered dynamic functional connectivity in both MDD subtypes and the divergence of brain networks between TRD and nTRD. Additionally, we speculate that the caudate-ACC circuit might be the biomarker for evaluating treatment response in TRD.Acknowledgements
This study was supported by the National Natural Science Foundation (Nos. 81030027, 81030028, 811225012, 81227002, 31221003, and 81220108013, 81401479 and 91432115), the National Key Technologies R&D Program of China (No. 2012BAI01B03), the National Science Fund for Distinguished Young Scholars (No. 81225012), and Chinese Postdoctoral Science Foundation (No. 2013M530401).References
1.Smith, G.S., Kramer, E., Hermann, C., Ma, Y., Dhawan, V., Chaly, T., Eidelberg, D. (2009) Serotonin modulation of cerebral glucose metabolism in depressed older adults. Biol Psychiatry, 66:259-266.
2.Stimpson, N., AGRAWAL, N., LEWIS, G. (2002) Randomised controlled trials investigating pharmacological and psychological interventions for treatment-refractory depression Systematic review. Br J Psychiatry, 181:284-294.
3. Diener C, Kuehner C, Brusniak W, et al. A meta-analysis of neurofunctional imaging studies of emotion and cognition in major depression. Neuroimage 2012;61(3):677-685.
4. Kalman RE. A new approach to linear filtering and prediction problems. Journal of basic Engineering 1960;82(1):35-45.
Figures