5541
A New Method of Brain Functional Connectivity Analysis via Deep Learning1Physics and Astronomy, University of Georgia, Athens, GA, United States, 2Bio-Imaging Research Center, University of Georgia, Athens, GA, United States, 3Department of Small Animal Medicine and Surgery, University of Georgia, Athens, GA, United States, 4Animal and Dairy Science, University of Georgia, Athens, GA, United States
Synopsis
The pig brain model is an important translational model due to its similarity to the human brain anatomy and physiology. However, a lack of a priori information required for common functional analysis techniques dictates that new techniques are required to explore the connectivity of the pig brain. Here we present two new, unsupervised forms of analysis to find functional connectivity in healthy and ischemic stroke pigs using sparse deep convolutional neural networks and dynamic time warping with spectral clustering that yield complementary results.
Purpose
The pig brain model is an important translational model due to its similarity to the human brain in anatomy and physiology. The pig brain model is used in studies involving degenerative brain disorders, stroke, and traumatic brain injury.1,2 Here, we use novel unsupervised analysis methods, a deep convolutional neural network sparse autoencoder (CNN-SA) and dynamic time warping coupled with spectral clustering (DTW+SC), to compare functional connectivity between healthy and trauma induced (stroke) pig brains. fMRI data was acquired while pigs were anesthetized during scans. These resting state-like scans were analyzed to compare and contrast the functional connectivity found in the fMRI signals of the healthy versus ischemic stroke pigs.Data Acquisition and Methods
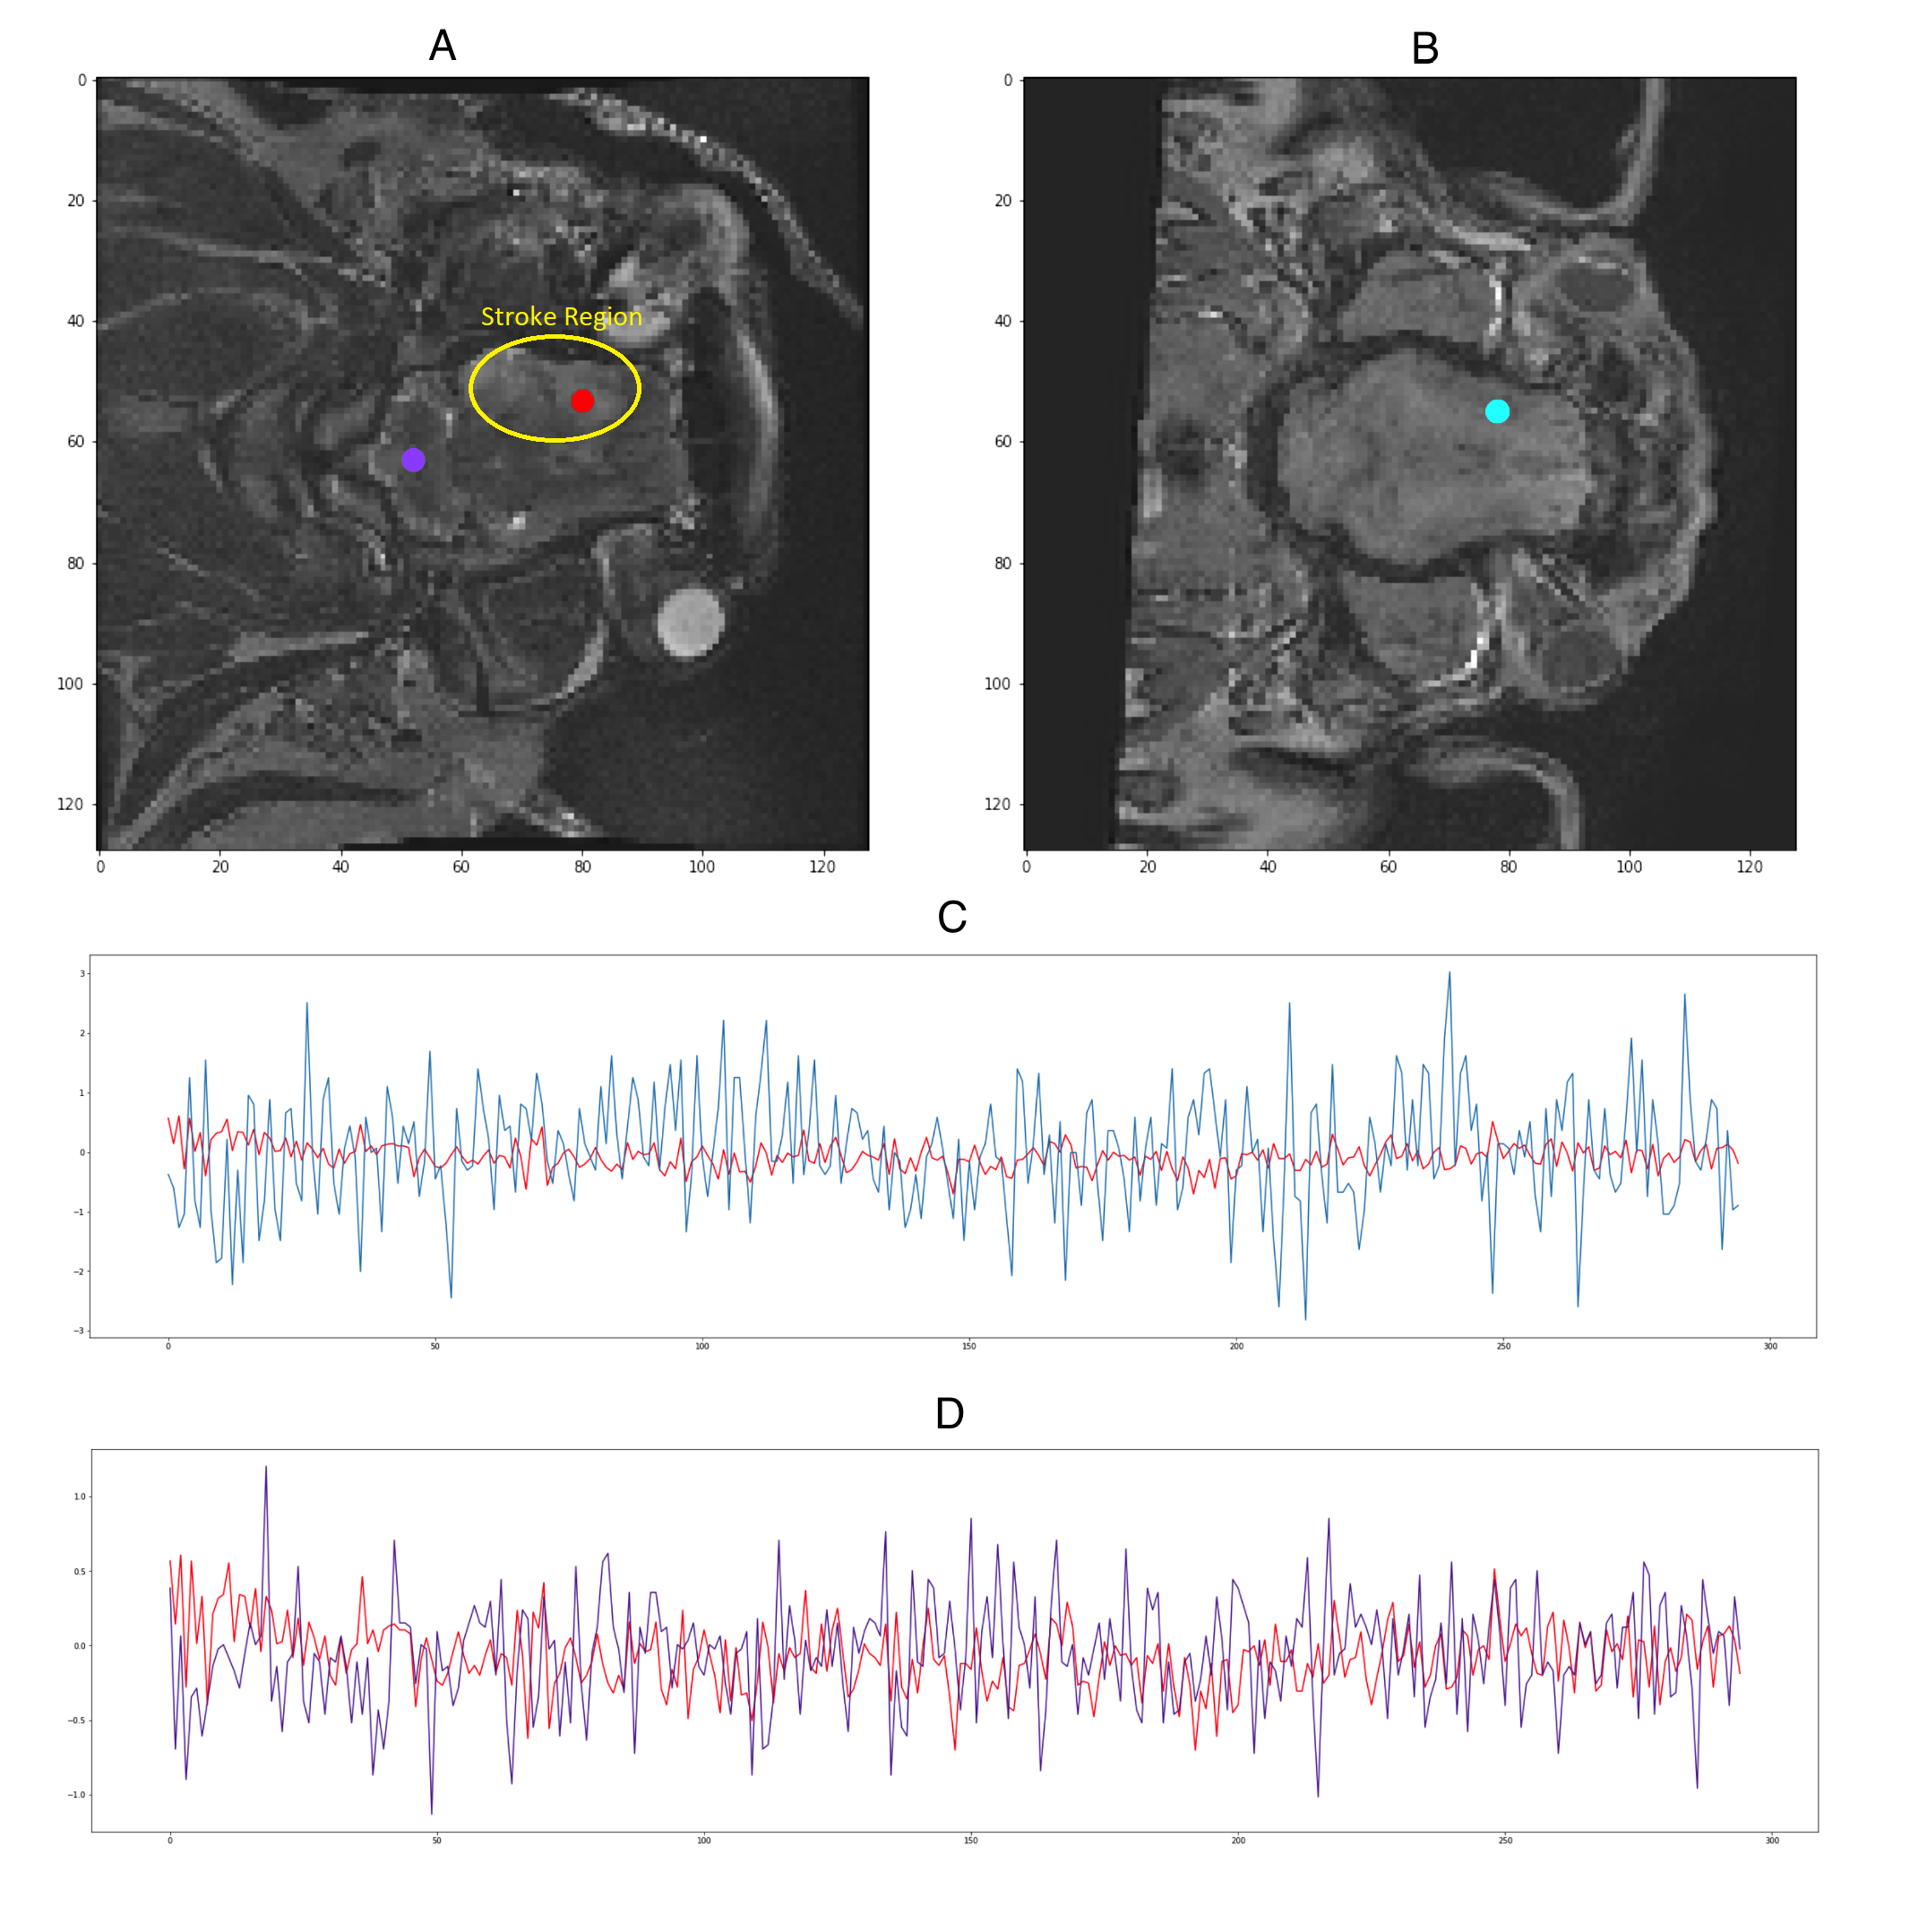
MRI data acquisition: Resting state BOLD fMRI data was collected from two adult male castrated Landrace pigs (1 pig 24 hours post-ischemic stroke induction and 1 healthy pig) using a 3T GE HDx Signa scanner. To minimize signal changes from motion, the pigs were anesthetized throughout the study. The scan consisted of a total of 300 time points with a TE of 3ms, TR of 2000ms, over 21 slices with a resolution of 1.56x1.56mm, and an acquisition matrix of 128x128 voxels. Anatomical scans were also performed. Figure 1 shows two representative slices and voxel time series from both pigs with a clearly observable stroke region.
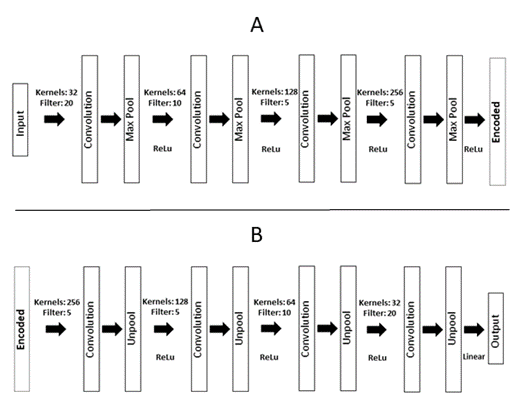
Data analysis: To study functional connectivity, two methods for discovering functional connectivity were compared: CNN-SA and DTW+SC. The goal of CNN-SA was to train an unsupervised autoencoder to store temporal features related to hemodynamic responses in the weights of the trained model. Figure 2 shows the overall structure of the CNN-SA. The weights in each layer are convolved over the input time-series and outputted functional connectivity maps are a sequence of values that correspond to how strongly the weights correlate to a sliding window section of the time-series. Functional connectivity maps from the first layer for each voxel were mapped back to the anatomical locations to determine if locations in the brain have clusters of similarly high functional connectivity strength. Because CNN-SA is trained to extract common features present in the time-series, these functional connectivity strengths should show functional similarities between regions and potentially expose resting state network (RSN) locations.3 A complementary method involving the use of DTW+SC was also performed to provide another analysis for comparison. Both dynamic time warping and spectral clustering have been separately used as potential unsupervised methods for uncovering RSNs.4,5
Results and Discussion
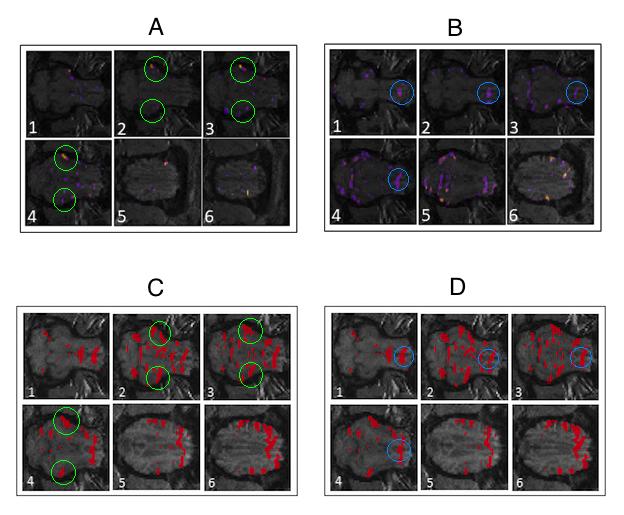
Figure 3 displays functional connectivity maps from CNN-SA and
DTW+SC results for the healthy pig. The sparsity in locations of high
functional connectivity from both methods suggest that the clusters represent
unique features only represented in specific locations in the brain. The
clusters in the healthy brain show symmetry between the two hemispheres of the
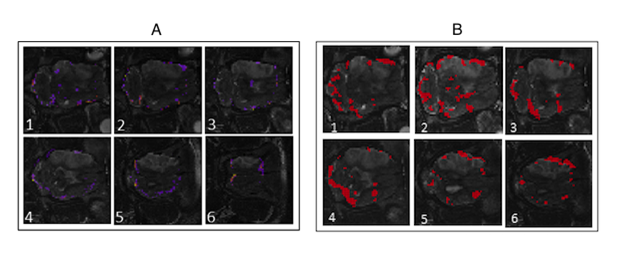
brain, whereas the functional connectivity in the trauma induced pig in Figure 4 are asymmetric and focused in
areas opposite the stroke region. For both the healthy and trauma induced pig,
results from CNN-SA are comparable to the results found by DTW+SC analysis
method. Figure 3 highlights several characteristic
features of the connectivity maps found by CNN-SA and their complementary
features present in the maps from DTW+SC. When comparing the two methods for
the healthy pig, it seems that DTW+SC functional connectivity is a combination
of the two maps of functional connectivity found by CNN-SA. Conclusions
Previous work with spectral clustering has relied on a priori information from other brain functional analysis methods, such as seed based analysis, to find functional connectivity.6 While this information is not yet available for pigs, the similarities between CNN-SA and DTW+SC results suggest that alternative methods like CNN-SA or DTW+SC are consistently finding functional connectivity that may be related to RSNs. Additionally, the weight values produced by CNN-SA may provide further analysis avenues not present in methods like DTW+SC, due to its potential association with the hemodynamic response. Despite its application potentials, the full impact of this new method of brain functional analysis will continue to unfold.Acknowledgements
Research was supported, in part, by the National Institute of Neurological Disorders and Stroke of the National Institutes of Health under award number R01NS093314 as well as the University of Georgia Office of the Vice President for Research.References
1. Gutierrez K, Dicks N, Glanzner WG, Agellon LB, Bordignon V. Efficacy of the porcine species in biomedical research. Front Genet. 2015;6(SEP). doi:10.3389/fgene.2015.00293.
2. Douglas WR. OF PIGS AND MEN AND RESEARCH. Space Life Sci. 1972;3:226-234. doi:10.1007/BF00928167.
3. Goodfellow, Ian, Bengio, Yoshua, Courville A. Deep Learning. MIT Press. http://www.deeplearningbook.org/. Published 2016.
4. Venkataraman A, Van Dijk KRA, Buckner RL, Golland P. Exploring functional connectivity in fMRI via clustering. In: 2009 IEEE International Conference on Acoustics, Speech and Signal Processing. Vol 33. ; 2009:441-444. doi:10.1038/nbt.3121.ChIP-nexus.
5. Meszlenyi RJ, Hermann P, Buza K, Gal V, Vidnyanszky Z. Resting State FMRI Functional Connectivity Analysis Using Dynamic Time Warping. Frontiers in Neuroscience. 2017;11. doi:10.3389/fnins.2017.00075
6. Buckner RL, Andrews-Hanna JR, Schacter DL. The Brain’s Default Network. Ann N Y Acad Sci. 2008;1124(1):1-38. doi:10.1196/annals.1440.011.
Figures