5540
A correlation of resting state DfMRI signals reflects functional connectivity in awake mouse1Departemnt of Neuropsychiatry, Keio University School of Medicine, Tokyo, Japan, 2ATR Brain Information Communication Research Laboratory Group, Kyoto, Japan, 3Neural Computation Unit and Biological Physics Theory unit, Okinawa Insititute of Science and Technology, Okinawa, Japan
Synopsis
Diffusion fMRI (DfMRI) is an imaging method to investigate brain activity regardless of hemodynamic state. The previous study has proposed that resting state DfMRI (rsDfMRI) is suitable to investigate a magnitude of basal activity. In this study, we examined our hypothesis that this rsDfMRI have a potential of detecting functional connectivity (FC). FC patterns were compared between rsDfMRI and BOLD-rsfMRI in awake mice. A strong correlation of the pattern between rsDfMRI and BOLD-rsfMRI indicated that rsDfMRI is possible to conduct FC analysis. Therefore, we propose that rsDfMRI is a powerful tool to detect brain network as well as brain activity.
Purpose
Diffusion fMRI (DfMRI)1 has been shown to reflect neural activity without BOLD confounding hemodynamic effects, as DfMRI signals are not of vascular origin2. Previous study has suggested that apparent diffusion coefficients (ADCs) reflected basal neural activity accompanied with neural cell swelling3. A local infusion of cell swelling modulators altered ADCs at remote regions as well as a local infusion area3, indicating that the DfMRI detected cell-swelling based functional network. We hypothesized that resting state DfMRI (rsDfMRI) potentially analyzed functional connectivity (FC) such as BOLD-resting state fMRI (rsfMRI) as well as basal activity (Fig. 1). In this study, we compared a FC pattern of rsDfMRI with that of BOLD-rsfMRI in awake mouse to examine the hypothesis.Methods
The images of rsDfMRI and BOLD-rsfMRI were obtained with 14 C57BL/6 mice. We performed a surgery to put an acclimation bar on the skull at 8 weeks of age, waited for 1 week for the recovery, started the MRI acclimation4 at 10 weeks of age, and finished the acclimation at 12 weeks of age.
MRI was conducted at 11.7T equipped with cryoprobe (BioSpec, Bruker). DfMRI images were acquired with the following parameters: diffusion-sensitized double SE-EPI sequence; TR/TE=2000/37 ms, FOV=16×16 mm2, Matrix=80×80, Slice thickness=0.8 mm. Slice number=10, Repetition number=150, Scan time=10 min, and b-values=1000 and 1800 mm2/s along 1 directions; [X=1,Y=1,Z=1]. BOLD images were acquired using GE-EPI sequence with the following parameters; TR/TE=2000/12 ms, FOV=16×16 mm2, Matrix=80×80, Slice thickness=0.4 mm. Slice number=20, Repetition number=300, and Scan time=10 min. Structural T2 weighted image was acquired by 3D-RARE with following parameters; TR/TE=1800/32 ms, FOV=15×15×12.5 mm3, Matrix=256×256×32, and Scan time=11 min. Breathing and body temperature were monitored during scanning.
Seed-based FC analysis was performed using time-series data of diffusion weighted signal acquired with b=1800 mm2/s (Sb1800) and BOLD signals. Time-series data of ADC was not used for FC analysis because the signal-noise ratio (SNR) of ADC was lower than that of Sb1800. Pre-processing (realignment, slice timing, normalization) was performed using SPM12 and spatial smoothing was conducted with 0.4 mm of full width at half maximum. Time-series data of Sb1800 and BOLD were detrended and temporally filtered with 0.008-0.1 Hz.
Pearson’s correlation coefficient maps of between the time course of a predetermined region of interest (ROI) and all other voxels of the brain were calculated after de-noising and de-spiking using functional connectivity toolbox (CONN). The ROIs of 157 brain loci were defined with the Allen Mouse Brain Atlas (both sides of 25 cortical areas, 18 basal ganglia, 4 hippocampal areas, 18 thalamic areas, 4 hypothalamic areas, and 3 midbrain areas and 13 hindbrain areas). Pearson’s correlation coefficients between a predetermined ROI and all other ROIs were estimated to generate a 157×157 connectivity matrix. Global mean signal was regressed out from the pre-processed time-series data to reduce non-neural signal correlations. Regions of white matter and cerebrospinal fluid were masked out.
Results and Discussion
Seeded ROIs-correlation maps (Fig. 2) and ROI-to-ROI correlation matrices (Fig. 3) of rsDfMRI exhibited similar patterns of FC as those of BOLD-rsfMRI. Connectivity patterns between rsDfMRI and BOLD-rsfMRI were strongly correlated (Fig. 4; r=0.66, p<1×10²³), indicating that rsDfMRI enabled to perform FC analysis.
There are some differences in extended-correlation regions (voxel size) and correlation strengths between rsDfMRI and BOLD-rsfMRI. The correlation maps of rsDfMRI did not completely overlap with those of BOLD-rsfMRI. This is likely because the BOLD signal is based on neurovascular coupling. In addition, overall correlation strengths of rsDfMRI were lower than those of BOLD, particularly, in left-right networks, cortico-cortical networks, and thalamic networks (Fig. 5). This difference is likely because the SNR of the rsDfMRI signal is lower than that of the BOLD signal.
Conclusion
Our rsDfMRI has opened a possibility of vascular-independent functional network analysis. The correlation coefficients of time series data of Sb1800 reflected neural connectivity. In addition, the previous study suggested that ADCs derived from rsDfMRI was capable of investigating basal brain activity3. Together, we proposed that our rsDfMRI is a powerful functional imaging method to investigate both of basal brain activity and brain network.Acknowledgements
We thank Jiafu Zeng for animal support with mouse acclimation for MRI acquisition.References
1. Le Bihan D, Urayama S, Aso T et al. Direct and fast detection of neuronal activation in the human brain with diffusion MRI. Proc Natl Acad USA. 2006;103(21):8263-8268.
2. Tsurugizawa T, Ciobanu L, Le Bihan D. Water diffusion in brain cortex closely tracks underlying neuronal activity. Proc Natl Acad USA. 2013;110(28):11636-11641.
3. Abe Y, Tsurugizawa T, Le Bihan D. Water diffusion closely reveals neural activity status in rat brain loci affected by anesthesia. PloS Biol. 2017;15(4):e2001494.
4. Yoshida K, Mimura Y, Ishihara R et al. Physiological effects of a habituation procedure for functional MRI in awake mice using a cryogenic radiofrequency probe. J Neurosci Methods. 2016;274:38-48.
Figures
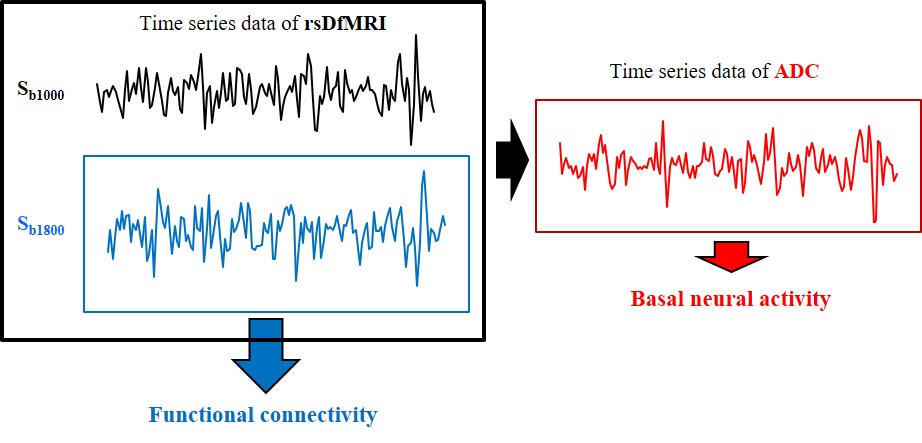
Fig.1
Schematic diagram of rsDfMRI analysis. Time series data of rsDfMRI (Sb1000 and Sb1800) were obtained with b=1000 and 1800 s/mm2. Time series data of ADC which were calculated from Sb1000 and Sb1800 reflect a magnitude of basal neural activity. Temporal correlations of time series data of Sb1800 reflect functional connectivity. The rsDfMRI data is possible to evaluate both of brain activity and brain network.
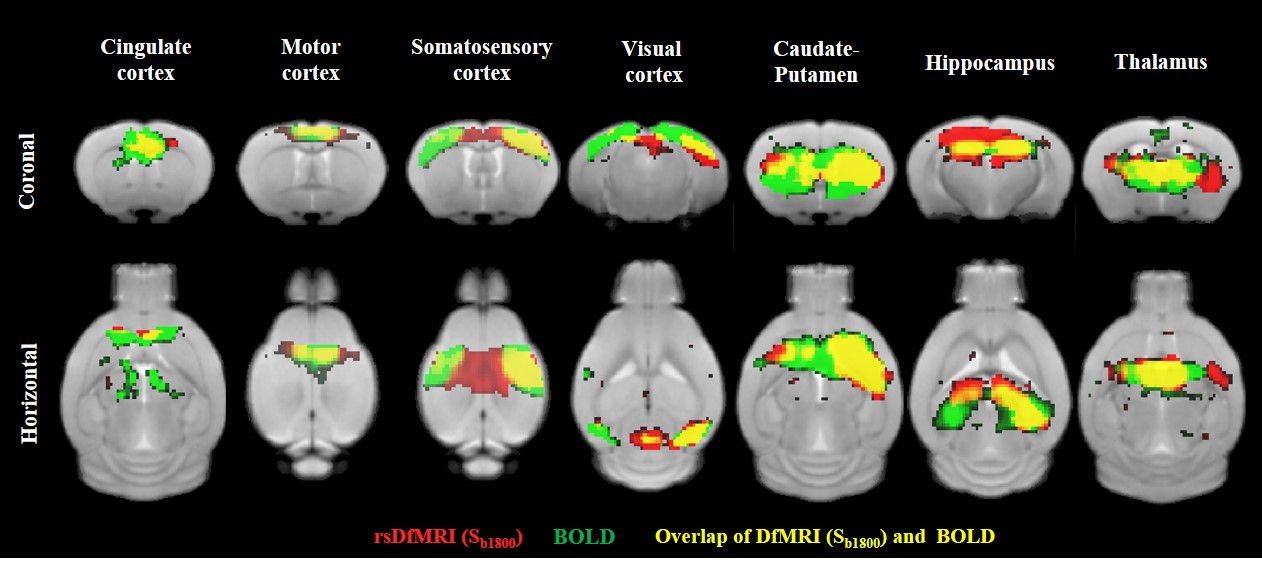
Fig. 2
Comparison of correlation coefficient maps between rsDfMRI (Sb1800) and BOLD. Seeded ROIs were put at right side of cingulate cortex, motor cortex, somatosensory cortex, visual cortex, Caudate-Putamen, hippocampus, and thalamus. Red, green, and yellow color mean functional connectivity regions (p<0.05, FDR) of rsDfMRI (Sb1800), BOLD, and their overlap, respectively.
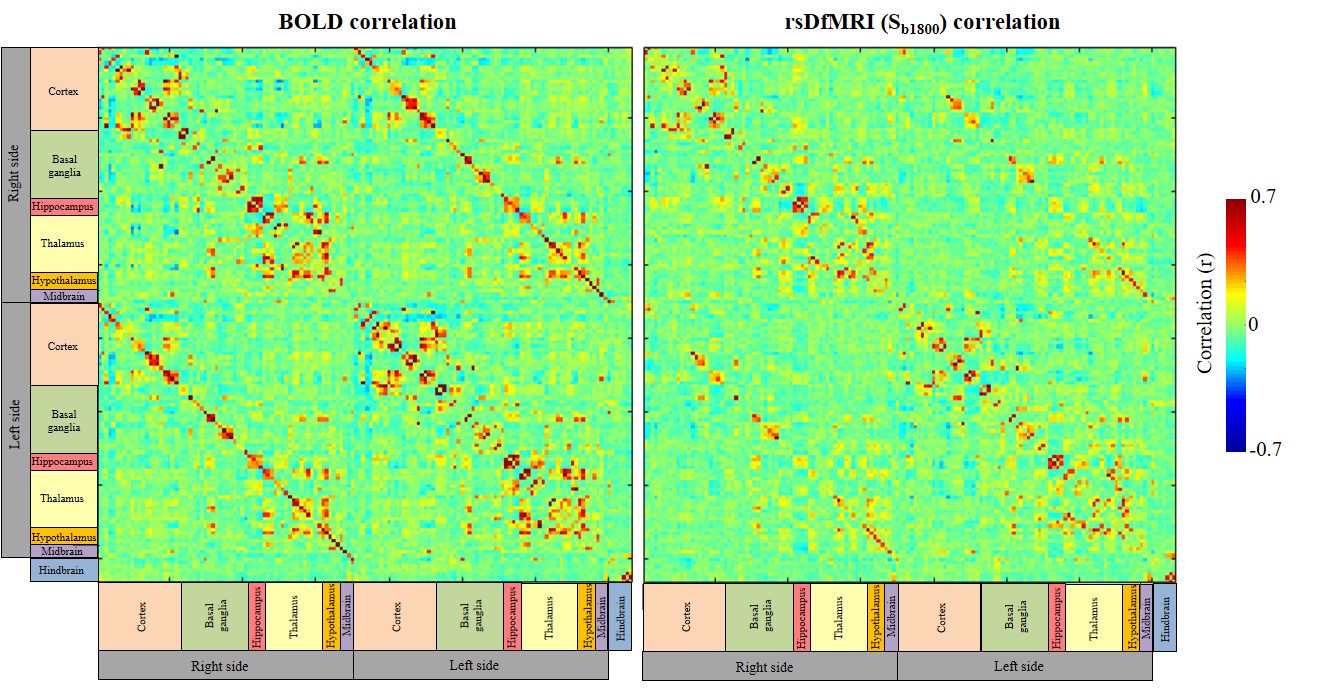
Fig. 3
Comparison of ROI-to-ROI matrices of correlation coefficient between rsDfMRI (Sb1800) and BOLD. Seeded ROIs are 157 brain loci including left and right side of the brain.
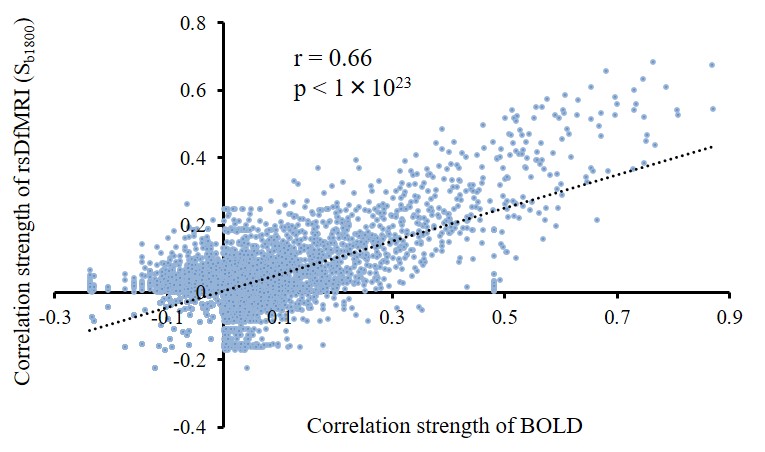
Fig. 4
Each correlation coefficient of rsDfMRI (Sb1800) and BOLD were plotted to exhibit a strong relationship between rsDfMRI (Sb1800) correlation coefficient and BOLD correlation coefficient.
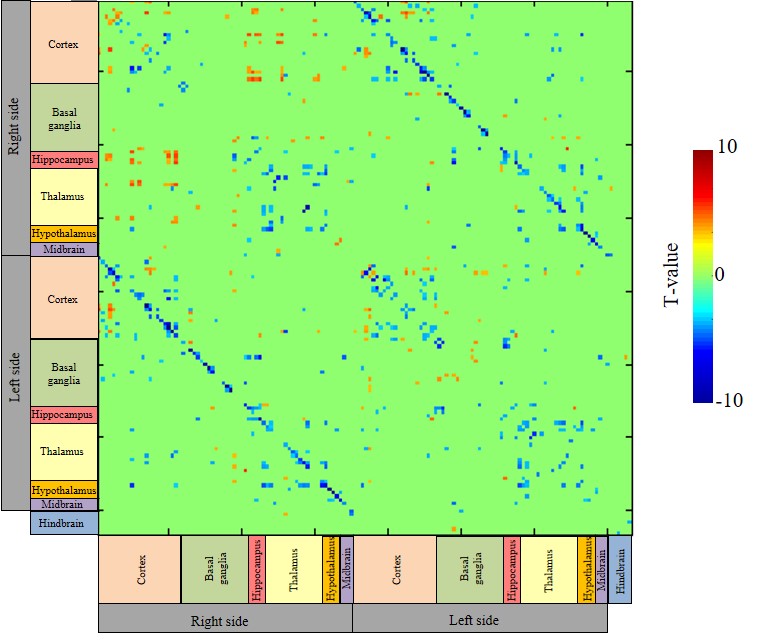
Fig. 5
Difference matrix of correlation coefficient between rsDfMRI (Sb1800) and BOLD. Blue color of t-value means a significant decrease (p<0.05. multiple comparisons by FDR) in correlation coefficients of rsDfMRI (Sb1800), compared with those of BOLD.