5539
Mapping the functional recovery of brainstem injury-induced comatose rats with eigenvector-centrality mapping and seed-based analysis of resting-state fMRI1Max Planck Institute for Biological Cybernetics, Tübingen, Germany, 2Graduate Training Centre of Neuroscience, Tübingen, Germany, 3Massachusetts General Hospital, Boston, MA, United States, 4The Second Affiliated Hospital, Wenzhou Medical University, Wenzhou, China
Synopsis
Here we used the rat brainstem coma model and rs-fMRI to systematically study the network dynamics during recovery from coma. Using whole brain connectivity analysis we obtained connectivity slope maps from the comatose animals, which revealed the brain regions with higher connectivity changes. In parallel, we performed a seed-based analysis to specify the strengthened connections between ROIs. Both methods indicated an increase in the connectivity between basal forebrain, basal ganglia and thalamus, along the acute phase of recovery from coma. These parallel analyses applied to comatose rats provided new insights into the regulations occurring during recovery of consciousness.
Introduction
Brainstem lesions cause coma in animals and humans1-8, as the cerebral cortex remains quiescent without ascending brainstem inputs9. Yet despite the known association between brainstem lesions and coma, a circuit-based understanding of coma pathogenesis and mechanisms of recovery is lacking10. A primary reason for this gap in knowledge is the absence of a reliable and robust animal model of brainstem coma. We recently developed a model of coma in the rat with focal injury to the brainstem, which allows investigating the neural mechanisms of coma emergence and recovery11. Resting-state functional MRI (rs-fMRI) experiments along coma recovery demonstrated a gradual increase in functional connectivity between subcortical arousal nuclei in the basal forebrain, thalamus, and basal ganglia and the cerebral cortex. These findings provide evidence for an acute recovery mechanism by which subcortical arousal centers outside the brainstem reactivate the cerebral cortex during acute brainstem coma.Methods
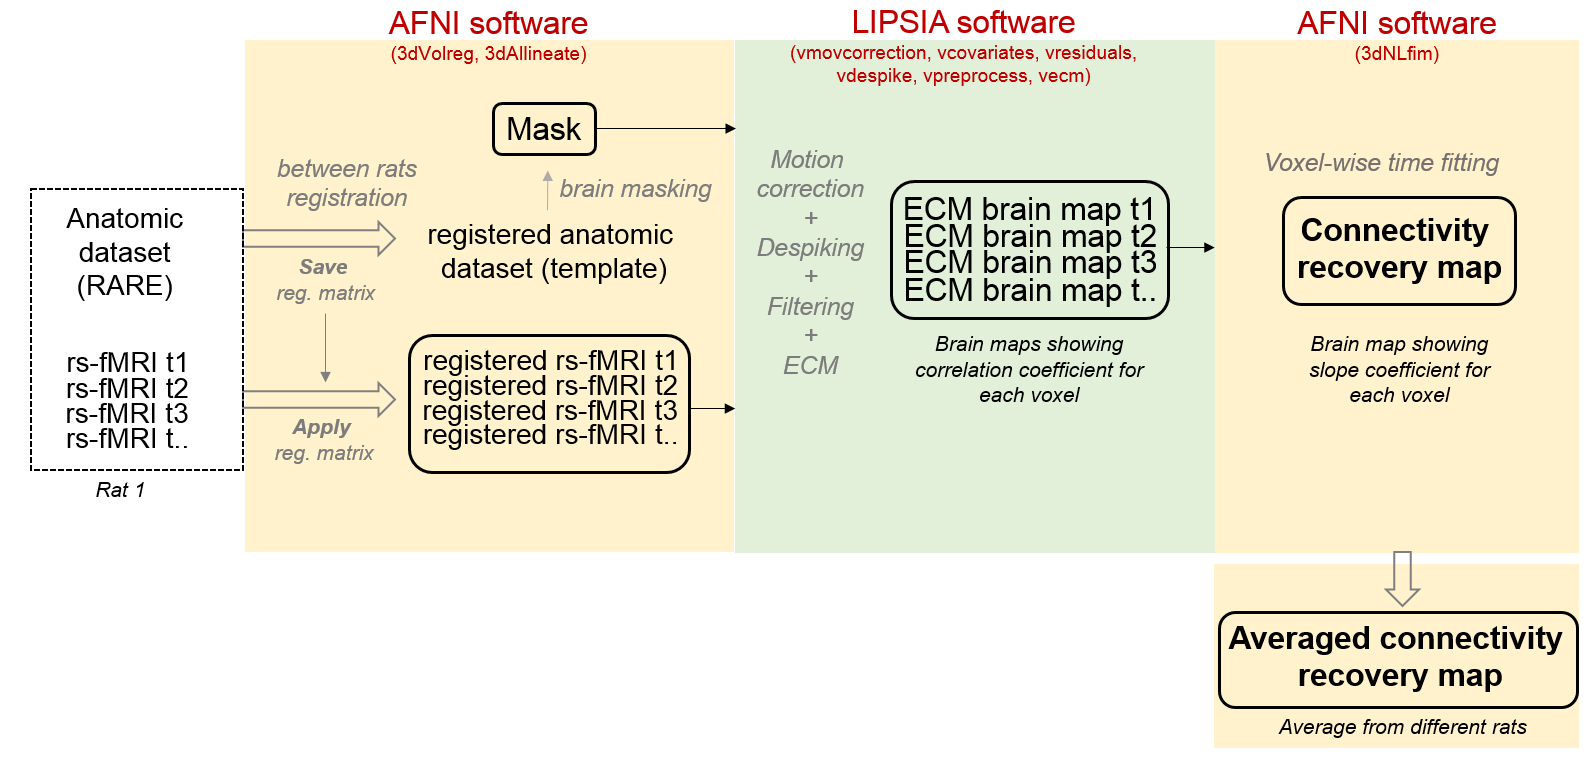
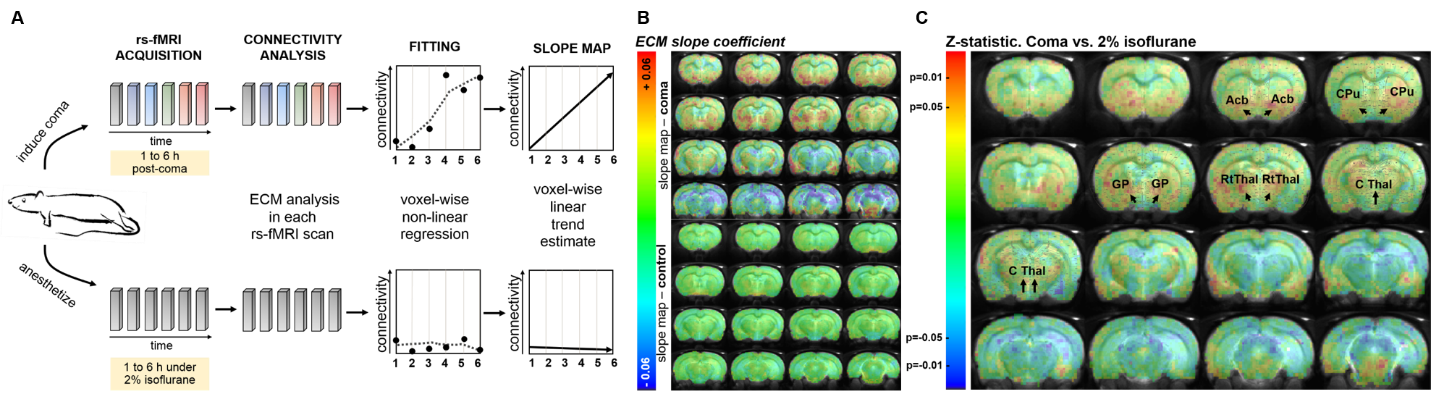
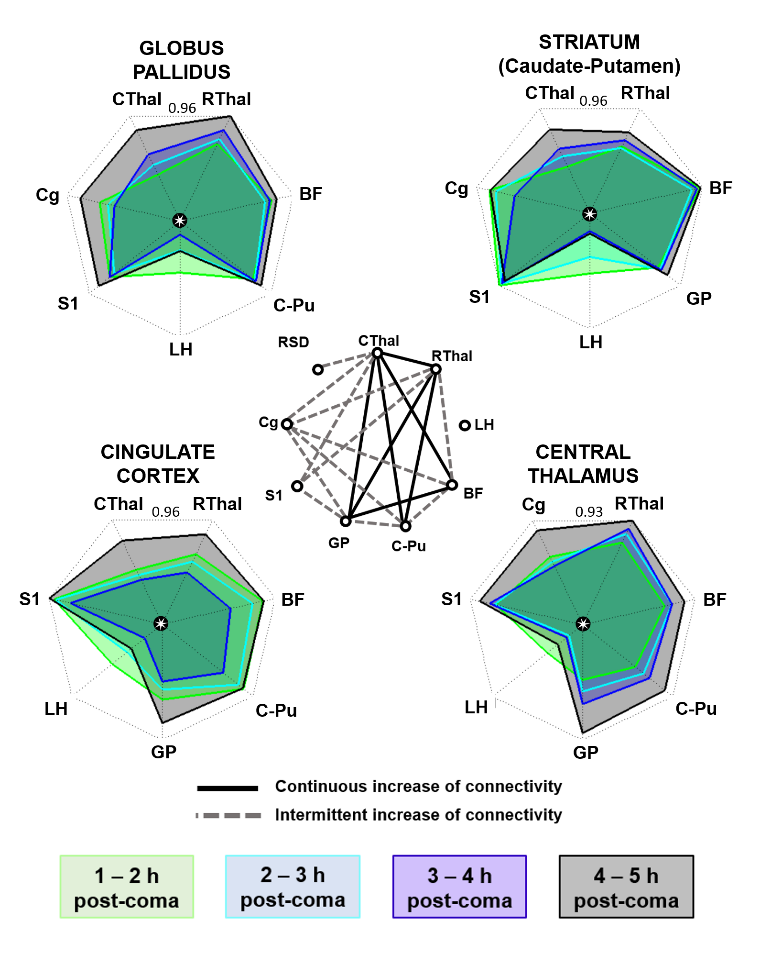
Comatose rats were placed into the MRI scanner within one hour after coma induction (following the rat brainstem coma model11) and rs-fMRI scans were acquired during the first 6 to 8 hours of recovery from coma. A 12 cm bore 14.1 T/26 cm magnet (Magnex, Oxford) interfaced to an Avance III console (Bruker, Ettlingen) was used to run 3D EPI sequences with the following parameters: TE, 12.5 ms; TR, 31.25 ms (total TR, 1s); matrix size, 48x48x32; resolution, 400x400x600 µm (600 µm slice thickness). The fMRI signal was recorded for 925 TRs, resulting in a scan time of 15 min 25 s. Additionally, an anatomic RARE image (TE, 9 ms; TR, 4000 ms; matrix size, 128x128; in-plane resolution, 150 µm; slice thickness, 600 µm; RARE factor, 8) was acquired matching the field of view of the 3D-EPI, for registration purposes. A custom-built trans-receiver surface coil with elliptical shape of ~ 2 x 3 cm minor and major axis, respectively, was used to acquire the (f)MRI images. Pre-processing included co-registration of functional images to an anatomical template, 0.01-0.1 Hz bandpass filtering, despiking and motion correction, performed in AFNI and Lipsia. Analysis of resting state was conducted in two different ways: 1. Whole brain connectivity rank measure: for each rs-fMRI scan, a voxel-wise map of eigenvector values was computed using Lipsia12, indicating the importance of the respective voxel within the network, followed by least squares fit regression at each voxel of the eigenvector values over the temporal succession. This resulted in a certain slope, informative of the increase or decrease in connectivity at a given voxel of the brain (Fig.1&2). 2. Seed-based connectivity analysis: 8 ROIs were chosen from the whole brain slope map to study the specific connection patterns. The time courses of voxels within each ROI were averaged and the Pearson coefficient between regions was calculated using Matlab.Results
Animals demonstrating neurological recovery showed a stronger increase in resting state whole brain functional connectivity from thalamic regions, basal forebrain and basal ganglia, as a function of the post-coma period (Fig.2). Additionally, seed-based analysis during the acute phase of restoration of neurological function revealed a continuous increase in the correlation between seeds in the central and reticular thalamus, striatum, globus pallidus and the nuclei in the basal forebrain over time (Fig.3). Besides, the cingulate cortex showed substantial increases in its connectivity with the thalamus and globus pallidus at 4 hours post-coma (Fig.3).Discussion
The functional characterization of the brain during recovery from coma with fMRI brings new insights into the potential regulations occurring at the higher brain networks that may be underlying recovery of consciousness on its most acute phase. Ongoing studies are being carried out with optogenetics and calcium imaging in parallel to fMRI to further investigate the role of specific brain circuits.Conclusion
The convergent results from whole brain and seed based fMRI analysis of connectivity highly suggest a potential role for the basal forebrain-basal ganglia-thalamocortical network in restoration of consciousness after brainstem injury. This study verifies the applicability of the brainstem coma model to investigate brain dynamics during the acute phase of coma.Acknowledgements
This work was supported by the Max-Planck-Society and the Graduate Training Center of Neuroscience in Tübingen.References
1. Fuller, P. M., Sherman, D., Pedersen, N. P., Saper, C. B. & Lu, J. Reassessment of the structural basis of the ascending arousal system. J Comp Neurol 519, 933-956 (2011).
2. Abulafia, R., Zalkind, V. & Devor, M. Cerebral activity during the anesthesia-like state induced by mesopontine microinjection of pentobarbital. J Neurosci 29, 7053-7064 (2009).
3. Hayes, R. L. et al. Activation of pontine cholinergic sites implicated in unconsciousness following cerebral concussion in the cat. Science 223, 301-303 (1984).
4. Lindsley, D. B., Schreiner, L. H., Knowles, W. B. & Magoun, H. W. Behavioral and EEG changes following chronic brain stem lesions in the cat. Electroencephalogr Clin Neurophysiol 2, 483-498 (1950).
5. Parvizi, J. & Damasio, A. R. Neuroanatomical correlates of brainstem coma. Brain 126, 1524-1536 (2003).
6. Rosenblum, W. I. Immediate, irreversible, posttraumatic coma: a review indicating that bilateral brainstem injury rather than widespread hemispheric damage is essential for its production. J Neuropathol Exp Neurol 74, 198-202 (2015).
7. Edlow, B. L. et al. Disconnection of the ascending arousal system in traumatic coma. J Neuropathol Exp Neurol 72, 505-523 (2013).
8. Fischer, D. B. et al. A human brain network derived from coma-causing brainstem lesions. Neurology 87, 2427-2434 (2016).
9. Laureys, S. et al. Restoration of thalamocortical connectivity after recovery from persistent vegetative state. Lancet 355, 1790-1791 (2000).
10. Schiff, N. D. Recovery of consciousness after brain injury: a mesocircuit hypothesis. Trends Neurosci 33, 1-9 (2010).
11. P.Pais, B.Edlow, J.Stelzer, Y.Jiang, M.Zou and X.Yu. "A rat model of coma pathogenesis ans recovery", abstract in the Society for Neuroscience (2018).
12. Lohmann, G. et al. Eigenvector centrality mapping for analyzing connectivity patterns in fMRI data of the human brain. PLoS One 5, e10232 (2010).
Figures