5538
Individual Resting-State Brain Networks using Multivariate Conditional Mutual Information1Radiology, Martinos Center for Biomedical Imaging, Massachusetts General Hospital, Boston, MA, United States, 2BrainFPV LLC, Boston, MA, United States, 3Electrical Engineering and Telecommunications, University of New South Wales, Sydney, Australia
Synopsis
Current methods of functional brain connectivity from resting-state fMRI data such as linear correlation have limitations, which result in connectivity maps affected by indirect connections and information loss. To address these problems, we propose to use a multivariate conditional mutual information (mvCMI) measure. mvCMI is a multivariate association method, which does not discard information and eliminates indirect connections. We tested mvCMI for single-subject fMRI-connectivity analysis in 10 healthy subjects. mvCMI was able to generate single-subject maps of functional connectivity showing mostly direct connections; mvCMI-based connectivity-maps were more closely related to diffusion-tensor-imaging-based structural connectivity-maps than linear-correlation-based connectivity-maps.
Introduction
Individual-level resting-state networks based on resting-state fMRI (rs-fMRI)1 are of great interest because of existing evidence that they are disrupted in some neurological diseases2,3. Most current rs-fMRI analyses use linear correlation (LC) computed between parcels and result in single-subject connectivity maps affected by indirect connections and information loss. This is because LC is a bivariate association measure and discards the information in the spatial variation of the hemodynamic signal within parcels. Bivariate partial correlation (PaC) has been proposed to rule out indirect connections but results in connectivity maps with poor sensitivity. Therefore, most rs-fMRI analyses are performed at the group-level with a large number of subjects4 and individual-level analysis remains rare because hours of fMRI scans are deemed necessary5,6.
Purpose
(i) To develop a computationally-efficient method that enables single-subject fMRI connectivity analysis based on multivariate conditional mutual information (mvCMI)
(ii) To test mvCMI on 10 single-subject 15-min 3 Tesla rs-fMRI data of the Human Connectome Project (HCP), and compare it to bivariate functional-connectivity methods (LC, PaC) and to diffusion-tensor-imaging (DTI) connectivity maps.
Theory
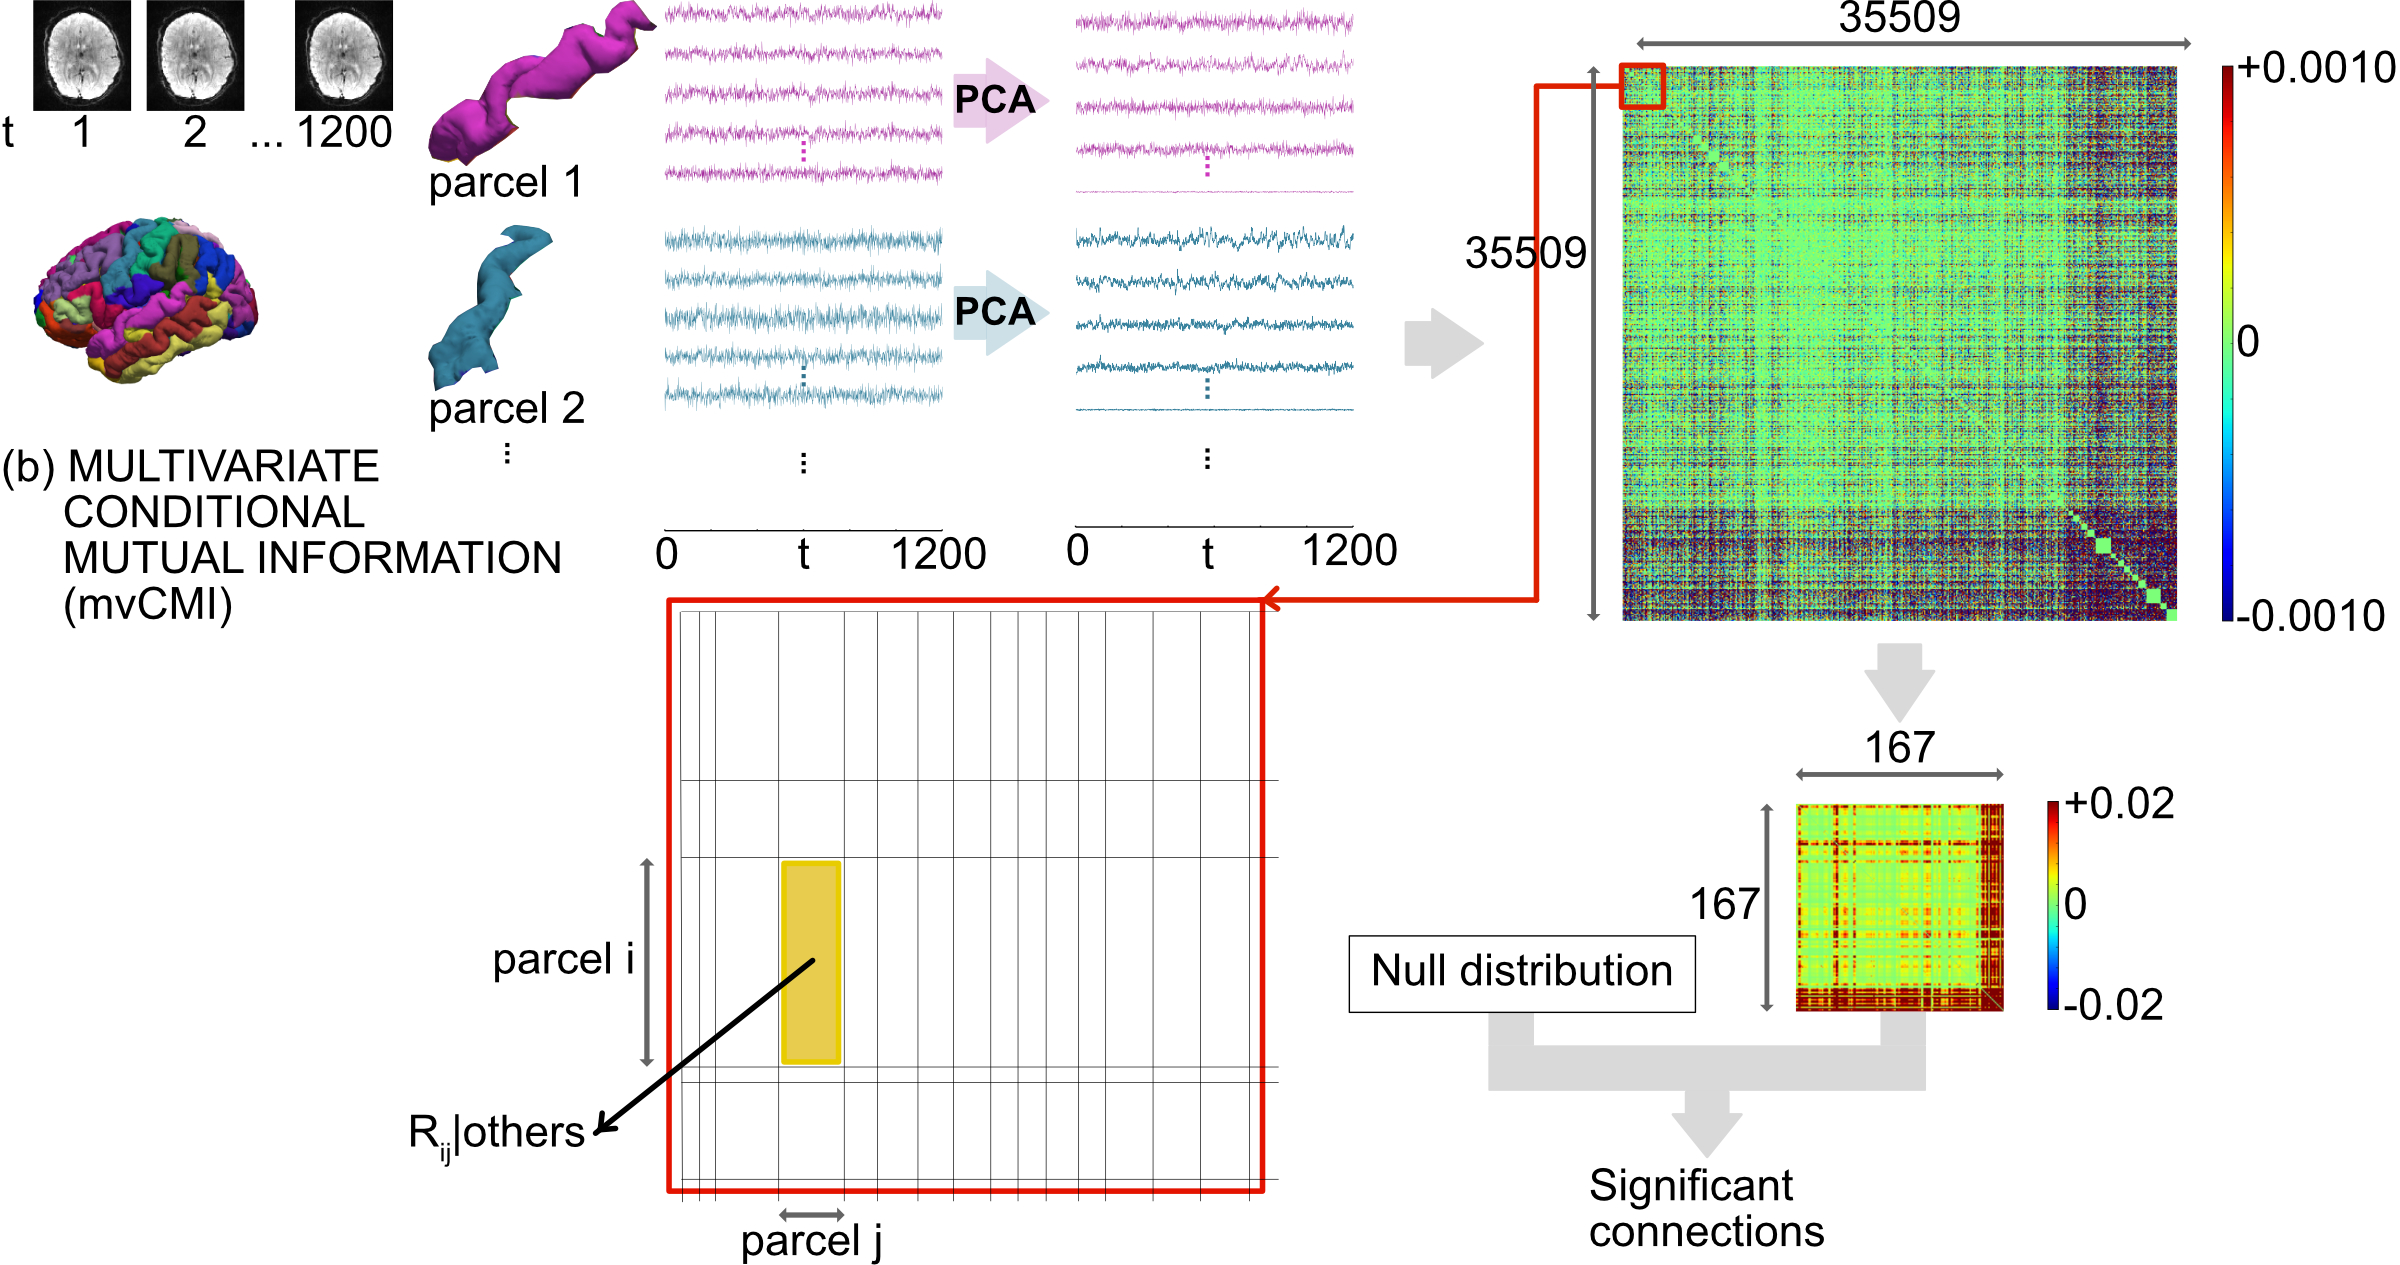
We assume that the fMRI data are multivariate Gaussian7. For jointly Gaussian random variables, all conditional distributions are Gaussian and zero correlation implies independence, i.e., zero partial correlation implies conditional independence. This allowed us to connect mvCMI to multivariate partial correlation. We considered a parcellated brain with p parcels containing fMRI observations. The fMRI data Xi corresponding to parcel i, is a T x di matrix (T = number of fMRI time points and di = number of voxels in parcel i. We assumed that the time series were centered. The parcels were first reduced using probabilistic-PCA to a single representative time course (for LC, PaC) and to multiple component time courses keeping 95% of the spatial variation (for mvCMI). The reduced components for parcel i were denoted as Yi, where Yi is a T x di’ matrix. For a given parcel “a”, y1(a) is the top principal component vector of length T. See Figs. 1, 2 for an overview.
The linear correlation (LCab) between parcels a and b is,
$$LC_{ab} = \rho_{ab} = \frac{\sum{y_{1(a)}y_{1(b)}}}{\sqrt{\sum{y^2_{1(a)}}}\sqrt{\sum{y^2_{1(b)}}}}\ \ (1)$$
The partial correlation (PaCab) between them is the linear correlation between the residuals after regressing out all the other parcels and is,
$$PaC_{ab} = \rho_{ab|W} = \frac{\sum{e_{a|o}e_{b|o}}}{\sqrt{\sum{e^2_{a|o}}}\sqrt{\sum{e^2_{b|o}}}}\ \ (2)$$ where W indicates the other parcels.
The multivariate conditional mutual information (mvCMI) between them involves a block partial correlation matrix Rab|o and is given as, $$mvCMI(a;b|W) = -\frac{1}{2} \ln|I - R_{ab|o} R^T_{ab|o}|\ \ (3)$$
Computation
Filling in the block partial correlation matrix R requires looping over all parcel pairs while regressing out the others. For p parcels, this implies p(p-1)/2 regressions. A straightforward implementation of this equation would make the computation intractable. We solved this challenge using well-known results from partial correlation algebra and extending them to the multivariate case. Our solution allowed us to compute the R matrix using just p regressions rather than p(p-1)/2.Methods
We used the HCP “10 Unrelated Subjects” dataset8 (3T rs-fMRI, 4 m/6 f, age: 22-35 years). The acquisition parameters were: spatial-resolution/slices/time-points/repetition-time/echo-time/flip-angle/simultaneous-multi-slice-factor/ = 2mm-isotropic/72/1200/720ms/33.1ms/52o/8, with four 15-min rs-fMRI runs/subject. We used a modified version of the HCP Preprocessing Pipelines v39 that included: gradient distortion correction, motion correction, EPI distortion correction, and intensity normalization. Data were not normalized to the MNI-305 space, rather they were kept in a subject-specific space. We used FreeSurfer to extract 148 cortical/8 subcortical and 1 brainstem parcels (167 total parcels). The extracted data were further preprocessed to reduce motion artifacts, slow drifts, and physiological artifacts. For all parcel pairs, we computed LC, PaC and mvCMI (Theory Eqns 1-3). Anatomical connectivity was estimated using FSL-based probabilistic tractography. For LC, PaC and mvCMI, we computed empirical null distributions by generating zero-mean, unit-variance white Gaussian noise and then processing the noise identically to the data. For each measure, the process was repeated 50 times. The null distributions were used to determine statistical significance (p < 0.05, Bonferroni corrected).Results
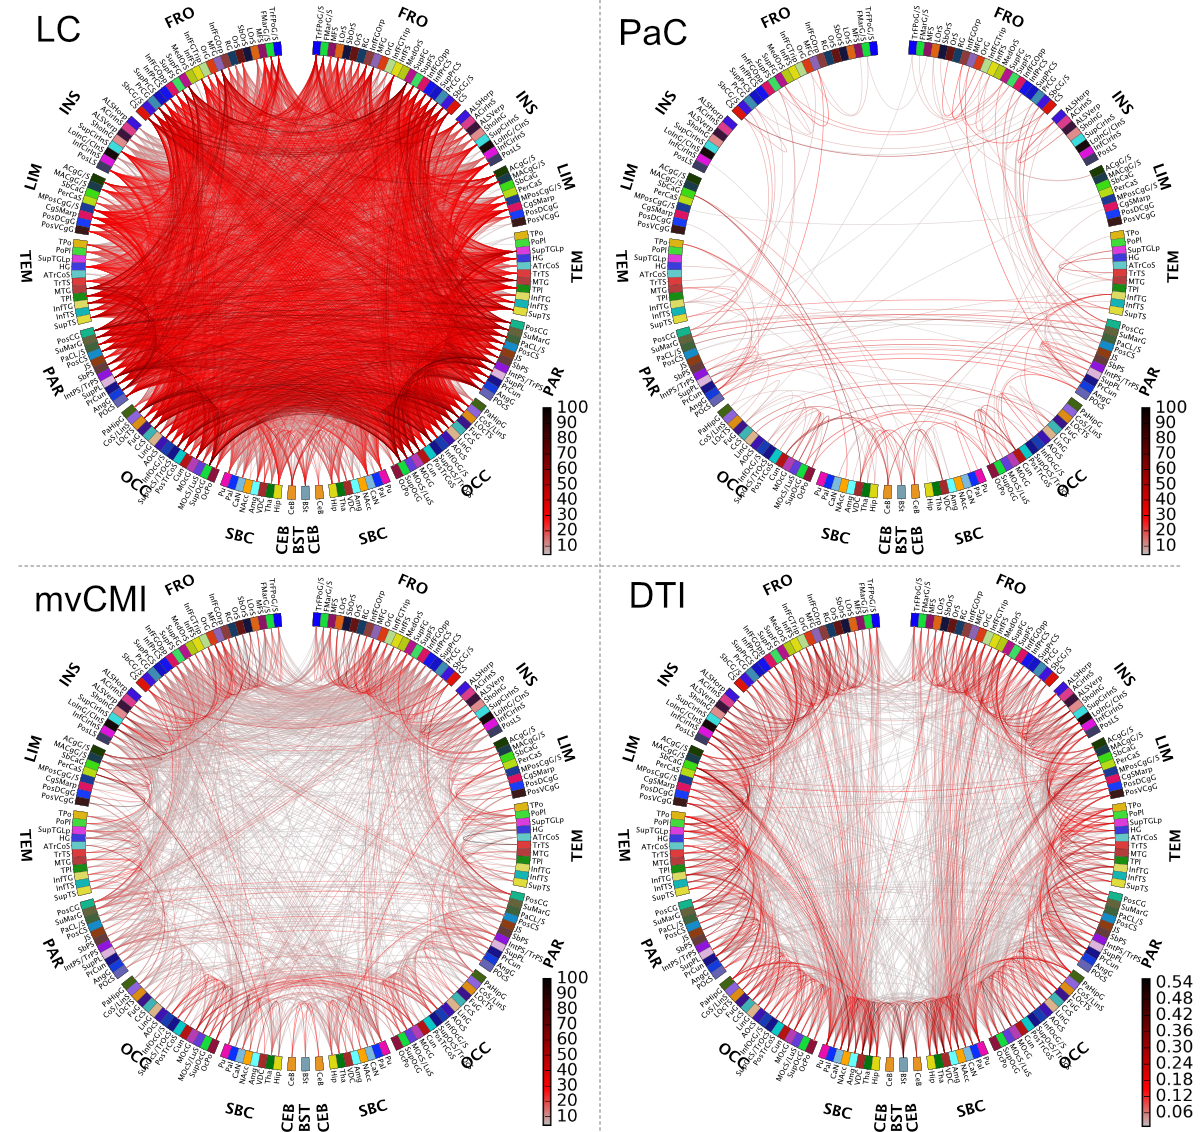
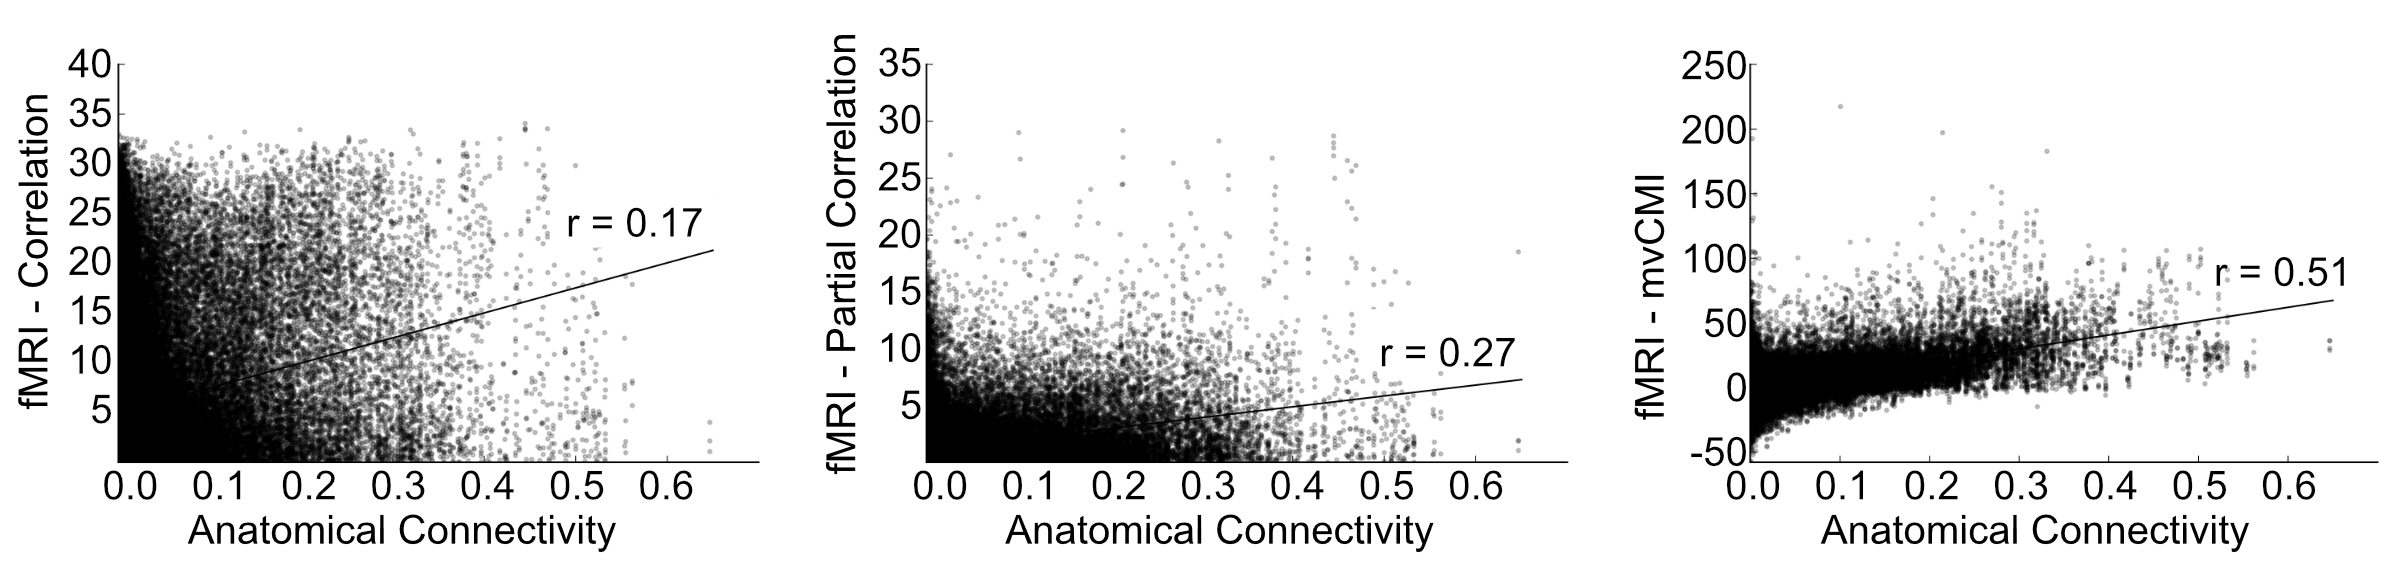
Fig. 3 compares LC, PaC and mvCMI functional connectivity maps to DTI-based structural connectivity maps for the same subject for a single 15-min rs-fMRI run. Our results show that LC was dominated by noise and indirect connections. PaC showed mostly direct connections but had low sensitivity. mvCMI showed mostly direct connections and resembled DTI. Fig. 4 shows a strong association between mvCMI and DTI (r=0.51) compared to LC (r=0.17) and PaC (r=0.27).Conclusion
Individual-level mvCMI networks could be computed from 15-min rs-fMRI scans, and showed mostly direct connections, and a stronger relation to structural DTI-based connectivity than bivariate association-methods. This work demonstrates the feasibility of constructing functional connectivity networks at the individual-level based on the multivariate association-measure mvCMI.Acknowledgements
This work was supported by National Institutes of Health grants: P41EB015896-Rosen, 5R01EB009048-Hamalainen, 5U01MH093765-Rosen, 5R01NS069696-Stufflebeam, 5R01NS060918-Stufflebeam, 1K01EB019474-Bianciardi. High performance computing resources were provided by instrumentation grants 1S10RR023401, 1S10RR019307, 1S10RR023043, the Partners Healthcare System, and the FAS Division of Science, Research Computing Group at Harvard University. Dr. Luessi was partially supported by the Swiss National Science Foundation Early Postdoc Mobility fellowship 148485. Data were provided by the Human Connectome Project, WU-Minn Consortium (Principal Investigators: David Van Essen and Kamil Ugurbil; 1U54MH091657) funded by the 16 NIH Institutes and Centers that support the NIH Blueprint for Neuroscience Research and by the McDonnell Center for Systems Neuroscience at Washington University. We thank Dr Bruce Rosen and Dr Roger Tootel for useful discussions.References
1. Biswal B, Yetkin F, Haughton V, Hyde J. Functional connectivity in the motor cortex of resting human brain using echo-planar MRI. Magnetic Resonance in Medicine, 1995; 34(9):537–541.
2. Greicius M, Flores B, Menon V, et al. Resting-state functional connectivity in major depression: abnormally increased contributions from subgenual cingulate cortex and thalamus. Biological Psychiatry, 2007; 62(5):429–437.
3. Wang L, Zang Y, He Y, et al. Changes in hippocampal connectivity in the early stages of Alzheimer’s disease: evidence from resting state fMRI. Neuroimage, 2006; 31(2):496–504.
4. Yeo T, Krienen F, Sepulcre J, et al. The organization of the human cerebral cortex estimated by intrinsic functional connectivity. Journal of Neurophysiology, 2011; 106(2):1125-1165.
5. Laumann T, Gordon E, Adeyemo B, et al. Functional system and areal organization of a highly sampled individual human brain. Neuron, 2015; 87:657–670.
6. Braga R, Buckner R. Parallel Interdigitated Distributed Networks within the Individual Estimated by Intrinsic Functional Connectivity. Neuron, 2017; 95(2): 457–471.e5.
7. Hlinka J, Palus M, Vejmelka M, et al. Functional connectivity in resting-state fMRI: is linear correlation sufficient? NeuroImage, 2011; 54 (3): 2218–2225.
8. Van Essen D, Ugurbil K, Auerbach E, et al. The Human Connectome Project: A Data Acquisition Perspective. Neuroimage, 2012; 62(4): 2222-2231. 9. Glasser M, Sotiropoulos S, Wilson J, et al. The minimal preprocessing pipelines for the Human Connectome Project. Neuroimage, 2013; 80:105-124.
Figures
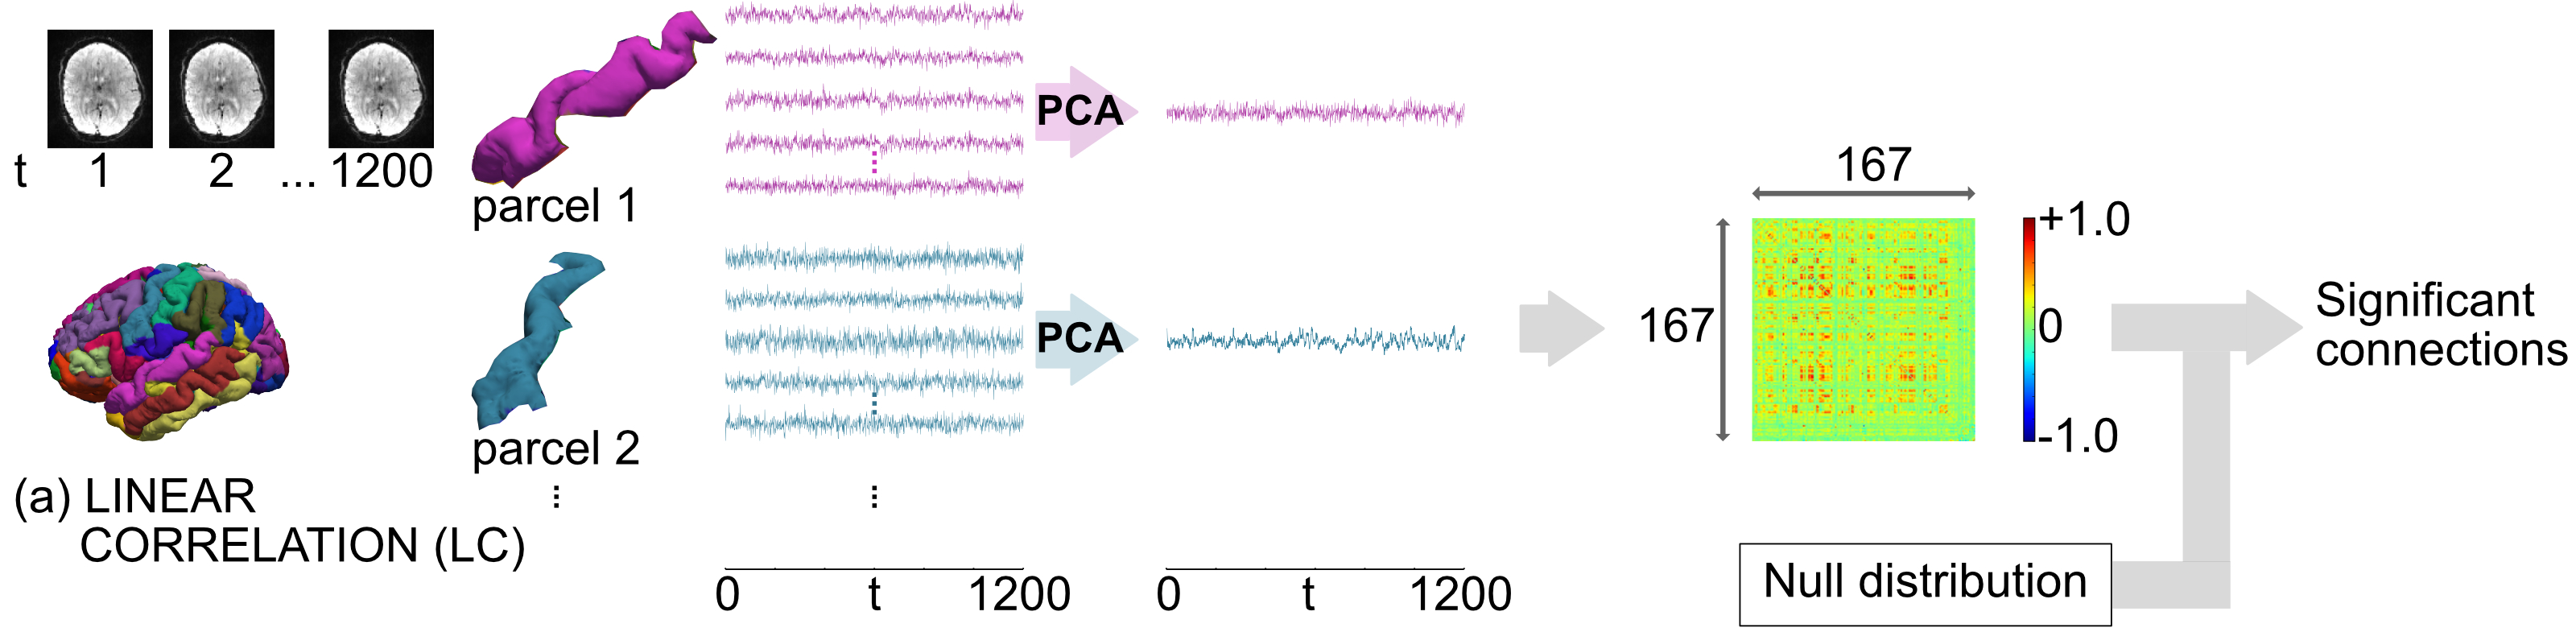
Figure 1. Functional connectivity using linear correlation (LC). We start with a rs-fMRI scan and a 167-node parcellation (left). For LC, we only use the top principal component for each parcel. This results in a 167 x 167 matrix containing the LC for all parcel pairs. The final LC matrix was thresholded using null distributions to retain only the statistically significant connections. Subject 100307, run REST1_LR of the HCP.