5537
Predicting Task Activation from Resting State fMRI: A Comparison of Single Band and Multiband EPI Acquisitions1Radiology, Medical College of Wisconsin, Milwaukee, WI, United States
Synopsis
Recent studies have used resting state functional MRI (rs-fMRI) to predict task activation on an individual basis using a linear-regression machine learning technique. Limited existing studies have used either low-resolution single-band (SB) or high-resolution multiband (MB) data and shown promising results. In this study, SB and MB resting state data were acquired in a group of volunteers to compare their ability to predict motor task activation. Our results showed no significant differences between SB- and MB-based motor task predictions. These findings suggest conventional SB scans might be suitable for making predictions regarding task activation in some clinical settings.
Introduction
Recent studies have shown resting state functional MRI (rs-fMRI) can be used to predict task activation on an individual basis by training a linear-regression based machine learning model1,2. For example, multiband (MB) data from the Human Connectome Project (HCP)3,4 has been used to predict activation stemming from a wide variety of tasks2. In MB imaging, multiple slices are acquired simultaneously to acquire high spatial and temporal resolution data. Another study used clinical conventional single-band (SB) data withlonger TRs and shorter imaging times1. Both of these studies found accurate predictions. Here, SB and MB resting state data were acquired in a group of volunteers and their ability to predict motor task activation was compared.Methods
Fourteen subjects were imaged on a 3T system. Eight subjects returned within two weeks for repeat scans. High-resolution anatomical images (MPRAGE) were collected for co-registration with the functional images.
Each session consisted of two eyes-closed rs-fMRI acquisitions: a MB and SB scan. MB parameters were: TR/TE=802/33.5ms, FOV=208mm, 2mm isotropic resolution, MB acceleration=8, 72 slices, FA=50°, blipped-CAIPI FOV-shift=35, 498 repetitions. SB parameters were: TR/TE=2000/28ms, FOV=224mm, 3.5mm isotropic resolution, 34 slices, FA=90°, 205 repetitions. Following both acquisitions, a one-minute scan was acquired with reversed phase encoding direction. Each subject performed a task consisting of four alternating periods of rest and bilateral finger tapping lasting 40s each. Scans were acquired using a MB, multi-echo simultaneous ASL/BOLD sequence6 with: TR=4.0s, TE=9.1,25,39.6,54.3ms, FOV=240mm, 3mm isotropic resolution, MB acceleration=4, in-plane R=2, 36 slices, FA=90°, blipped-CAIPI FOV-shift=3, pCASL labeling.
Preprocessing for rs-fMRI scans included distortion correction using topup7,8, volume registration, and denoising with FIX9,10. Task-fMRI preprocessing focused on the BOLD signal and included volume registration, echo combination, and denoising using multi-echo independent component analysis (MEICA), which removes non-BOLD signal from the data11-13. A GLM was used to extract task activation. All data were registered to MNI space and smoothed with a 4.5mm FWHM Gaussian kernel.
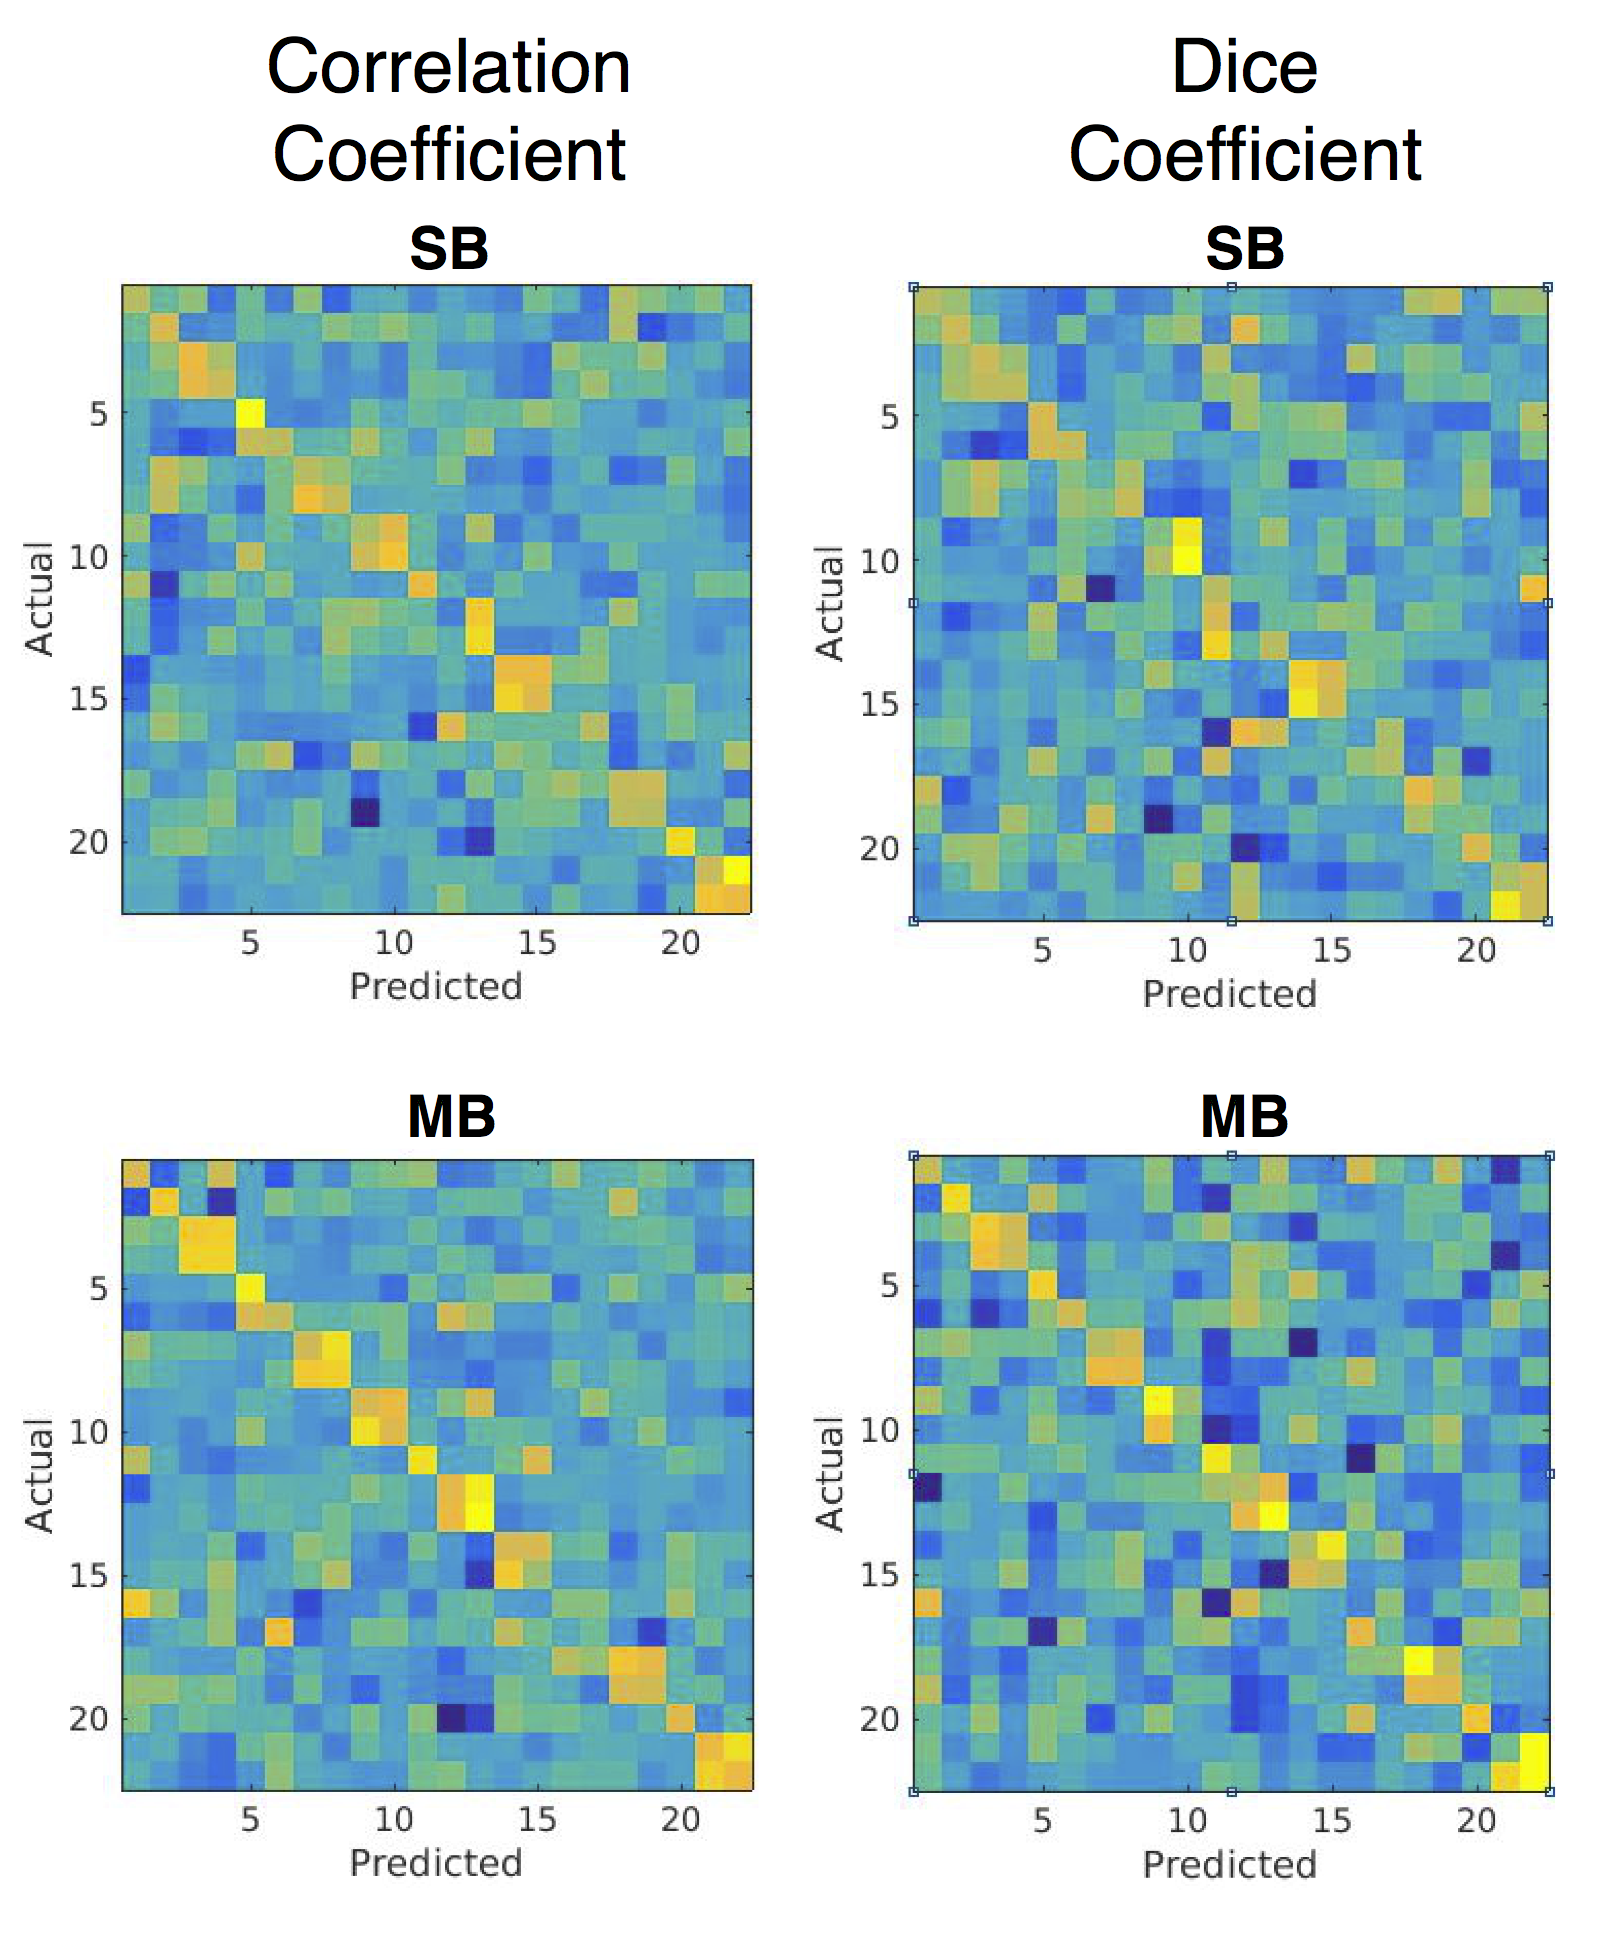
Predictions of subjects’ motor task maps were made using the methods of Parker-Jones et al1. Briefly, the preprocessed resting state timeseries and task activation maps were converted to cifti format. Features were extracted from the rs-fMRI data using a dual-regression analysis on a set of 33 group features derived from 100 HCP subjects1,2, resulting in feature maps for each individual. A linear regression model was trained to map from individual feature maps to task activation. The resulting beta coefficients were averaged with a “leave-one-out” analysis for each subject to create a predicted task activation map. Pearson correlation and dice coefficients (DC) were calculated between each subject’s predicted and all other subjects’ task maps. These matrices were row- and column-normalized and evaluated for diagonality. The repeatability of the predicted activation was analyzed for subjects with multiple scans by calculating the DC between predicted activation at TP1 and TP2.
Results
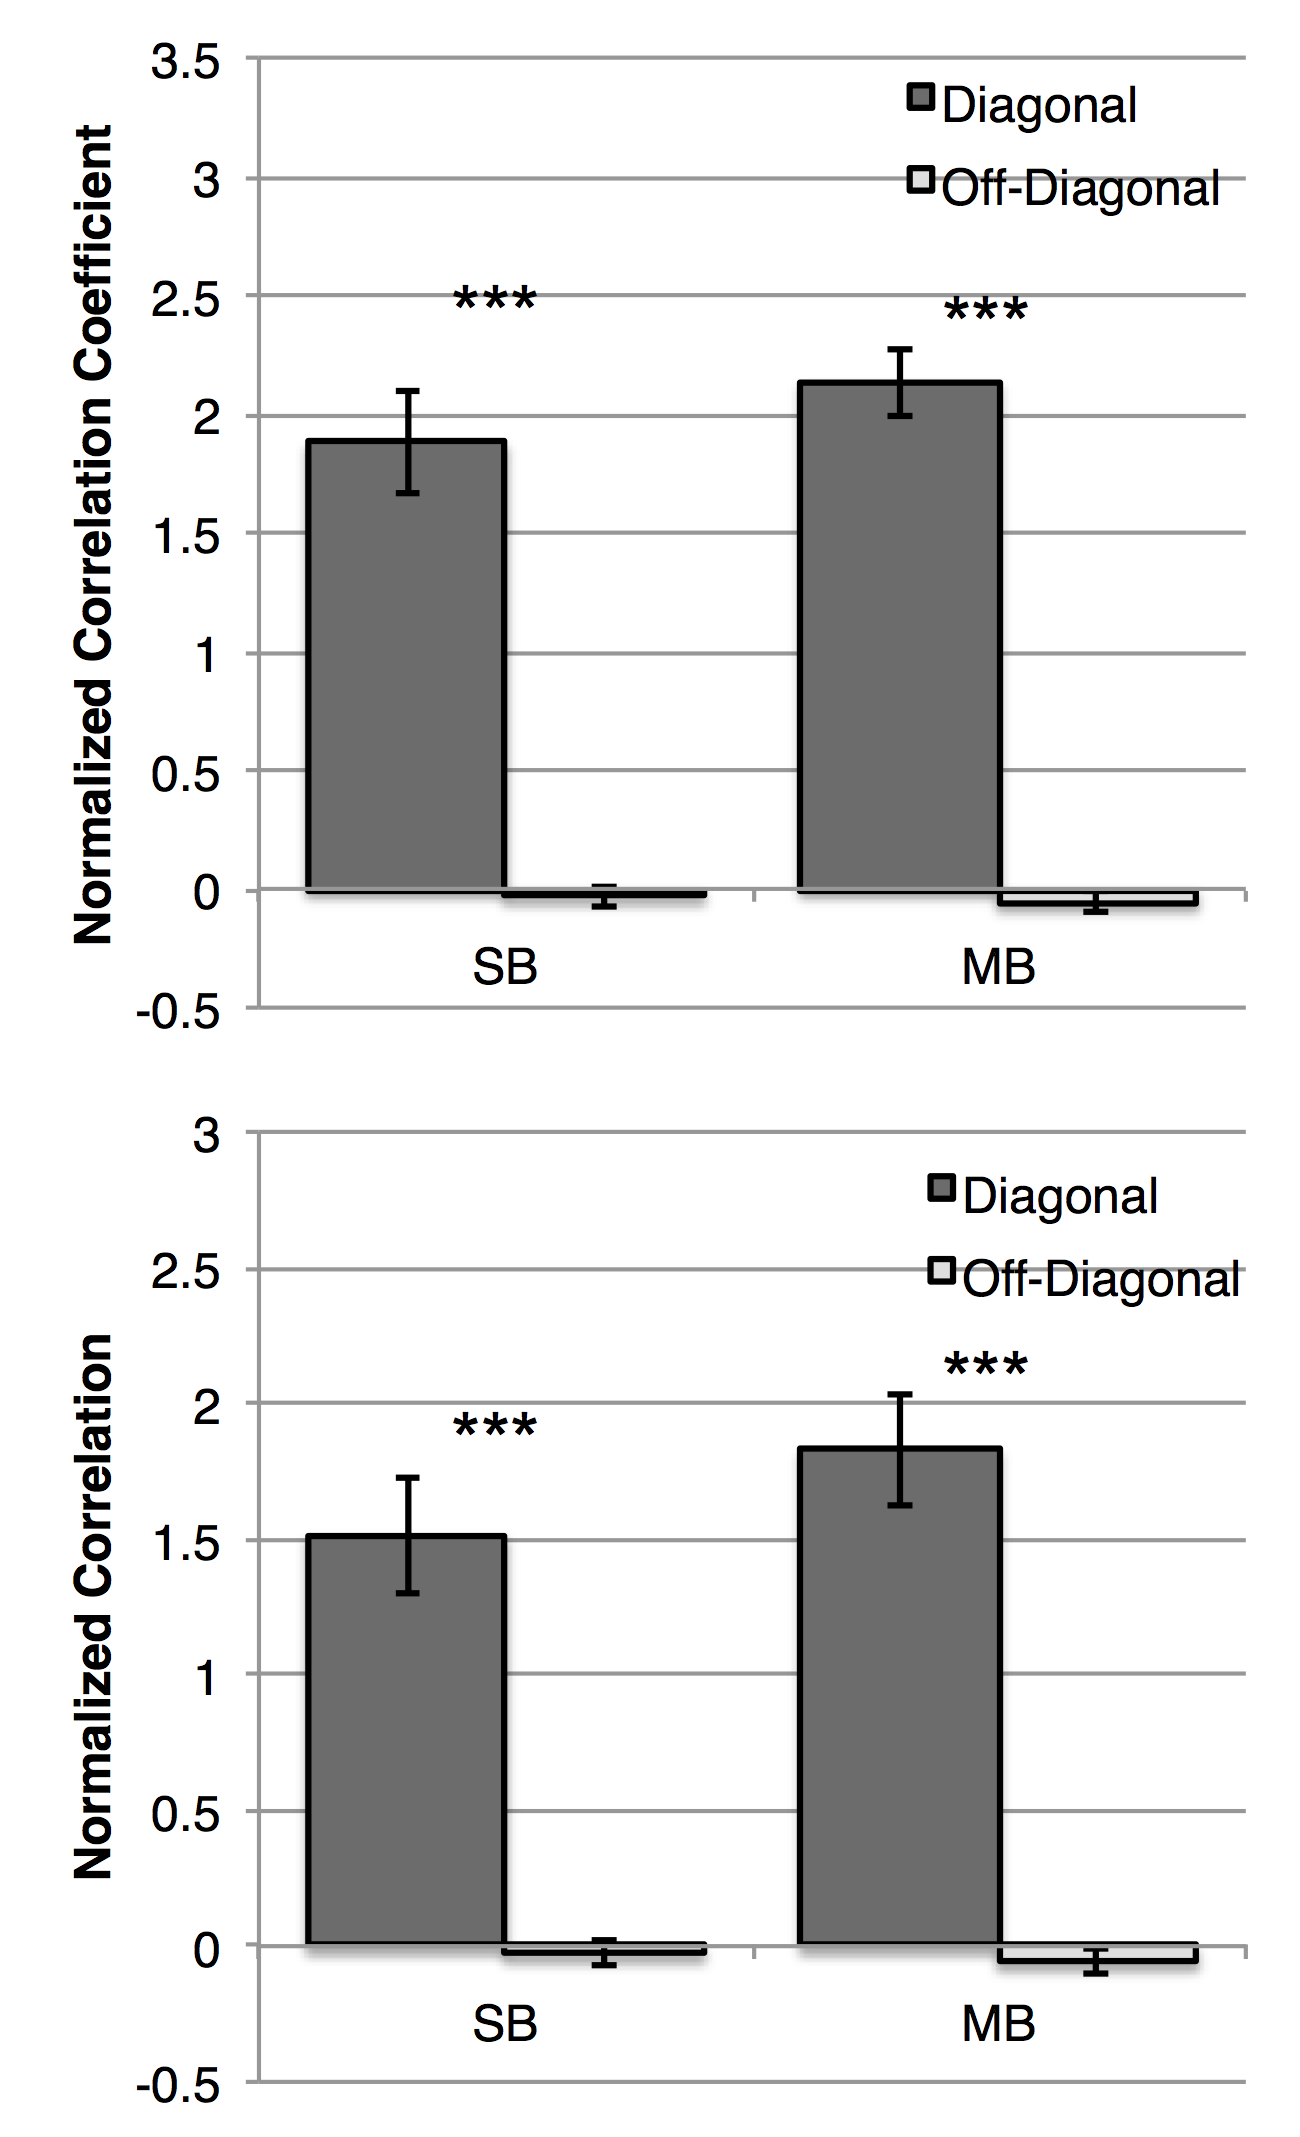
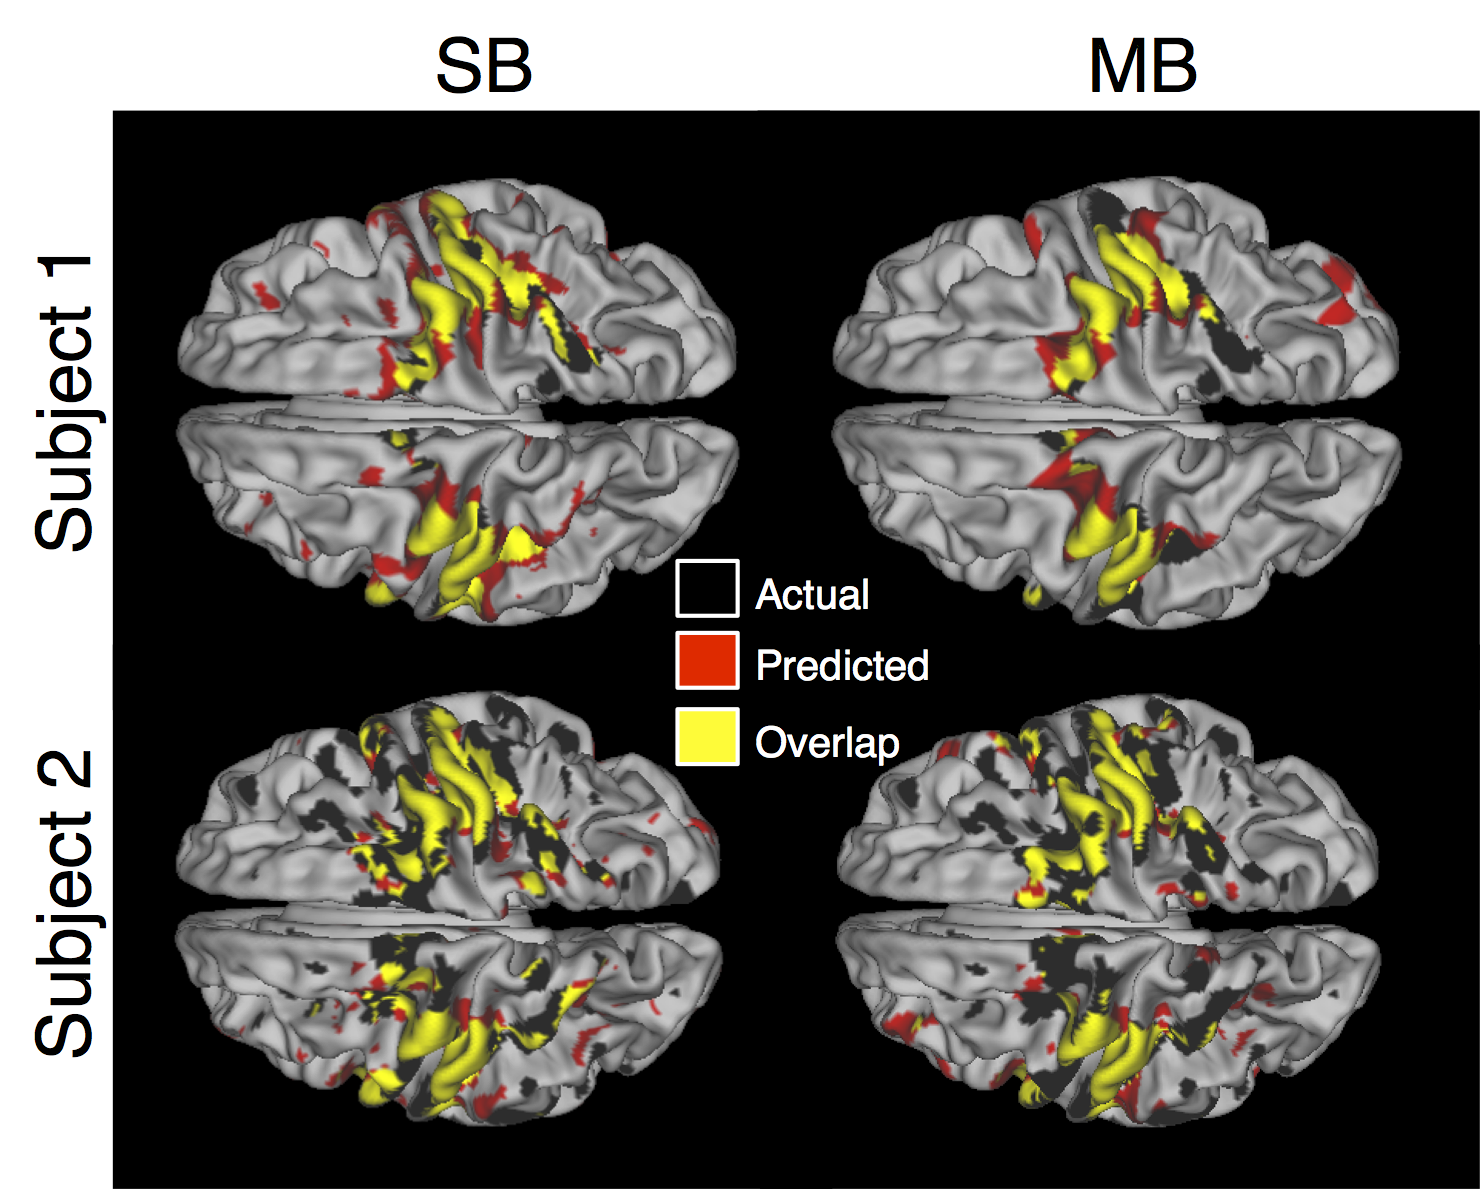
Both the SB and MB resting state datasets were able to accurately predict the motor task activation. This is evidenced by the diagonal component of the correlation and DC matrices (Figure 1) which indicates each subject’s predicted activation map correlates more with their own actual activation map than other subjects’. Qualitatively, not much difference was observed between the datasets. Quantitatively, no significant difference was seen in the mean of the diagonal elements between SB and MB scans. For both datasets the mean of the diagonal elements was significantly higher compared to the off-diagonal elements (Figure 2). Repeatability was high for both scans. MB scans were slightly, but significantly more repeatable compared to SB scans (DC = 0.78+/-0.01 vs. 0.73+/-0.01, P=0.002). Example activation overlap maps are shown in Figure 3.Discussion and Conclusions
This study compared SB and MB resting state scans for predicting task activation. No significant differences in predictability between the two was found and a slight increase in repeatability was seen for the MB scans. Despite increased temporal and spatial resolution, the smaller voxel sizes of the MB scans result in decreased SNR compared to SB acquisitions. These effects may have cancelled each other out. Fourteen subjects were imaged in this study and only eight had repeated scans. More subjects may be able to tease out the nuances between the acquisitions. A MBME ASL/BOLD scan was used to derive the task activations. The collection of four echoes allowed MEICA to be used to denoise the data and remove ASL contamination. This led to robust motor task activation despite the long TR. Our results suggest clinical conventional SB scans may be suitable for making predictions regarding task activation. Future studies could examine the results with a more traditional fMRI approach and with different tasks.Acknowledgements
This work was supported by a Daniel M. Soref Charitable Trust Grant (to Y.W.).References
1. Parker Jones O, Voets NL, Adcock JE, Stacey R, Jbabdi S. Resting connectivity predicts task activation in pre-surgical populations. NeuroImage Clinical 2017;13:378-385.
2. Tavor I, Parker Jones O, Mars RB, Smith SM, Behrens TE, Jbabdi S. Task-free MRI predicts individual differences in brain activity during task performance. Science 2016;352(6282):216-220.
3. Glasser MF, Sotiropoulos SN, Wilson JA, Coalson TS, Fischl B, Andersson JL, Xu J, Jbabdi S, Webster M, Polimeni JR, Van Essen DC, Jenkinson M. The minimal preprocessing pipelines for the Human Connectome Project. NeuroImage 2013;80(0):105-124.
4. Barch DM, Burgess GC, Harms MP, Petersen SE, Schlaggar BL, Corbetta M, Glasser MF, Curtiss S, Dixit S, Feldt C, Nolan D, Bryant E, Hartley T, Footer O, Bjork JM, Poldrack R, Smith S, Johansen-Berg H, Snyder AZ, Van Essen DC, Consortium WU-MH. Function in the human connectome: task-fMRI and individual differences in behavior. NeuroImage 2013;80:169-189.
5. Setsompop K, Gagoski BA, Polimeni JR, Witzel T, Wedeen VJ, Wald LL. Blipped-controlled aliasing in parallel imaging for simultaneous multislice echo planar imaging with reduced g-factor penalty. Magn Reson Med 2012;67(5):1210-1224.
6. Cohen AD, Nencka AS, Wang Y. A Novel Multiband Multi-Echo Simultaneous ASL/BOLD Sequence for Task-Based fMRI. 2017; Honolulu, HI. p 3832.
7. Smith SM, Jenkinson M, Woolrich MW, Beckmann CF, Behrens TE, Johansen-Berg H, Bannister PR, De Luca M, Drobnjak I, Flitney DE, Niazy RK, Saunders J, Vickers J, Zhang Y, De Stefano N, Brady JM, Matthews PM. Advances in functional and structural MR image analysis and implementation as FSL. Neuroimage 2004;23 Suppl 1:S208-219.
8. Andersson JL, Skare S, Ashburner J. How to correct susceptibility distortions in spin-echo echo-planar images: application to diffusion tensor imaging. Neuroimage 2003;20(2):870-888.
9. Griffanti L, Salimi-Khorshidi G, Beckmann CF, Auerbach EJ, Douaud G, Sexton CE, Zsoldos E, Ebmeier KP, Filippini N, Mackay CE, Moeller S, Xu J, Yacoub E, Baselli G, Ugurbil K, Miller KL, Smith SM. ICA-based artefact removal and accelerated fMRI acquisition for improved resting state network imaging. Neuroimage 2014;95:232-247.
10. Salimi-Khorshidi G, Douaud G, Beckmann CF, Glasser MF, Griffanti L, Smith SM. Automatic denoising of functional MRI data: combining independent component analysis and hierarchical fusion of classifiers. Neuroimage 2014;90:449-468.
11. Kundu P, Brenowitz ND, Voon V, Worbe Y, Vertes PE, Inati SJ, Saad ZS, Bandettini PA, Bullmore ET. Integrated strategy for improving functional connectivity mapping using multiecho fMRI. Proc Natl Acad Sci U S A 2013;110(40):16187-16192.
12. Kundu P, Inati SJ, Evans JW, Luh WM, Bandettini PA. Differentiating BOLD and non-BOLD signals in fMRI time series using multi-echo EPI. Neuroimage 2012;60(3):1759-1770.
13. Evans JW, Kundu P, Horovitz SG, Bandettini PA. Separating slow BOLD from non-BOLD baseline drifts using multi-echo fMRI. NeuroImage 2015;105:189-197.
Figures