5536
In-variance causality: a novel layer of information in directed connectivity1Department of Biomedicine and Prevention, University of Rome "Tor Vergata", Roma, Italy, 2Department of Clinical Neurosciences, University of Cambridge, Cambridge, United Kingdom, 3Istituto di Bioimmagini e Fisiologia Molecolare, Consiglio Nazionale delle Ricerche, Milano, Italy, 4Athinoula A. Martinos Center for Biomedical Imaging, Massachusetts General Hospital and Harvard Medical School, Boston, MA, United States
Synopsis
Multivariate Granger Causality (MVGC) approaches have recently been employed to estimate the directionality of brain connectivity. While BOLD fluctuations also contain information about neurovascular coupling, so far all MVGC estimation frameworks have focused on central tendencies, hence disregarding directed coupling between volatilities (i.e. in-variance causality). In this paper, we develop a framework for simultaneous estimation of both in-mean and in-variance causality in complex networks. We validate our approach using synthetic data from complex ensembles of coupled nonlinear oscillators, and successively employ HCP data to provide the very first estimate of the in-variance connectome of the human brain.
Introduction
Granger Causality (GC) approaches have recently been employed to estimate the directionality of the influence exerted by a brain region on another. Despite fluctuations the BOLD signal at rest contain important information about the physiological processes that underlie neurovascular coupling, so far associations between brain signals have focused on central tendencies (i.e. mean or median) and have modeled this compounded variability as noise. A possible causative structure in the variability of brain activity remains completely unexplored. The idea of in-variance causality therefore provides a tool to explore and dissect additional, directed associations in the joint volatility (i.e. not in the mean) of signals produced by high-density complex networks. In this contribution, we develop a framework for simultaneous estimation of both in-mean and in-variance causality in complex networks. We validate our approach in synthetically-generated signal from complex networks of coupled nonlinear oscillators and employ it on fMRI data provided by the HCP to deliver the very first estimate of the in-variance human connectome.
Theory
Moving average and moving variance
To obtain dynamic estimators for both the mean and the variance of a nonstationary signal, we employ the exponentially weighted moving average (EWMA) technique$$$~$$$[1] and its variance counterpart, i.e. the exponentially weighted moving variance (EWMV)$$$~$$$[2]:$$\begin{align}a_k&=\lambda_a\,x_k+(1-\lambda_a)x_{k-1}\tag*{(EWMA)}\\\sigma_k&=\lambda_\sigma{(x_k-a_k)}^2+(1-\lambda_\sigma)\sigma_{k-1}\tag*{(EWMV)}\end{align}$$Both models stem from econometrics theory and are akin to a tapered sliding-window in which past observations are weighted with exponentially declining functions. The parameters $$$\lambda_a$$$, $$$\lambda_\sigma$$$ determine the dependence of the estimates on the most recent time points.
Multivariate Granger causality
In brief, a dynamical system is said to Granger-cause another if information from the past of the former allows better prediction of the future of the latter$$$~$$$[3]. The influence of $$$x_j$$$ on $$$x_i$$$ while "conditioning" to every other variable is measured by $$\text{log}{\left(\frac{{D}_{i,i}}{{D}’_{i,i}}\right)}$$where $$$D$$$ and $$$D’$$$ are the covariances of the residuals of two separate VAR models, (commonly termed 'restricted' and 'unrestricted'):$$\begin{align}(\mathbf{x}|j)_t-\mathbf{A}L^P(\mathbf{x}|j)_{t-1}&=\mathbf{\epsilon}\tag*{(restricted$$$~$$$model)}\\\mathbf{x}_t-\mathbf{A}L^P\mathbf{x}_{t-1}&=\mathbf{\epsilon’}\tag*{(unrestricted$$$~$$$model)}\end{align}$$where $$$L^P(\mathbf{x})_{t-1}$$$ is the lag-operator, $$$A$$$ and $$$A’$$$ are matrices of coefficients.In this contribution, we employ multivariate Granger Causality (MVGC) to investigate interactions between the EWMA and EWMV estimates.
Methods
In-silico validation
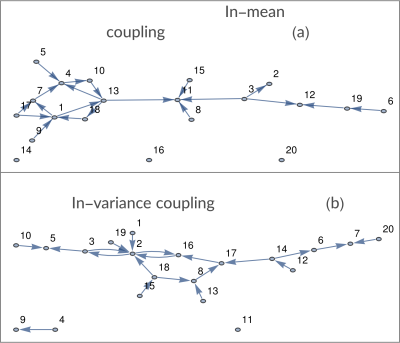
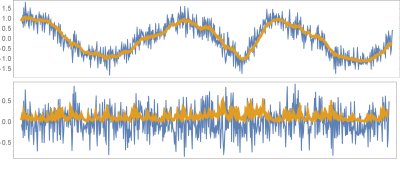
We employ synthetically generated Kuramoto oscillators (notorious for exhibiting synchronization and chaos) with added time-varying dynamical noise generated through a GARCH process:$$\frac{d}{d\theta_i}=\omega_i+\sum_j{A_{i,j}\sin(\theta_j-\theta_i)}$$where $$$A_{i,j}$$$ is an adjacency matrix effectively defining in-mean coupling. The readout $$$x_i$$$ of each oscillator is the projection of the angle variable $$$\theta_i$$$ on one axis added by a noise term realized through an ad-hoc defined multivariate GARCH model [4]:$$\begin{align}x_i(t)&=\sin(\theta_i )+\varepsilon_i\\\sigma^2_{(i,t)}&=k_i+\sum_l\sum_{(j=1)}^qC_{(i,l,j)}\varepsilon^2_{(l,t-j)}+\sum_l\sum_{(j=1)}^pB_{(i,l,j)}\sigma^2_{(i,t-j)}\end{align}$$ where $$$B_{i,l,j}$$$ are proportional to the adjacency matrix effectively defining in-variance coupling up until $$$p$$$ data points into the past, and $$$C_{i,l,j}$$$ define possible coupling between innovations. Figure 1 shows an example of network; Figure 2 shows an example of a signal realization. For every pair of nodes, we evaluated both in-mean and in-variance MVGC strengths. Performance was quantified as the area under the receiver Operating Characteristic (ROC) curve (AUC), computed by varying the acceptance threshold on causality strength.
Resting state fMRI
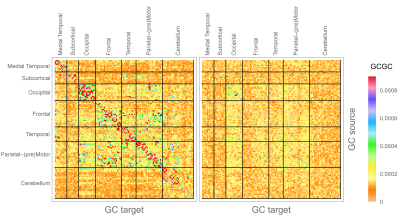
We use in-vivo fMRI data from 100 unrelated subjects made available by the HCP[5-6]. After pre-processing the average BOLD signal was extracted in 116 regions of interest (ROIs) using the Automated Anatomical Labeling atlas [7]. We then evaluated the EWMA and the EWMV ($$$\lambda_a=0.6,\,\lambda\sigma=0.1$$$, optimized based on partial autocorrelation) of each ROI-averaged BOLD signal, and evaluated in-mean and in-variance MVGC strength for the network of 116 signals and associated variances, obtaining two 116x166 non-symmetric inter-subject median matrices of MVGC strength. We then retained only the connections corresponding to the top 1% in MVGC strength.
Results
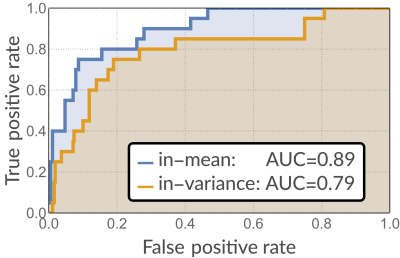
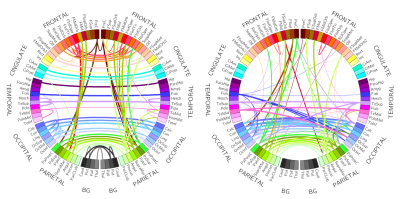
Figure$$$~$$$3 shows ROC curves obtained for both in-mean and in-variance causal network reconstruction in synthetic validation. Applying the framework to in-vivo data, in-mean and in-variance causal connectomes emerge (Figure$$$~$$$4 shows in-mean and in-variance MVGC matrices). Figure$$$~$$$5$$$~$$$shows circular plots highlighting the top$$$~$$$1% connections belonging to the matrices derived from HCP data.
Discussion
In this paper we have proposed a framework for reconstructing the causal coupling structure of complex, directed networks which exhibit both in-mean and in-variance coupling. We validated our framework in networks of nonlinear coupled Kuramoto oscillators with added GARCH noise, obtaining high AUC values for both in-mean and in-variance causality estimation. The application of our framework to in-vivo fMRI data from a large number of subject generates an in-mean connectome which is compatible with current knowledge about brain connectivity (e.g. confirming the strong interaction between salience and default mode networks) while, at the same time, providing an additional layer of information which reveals (for example) additional information exchange in the opposite direction which retains physiological plausibility.
Conclusions
Our results serve as proof of principle for demonstrating the relevance of targeted experimental investigation about the origin of coupled fluctuations in variance in BOLD signals measured using fMRI.Acknowledgements
No acknowledgement found.References
[1] S. W. Roberts, "Control chart tests based on geometric moving averages," Technometrics, vol. 42, pp. 97-101, Feb 2000.
[2] J. F. Macgregor and T. J. Harris, "The Exponentially Weighted Moving Variance," Journal of Quality Technology, vol. 25, pp. 106-118, Apr 1993.
[3] L. Barnett and A. K. Seth, "The MVGC multivariate Granger causality toolbox: a new approach to Granger-causal inference," J Neurosci Methods, vol. 223, pp. 50-68, Feb 15 2014.
[4] T. Bollerslev, "Generalized autoregressive conditional heteroskedasticity," Journal of Econometrics, vol. 31, pp. A307-A327, Jan 1986.
[5] D. C. Van Essen, S. M. Smith, D. M. Barch, T. E. J. Behrens, E. Yacoub, K. Ugurbil, et al., "The WU-Minn Human Connectome Project: An overview," Neuroimage, vol. 80, pp. 62-79, Oct 15 2013.
[6] S. M. Smith, C. F. Beckmann, J. Andersson, E. J. Auerbach, J. Bijsterbosch, G. Douaud, et al., "Resting-state fMRI in the Human Connectome Project," Neuroimage, vol. 80, pp. 144-168, Oct 15 2013.
[7] N. Tzourio-Mazoyer, B. Landeau, D. Papathanassiou, F. Crivello, O. Etard, N. Delcroix, et al., "Automated anatomical labeling of activations in SPM using a macroscopic anatomical parcellation of the MNI MRI single-subject brain," Neuroimage, vol. 15, pp. 273-289, Jan 2002.
Figures
