5535
From neurons to BOLD connectivity: a validation study1Department of Biomedicine and Prevention, University of Rome "Tor Vergata", Roma, Italy, 2Department of Clinical Neurosciences, University of Cambridge, Cambridge, United Kingdom, 3Istituto di Bioimmagini e Fisiologia Molecolare, Consiglio Nazionale delle Ricerche, Milano, Italy, 4Department of Information Engineering, University of Pisa, Pisa, Italy, 5Department of Electronics, Informatics and Bioengineering, Politecnico di Milano, Milano, Italy, 6Department of Anesthesia, Massachusetts General Hospital, Boston, MA, United States, 7Athinoula A. Martinos Center for Biomedical Imaging, Massachusetts General Hospital and Harvard Medical School, Boston, MA, United States
Synopsis
The use of Multivariate Granger Causality (MVGC) in estimating directed BOLD connectivity is still controversial. We employ realistic complex network models based on Izhikevich neuronal populations interlinked by realistic neuronal fiber bundles which exert compounded directed influences and cascade into Baloon-model-like neurovascular coupling. We show in silico that the top 1 percentile of a BOLD connectivity matrix has a Positive Predictive Value very close to 1, and demonstrate in HCP data that functional interactions between parietal and prefrontal cortices are not symmetrical, but consists of directional connectivity from parietal areas to prefrontal cortices rather than vice versa.
Introduction
The use of Multivariate Granger Causality (MVGC) in estimating directed BOLD connectivity is still controversial, mostly because of the intrinsic low temporal resolution of BOLD data and the slow haemodynamic response of the neurovascular coupling. In this contribution we test the performance of MVGC on the synthetically generated BOLD data from realistic complex network models based on Izhikevich neuronal populations interlinked by realistic neuronal fiber bundles which exert compounded directed influences and cascade into Baloon-model-like neurovascular coupling. Characterizing MVGC detection performances in silico allow us to understand the confidence of the results when applying MVGC in vivo.Theory and Methods
Granger causality
A dynamical system is said to Granger-cause another if information from the past of the former allows better prediction of the future of the latter$$$~$$$[1]. Influence of $$$x_j$$$ on $$$x_i$$$ while "conditioning" to every other variable is measured by $$\text{log}{\left(\frac{{D}_{i,i}}{{D}’_{i,i}}\right)}$$where $$$D$$$ and $$$D’$$$ are the covariances of the residuals of two separate VAR models, (commonly termed 'restricted' and 'unrestricted'):$$\begin{align}(\mathbf{x}|j)_t-\mathbf{A}L^P(\mathbf{x}|j)_{t-1}&=\mathbf{\epsilon}\tag*{(restricted$$$~$$$model)}\\\mathbf{x}_t-\mathbf{A}L^P\mathbf{x}_{t-1}&=\mathbf{\epsilon’}\tag*{(unrestricted$$$~$$$model)}\end{align}$$where $$$L^P(\mathbf{x})_{t-1}$$$ is the lag-operator, $$$A$$$ and $$$A’$$$ are matrices of coefficients.
Synthetic data simulations
In order to compare the performance of MVGC in detecting true causal connections within complex directed networks, we performed large synthetic data simulation by generating realistic BOLD data from a family of 20-node networks. Each node represents a small cortical volume, equipped with its own simulated locally coupled neuronal dynamics, and are also connected through simulated synaptic dynamics (inter-node coupling). The read out variable of every node is a synthetic BOLD signal derived from a physiological inspired model. Figure 1 is a graphical summary of the simulation framework. On Figure 2 some of the simulated networks are shown. At each density we compute the area under the receiver Operating Characteristic (ROC) curve (AUC), and positive predictive value (PPV) for top 1% connections.
Directed Connectome of the Human Brain
MVGC was assesed on in-vivo fMRI data from 100 unrelated subjects made available by the HCP [2-3]. After pre-processing the average BOLD signal was extracted in 116 regions of interest (ROIs) using the Automated Anatomical Labeling atlas [4]. We then evaluated MVGC between every couple of ROI-averaged BOLD signals, obtaining a 116x166 non-symmetric inter-subject median matrix of GCGC strength $$$G$$$. We then retained only the connections corresponding to the top 1% in MVGC strength. Additionally, in order to explicitly explore the direction of causality within $$$G$$$, we defined the normalized causality ``flow'' $$$F$$$ as the antisymmetrical part of $$$G$$$ rescaled by the symmetrical part of $$$G$$$, i.e. $$$F_{i,j}={(G-G^\text{T})}_{i,j}/{(G+G^\text{T})}_{i,j}$$$. The normalized causality ``flow'' $$$F$$$ summarizes the prevailing direction of causality, net of changes in overall causality strength.
Results
Synthetic networks
Figure 3 summarises the main results of MVGC in synthetic networks in terms of detection AUC and top 1% PPV performance. At each network density, the median and the quartiles across all 10 realizations of all 32 networks are depicted for AUC and the PPV of the strongest 1% detected links.
In-vivo causal connectome of the human brain
Figure 4 shows the elements of the inter-subject median MVGC matrix between the 116 ROIs extracted from the AAL atlas and the inter-subject median of normalized causality flow $$$F$$$.
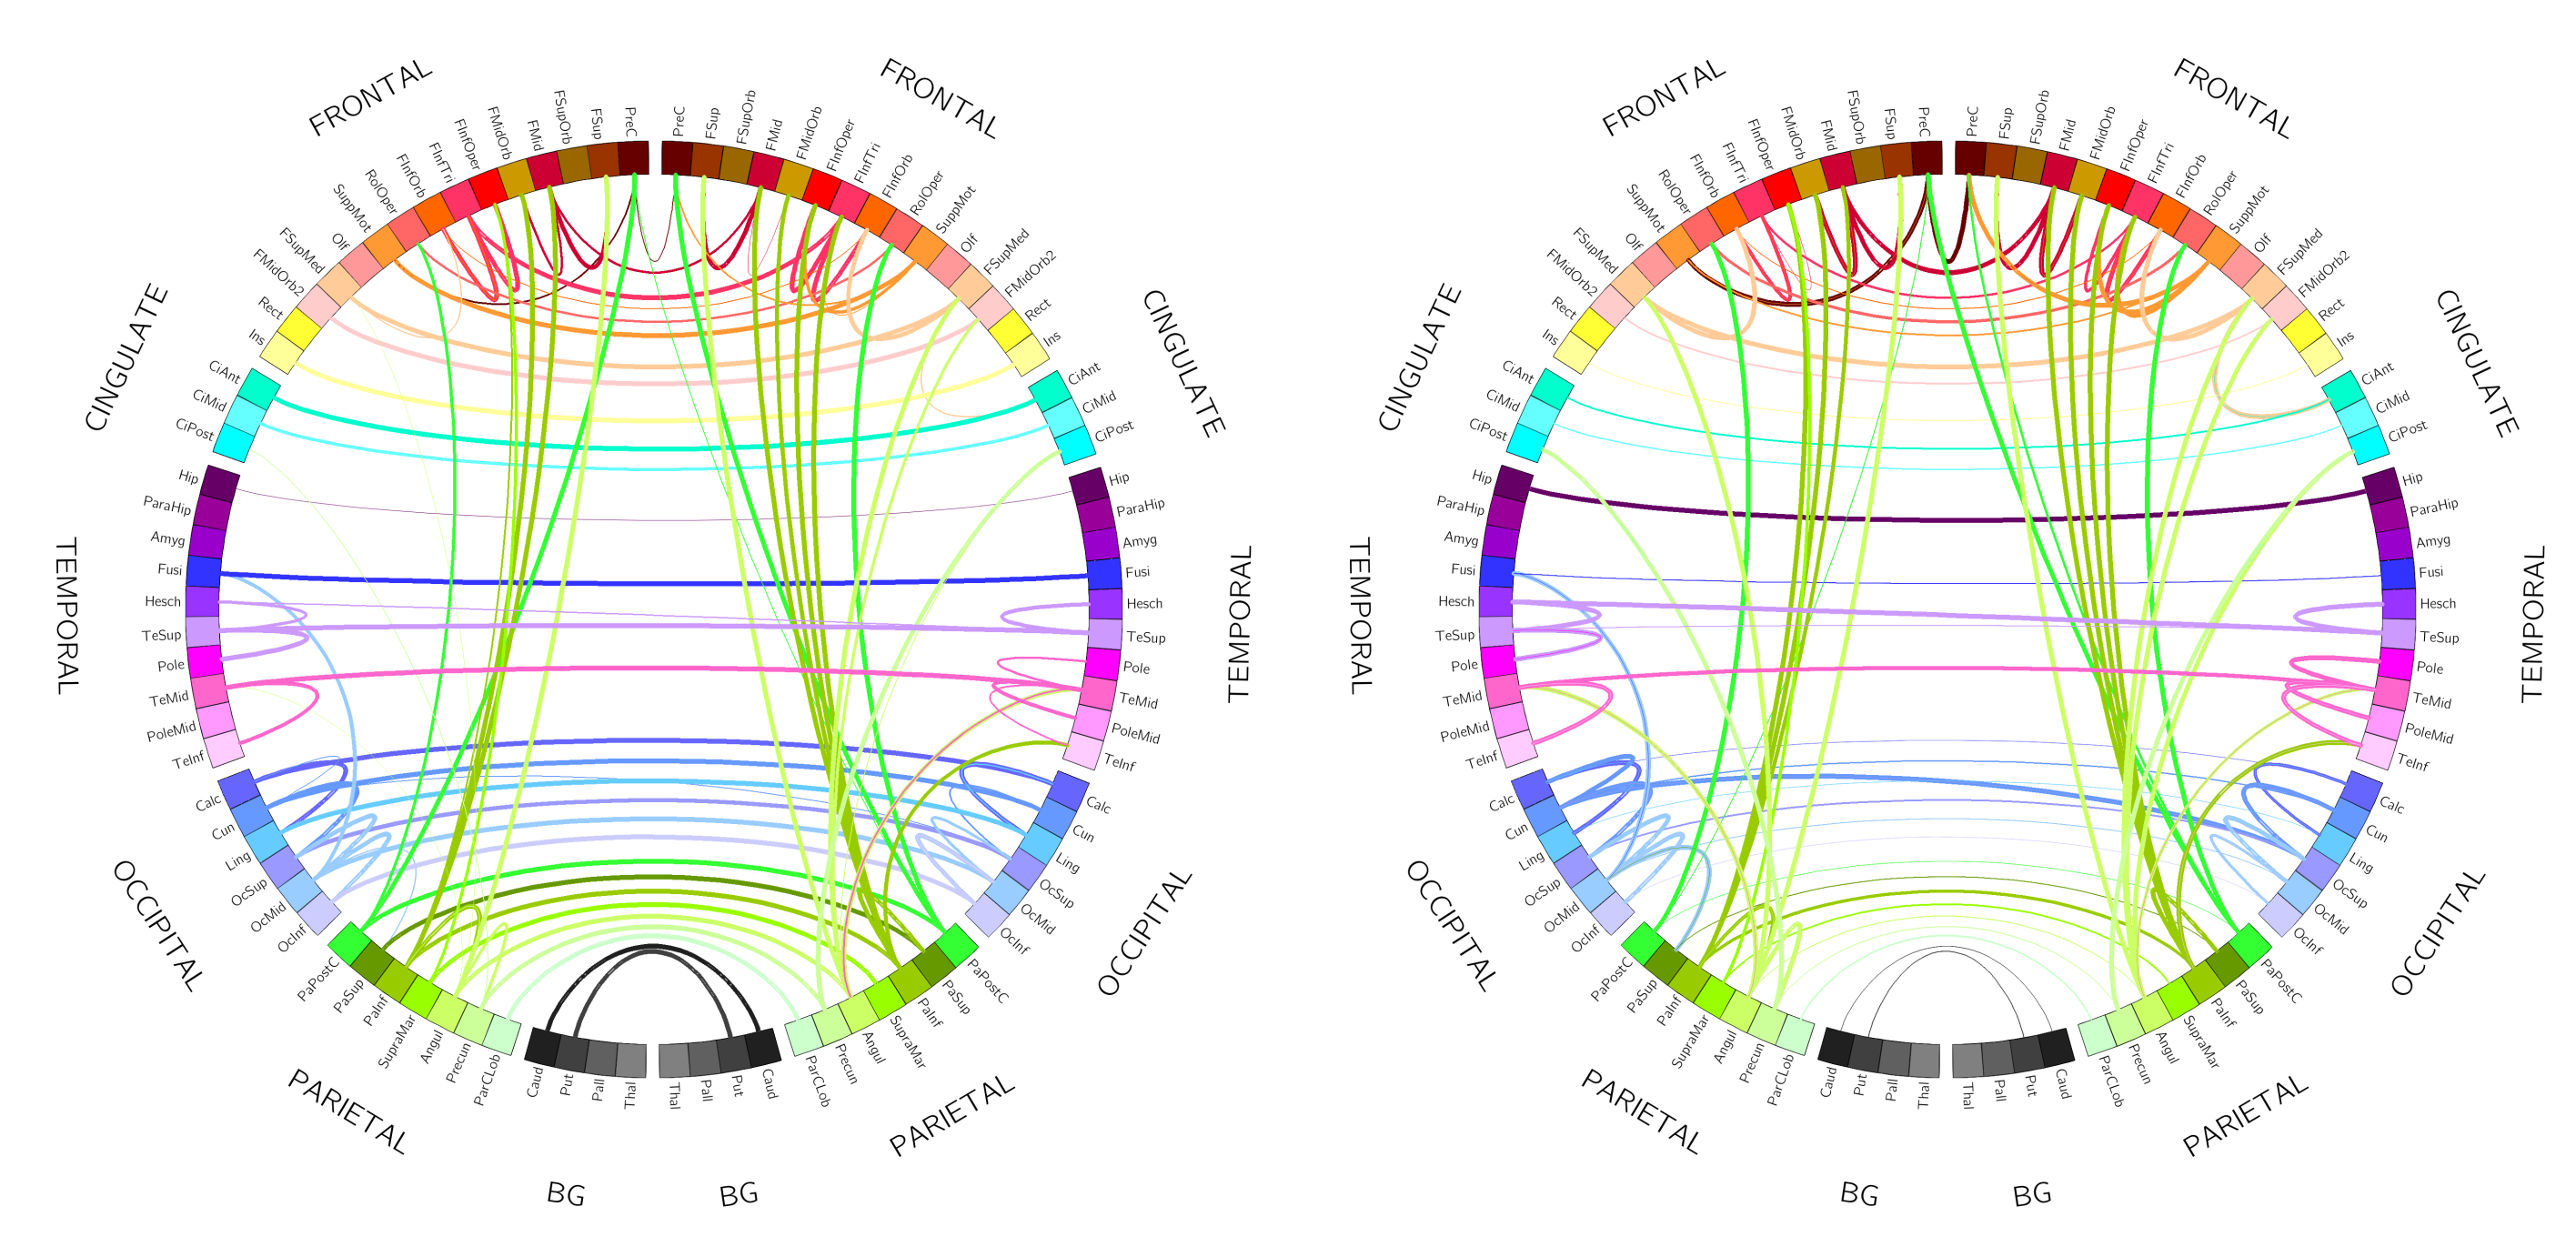
Figure 5 rapresents top 1% connections (in terms of MVGC strength $$$G$$$ and $$$F$$$) of the matrices in Figure 4 in a circular plot where the ROIs are displayed in an anatomically meaningful order.
Discussion
Extensive synthetic data simulations demonstrate the suitability of the MVGC approach in detecting true causal links among the top 1% within complex, physiologically inspired directed neural networks of various densities. While the AUC for the MVGC-based detection decrease steeply and almost monotonically with increasing network density the PPV has a sharp rise at low densities and keeps near unity for all densities greater than$$$~0.02$$$. These two factors combined ensure that we have little to no false positives in our in vivo results, and that our thresholded directed connectome can be interpreted with confidence.
The MVGC analyses in vivo showed: 1) highly robust uni-directional functional connectivity interactions from ipsilateral parietal cortices to prefrontal regions (but not viceversa); 2) significant inter-hemispheric bi-directional functional connectivity between fronto-frontal, parieto-parietal, temporo-temporal, and occipito-occipital cortices; 3) significant ipsilateral functional interactions across areas belonging to the same frontal, parietal, temporal, and occipital circuits.
Conclusions
We have shown in silico that the top 1 percentile of a BOLD connectivity matrix has a PPV very close to 1, and demonstrate in HCP data that functional interactions between parietal and prefrontal cortices are not symmetrical, but consists of directional connectivity from parietal areas to prefrontal cortices rather than vice versa.Acknowledgements
No acknowledgement found.References
[1] L. Barnett and A. K. Seth, "The MVGC multivariate Granger causality toolbox: a new approach to Granger-causal inference," J Neurosci Methods, vol. 223, pp. 50-68, Feb 15 2014.
[2] D. C. Van Essen, S. M. Smith, D. M. Barch, T. E. J. Behrens, E. Yacoub, K. Ugurbil, et al., "The WU-Minn Human Connectome Project: An overview," Neuroimage, vol. 80, pp. 62-79, Oct 15 2013.
[3] S. M. Smith, C. F. Beckmann, J. Andersson, E. J. Auerbach, J. Bijsterbosch, G. Douaud, et al., "Resting-state fMRI in the Human Connectome Project," Neuroimage, vol. 80, pp. 144-168, Oct 15 2013.
[4] N. Tzourio-Mazoyer, B. Landeau, D. Papathanassiou, F. Crivello, O. Etard, N. Delcroix, et al., "Automated anatomical labeling of activations in SPM using a macroscopic anatomical parcellation of the MNI MRI single-subject brain," Neuroimage, vol. 15, pp. 273-289, Jan 2002.
Figures