5533
Efficient kidney perfusion imaging using non-segmented coronal slab 3D echo planar imaging with pseudo continuous arterial spin labeling1Radiology & Imaging Sciences, Clinical Center, National Institutes of Health, Bethesda, MD, United States
Synopsis
Arterial spin labeling (ASL) of the kidneys provides several advantages for the evaluation of kidney perfusion including contrast agent free studies while allowing multiple scans over a short time period. 3D acquisition provides higher SNR and with centric k-space encoding provides a well-defined post-labeling delay which makes background suppression pulses more effective. Prior techniques for 3D ASL perfusion imaging employed segmented GRASE with multi-TI FAIR and segmented TSE with pCASL. These acquisition schemes can be limited in resolution or require coached breathing along with providing limited coverage over an extended scanning time. In this work, we used non-segmented 3D EPI pCASL with coronal acquisition to efficiently image the two kidneys in a shorter time (nominal time 2:15) with increased control-label pairs. Background suppression and saturation pulses were also employed to reduce tissue related noise and signal from aorta, respectively. Cortical and medullary perfusion values were calculated in seven subjects which matched well with values from literature. In addition, good correspondence with transverse slab acquisition as well as good repeatability was shown.
Introduction
Arterial spin labeling (ASL) of the kidneys provides several advantages for the evaluation of kidney perfusion including contrast agent free studies while allowing multiple scans over a short time period. In addition, unlike DCE MRI, there is no ambiguity regarding contribution of permeability to signal intensity1. ASL has been demonstrated in renal artery stenosis2,3, renal cell carcinoma4, tumor perfusion5 and chronic kidney disease6 among other applications. Both multi-slice 2D7,8 and a few 3D acquisition schemes have been demonstrated for renal ASL9,10. Non-segmented 3D EPI (ns-3D EPI) is a highly efficient k-space coverage scheme and provides higher SNR/time. For an application like renal perfusion where motion can be a concern (kidney motion during respiratory cycle can be ~4cm11), efficient acquisition while maintaining high SNR could be beneficial. In this work, we use ns-3D EPI with a coronal acquisition scheme due to the shorter kidney span along that direction to reduce acquisition duration.Methods
Seven subjects were imaged under an IRB approved protocol on a 3T Philips Achieva TX scanner using a 16-channel TORSO-XL coil.
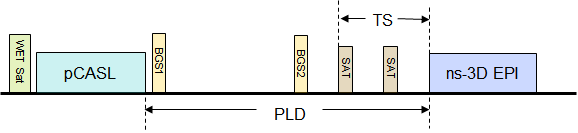
ASL measurement: The pCASL sequence with ns-3D EPI acquisition had the following scan parameters: pCASL: label duration = 1.5 s, post-label delay (PLD) = 1.4s; FOV = 26×34 cm2, res: 3×3×3mm3, EPI TR/TE = 25/12ms, acquisition window = 603ms, centric kz encoding, SENSE(y) = 2.5, respiratory triggering (RT), spectral-spatial excitation pulse (θ = 20°) with optimal flip angle train for reduced blurring12, 19 slices for full coverage, 20 dynamic pairs, nominal scan time: 2:15. Two background suppression (BGS) adiabatic inversion pulses (BGS1(start) = 1ms and BGS2 = 924ms after end of the tagging pulse) were used so that cortical and medullary tissue signal was less than 18% of the equilibrium signal (Mz=1). In addition, two temporally equispaced saturation slabs were employed superior to the imaging FOV to suppress signal from the aorta (TS=400 ms, see Figure 1). A separate M0 acquisition provided equilibrium magnetization values for RBF calculation.
More commonly used transverse slab acquisition was performed in two subjects with similar parameters but #slices=38 (full coverage) and acquisition window=970 ms to test against the preferred coronal acquisition scheme. In addition, repeatability of pCASL derived perfusion values was tested on two subjects.
Renal perfusion calculation: The relationship between the pCASL signal (ΔM) and renal perfusion ($$$f$$$) is given by13
$$∆M=2M_0.α.β.T_1.f.e^{(-δ/T_{1a})} .[e^{(- max(w-δ,0)/T_1 )}- e^{(- max(τ+w-δ,0)/T_1)}]/λ$$
where M0 refers to the magnetization of completely relaxed tissue, α=0.8 is the tagging efficiency, β=0.87 relates to signal loss due to BGS, λ=0.9 refers to blood-tissue partition coefficient, δ=750ms is the transit time10, τ = 1.5s (tagging time), $$$T_{1a}$$$=1664 ms14 and $$$T_1$$$15 are the longitudinal relaxation times for arterial blood and tissue, respectively; $$$w$$$=1.4s is the post-labeling delay.
Post-processing: To determine perfusion in the cortex and
medulla, post-processing was performed on the entire calculated image set to
manually segment the kidney from the surrounding tissue. This was followed by
automatic segmentation of the cortex from the medulla using Otsu’s algorithm16.
Results
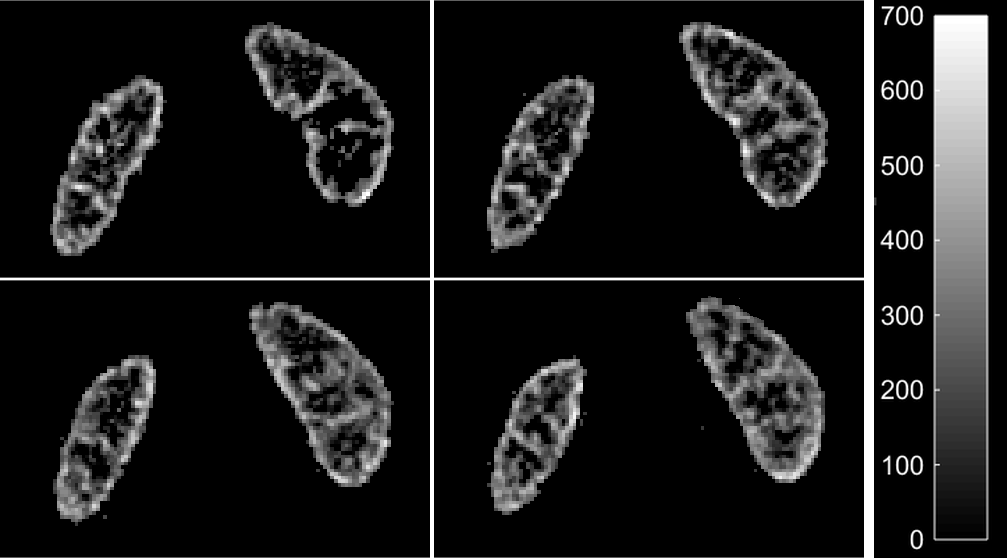
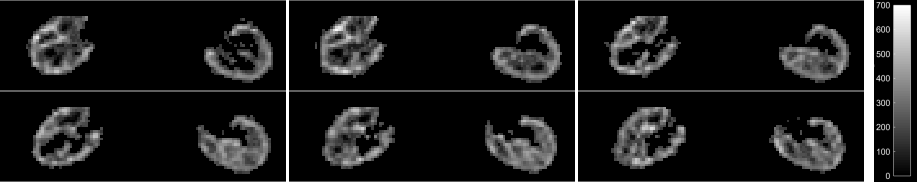
Mean cortical RBF for the seven subjects was 279.8±56.4ml/100g/min while mean medullary RBF was 130.9±25.8ml/100g/min. Figure 2 shows perfusion in four slices while Figure 3 shows reformatted axial slices. In two subjects with transverse acquisition for corroboration, the mean cortical and medullary perfusion differed by 2.1% and 3.7%, respectively, indicating no shortcoming related to coronal acquisition with a transverse tagging plane. Repeatability in two subjects showed a mean difference of 2.4% and 6.4% in cortical and medullary perfusion, respectively.Discussion
Three-dimensional imaging with centric k-space encoding provides a well-defined post-labeling delay which makes background suppression pulses more effective.
For subjects where the respiratory cycle is shorter than the total sequence duration, trigger delay can be adjusted to play the sequence across two respiratory cycles. As with other non-segmented and segmented acquisition techniques requiring prolonged acquisition, subjects with end expiratory period shorter than the acquisition window may provide sub-optimal imaging.
Previously, 3D kidney ASL used segmented 3D GRASE with multi-TI FAIR9 acquired twelve slices at a lower resolution with reported scan time of 4:12 “per ASL run”. A recent segmented fast spin-echo10 acquisition had a similar resolution as our sequence but the nominal time for one control-label pair and imaging one kidney (sagittal acquisition) was 5mins. Nominal time for our ns-3D EPI acquisition was 2:15 for 20 control-label pairs, covered both kidneys and required no coached breathing on the part of subjects. In addition, SAR deposition is much reduced with the ns-EPI acquisition.
In conclusion, pCASL with coronal slab 3D ns-EPI acquisition provides highly efficient full 3D coverage with high resolution in a relatively shorter time.
Acknowledgements
No acknowledgement found.References
1. Pedrosa I, Alsop DC, Rofsky NM. Magnetic resonance imaging as a biomarker in renal cell carcinoma. Cancer 2009;115(10 Suppl):2334-2345.
2. Schoenberg SO, Rieger JR, Michaely HJ, Rupprecht H, Samtleben W, Reiser MF. Functional magnetic resonance imaging in renal artery stenosis. Abdom Imaging 2006;31(2):200-212.
3. Fenchel M, Martirosian P, Langanke J, et al. Perfusion MR imaging with FAIR true FISP spin labeling in patients with and without renal artery stenosis: initial experience. Radiology 2006;238(3):1013-1021.
4. De Bazelaire C, Rofsky NM, Duhamel G, Michaelson MD, George D, Alsop DC. Arterial spin labeling blood flow magnetic resonance imaging for the characterization of metastatic renal cell carcinoma(1). Acad Radiol 2005;12(3):347-357.
5. Schor-Bardach R, Alsop DC, Pedrosa I, et al. Does arterial spin-labeling MR imaging-measured tumor perfusion correlate with renal cell cancer response to antiangiogenic therapy in a mouse model? Radiology 2009;251(3):731-742.
6. Rossi C, Artunc F, Martirosian P, Schlemmer HP, Schick F, Boss A. Histogram analysis of renal arterial spin labeling perfusion data reveals differences between volunteers and patients with mild chronic kidney disease. Invest Radiol 2012;47(8):490-496.
7. Gardener AG, Francis ST. Multislice perfusion of the kidneys using parallel imaging: image acquisition and analysis strategies. Magn Reson Med 2010;63(6):1627-1636.
8. Kim DW, Shim WH, Yoon SK, et al. Measurement of arterial transit time and renal blood flow using pseudocontinuous ASL MRI with multiple post-labeling delays: Feasibility, reproducibility, and variation. J Magn Reson Imaging 2017;46(3):813-819.
9. Cutajar M, Thomas DL, Banks T, Clark CA, Golay X, Gordon I. Repeatability of renal arterial spin labelling MRI in healthy subjects. MAGMA 2012;25(2):145-153.
10. Robson PM, Madhuranthakam AJ, Smith MP, et al. Volumetric Arterial Spin-labeled Perfusion Imaging of the Kidneys with a Three-dimensional Fast Spin Echo Acquisition. Acad Radiol 2016;23(2):144-154.
11. Schwartz LH, Richaud J, Buffat L, Touboul E, Schlienger M. Kidney mobility during respiration. Radiother Oncol 1994;32(1):84-86.
12. Stehling MK. Improved signal in "snapshot" FLASH by variable flip angles. Magn Reson Imaging 1992;10(1):165-167.
13. Alsop DC, Detre JA. Reduced transit-time sensitivity in noninvasive magnetic resonance imaging of human cerebral blood flow. J Cereb Blood Flow Metab 1996;16(6):1236-1249.
14. Lu H, Clingman C, Golay X, van Zijl PC. Determining the longitudinal relaxation time (T1) of blood at 3.0 Tesla. Magn Reson Med 2004;52(3):679-682.
15. de Bazelaire CM, Duhamel GD, Rofsky NM, Alsop DC. MR imaging relaxation times of abdominal and pelvic tissues measured in vivo at 3.0 T: preliminary results. Radiology 2004;230(3):652-659.
16. Otsu N. A threshold selection method from gray level histograms. IEEE Trans Syst, Man, Cyber 1979;9:62-66.
Figures