5532
3D MRI of Blood Flow of Human Retina1Radiology, Stony Brook University Hospital, Stony Brook, NY, United States, 2Biomedical Engineering, Stony Brook University, Stony Brook, NY, United States
Synopsis
Previous studies have shown that blood flow in the human retina can be measured using MRI. These studies used single-slice 2D pseudo-continuous arterial spin labeling (pCASL) which has limited spatial coverage and resolution, and is susceptible to through-plane eye motion. In this study, a pCASL with zoom-3D TSE VFA acquisition was developed to provide whole-eye coverage with 0.5×0.5×4mm3 resolution and reduced motion induced image blur. This approach should prove useful for studying different retinal disorders such as glaucoma, diabetic retinopathy and retinal ischemia.
Introduction:
The retina is nourished by two vascular systems, the retinal and choroidal circulations, with the choroidal circulation having ~10 times higher blood flow1. Due to the limitation of reduced FOV (rFOV) acquisition, previous MRI-based studies have used single-slice 2D pseudo-continuous arterial spin labeling (pCASL) with turbo spin echo (TSE) acquisition for quantification of retina blood flow with limited resolution (~0.8×0.5×6mm3)2. The single 2D slice renders the measurement susceptible to potential eye motion during image acquisition. The single-shot TSE acquisition with centric reordering can result in noticeable image blur along phase-encoding direction, which is detrimental for retina structure with thickness of couple voxels. In this study a pCASL with zoom-3D TSE variable flip angle (VFA) acquisition was developed to provide whole-eye coverage with 0.5×0.5×4mm3 resolution and reduced motion induced image blur. Initial results from six healthy participants are reported. This new method offers substantial improvement in spatial resolution with 3D coverage for measuring blood flow in the human retina.Methods:
Six healthy participants were recruited for this IRB approved study on a Siemens Prisma 3T magnet using a single channel loop coil placed over the left eye. Background suppressed, pCASL with zoom-3D TSE VFA acquisition was developed to image whole-eye retina blood flow. Standard Siemens TSE VFA with elliptic k-space sampling and radial reordering was used for readout. The pulse sequence parameters were: FOV of 128×25.6×40mm3; resolution of 0.5×0.5×4mm3; readout and phase-encoding directions were parallel and perpendicular to posterior retina respectively; TR/TE/Label duration/post-label delay of 3820/122/1900/1500ms; 1.4 averages; echo spacing/echo train duration of 4.46/321ms; radial reordering; bandwidth of 501Hz/Px; turbo factor of 100. Total acquisition time was ~10min for 13 control-label pairs. Two background suppression pulses were optimized to provide ~85% reduction of vitreous and retina signal. A reference image was acquired without background suppression and TR of 8000ms. Participants were provided a fixation target inside the magnet bore and instructed to blink during the labeling block of the ASL sequence to minimize motion artifacts. Structural bSSFP images with 0.8mm3 isotropic resolution were acquired for localization.
ASL images were processed using in-house customized ASLtoolbox3 and SPM124. The processing pipeline consisted of the following: realignment of ASL images to correct for motion; simple-subtraction of ASL control-label pairs for calculation of the average perfusion image; coreregistration of the reference image to the average perfusion image; mask generation by intensity thresholding of the reference image; blood flow quantification using the single compartment model5. Retina regions of interest were manually contoured for each participant and average blood flow was estimated.
Results:
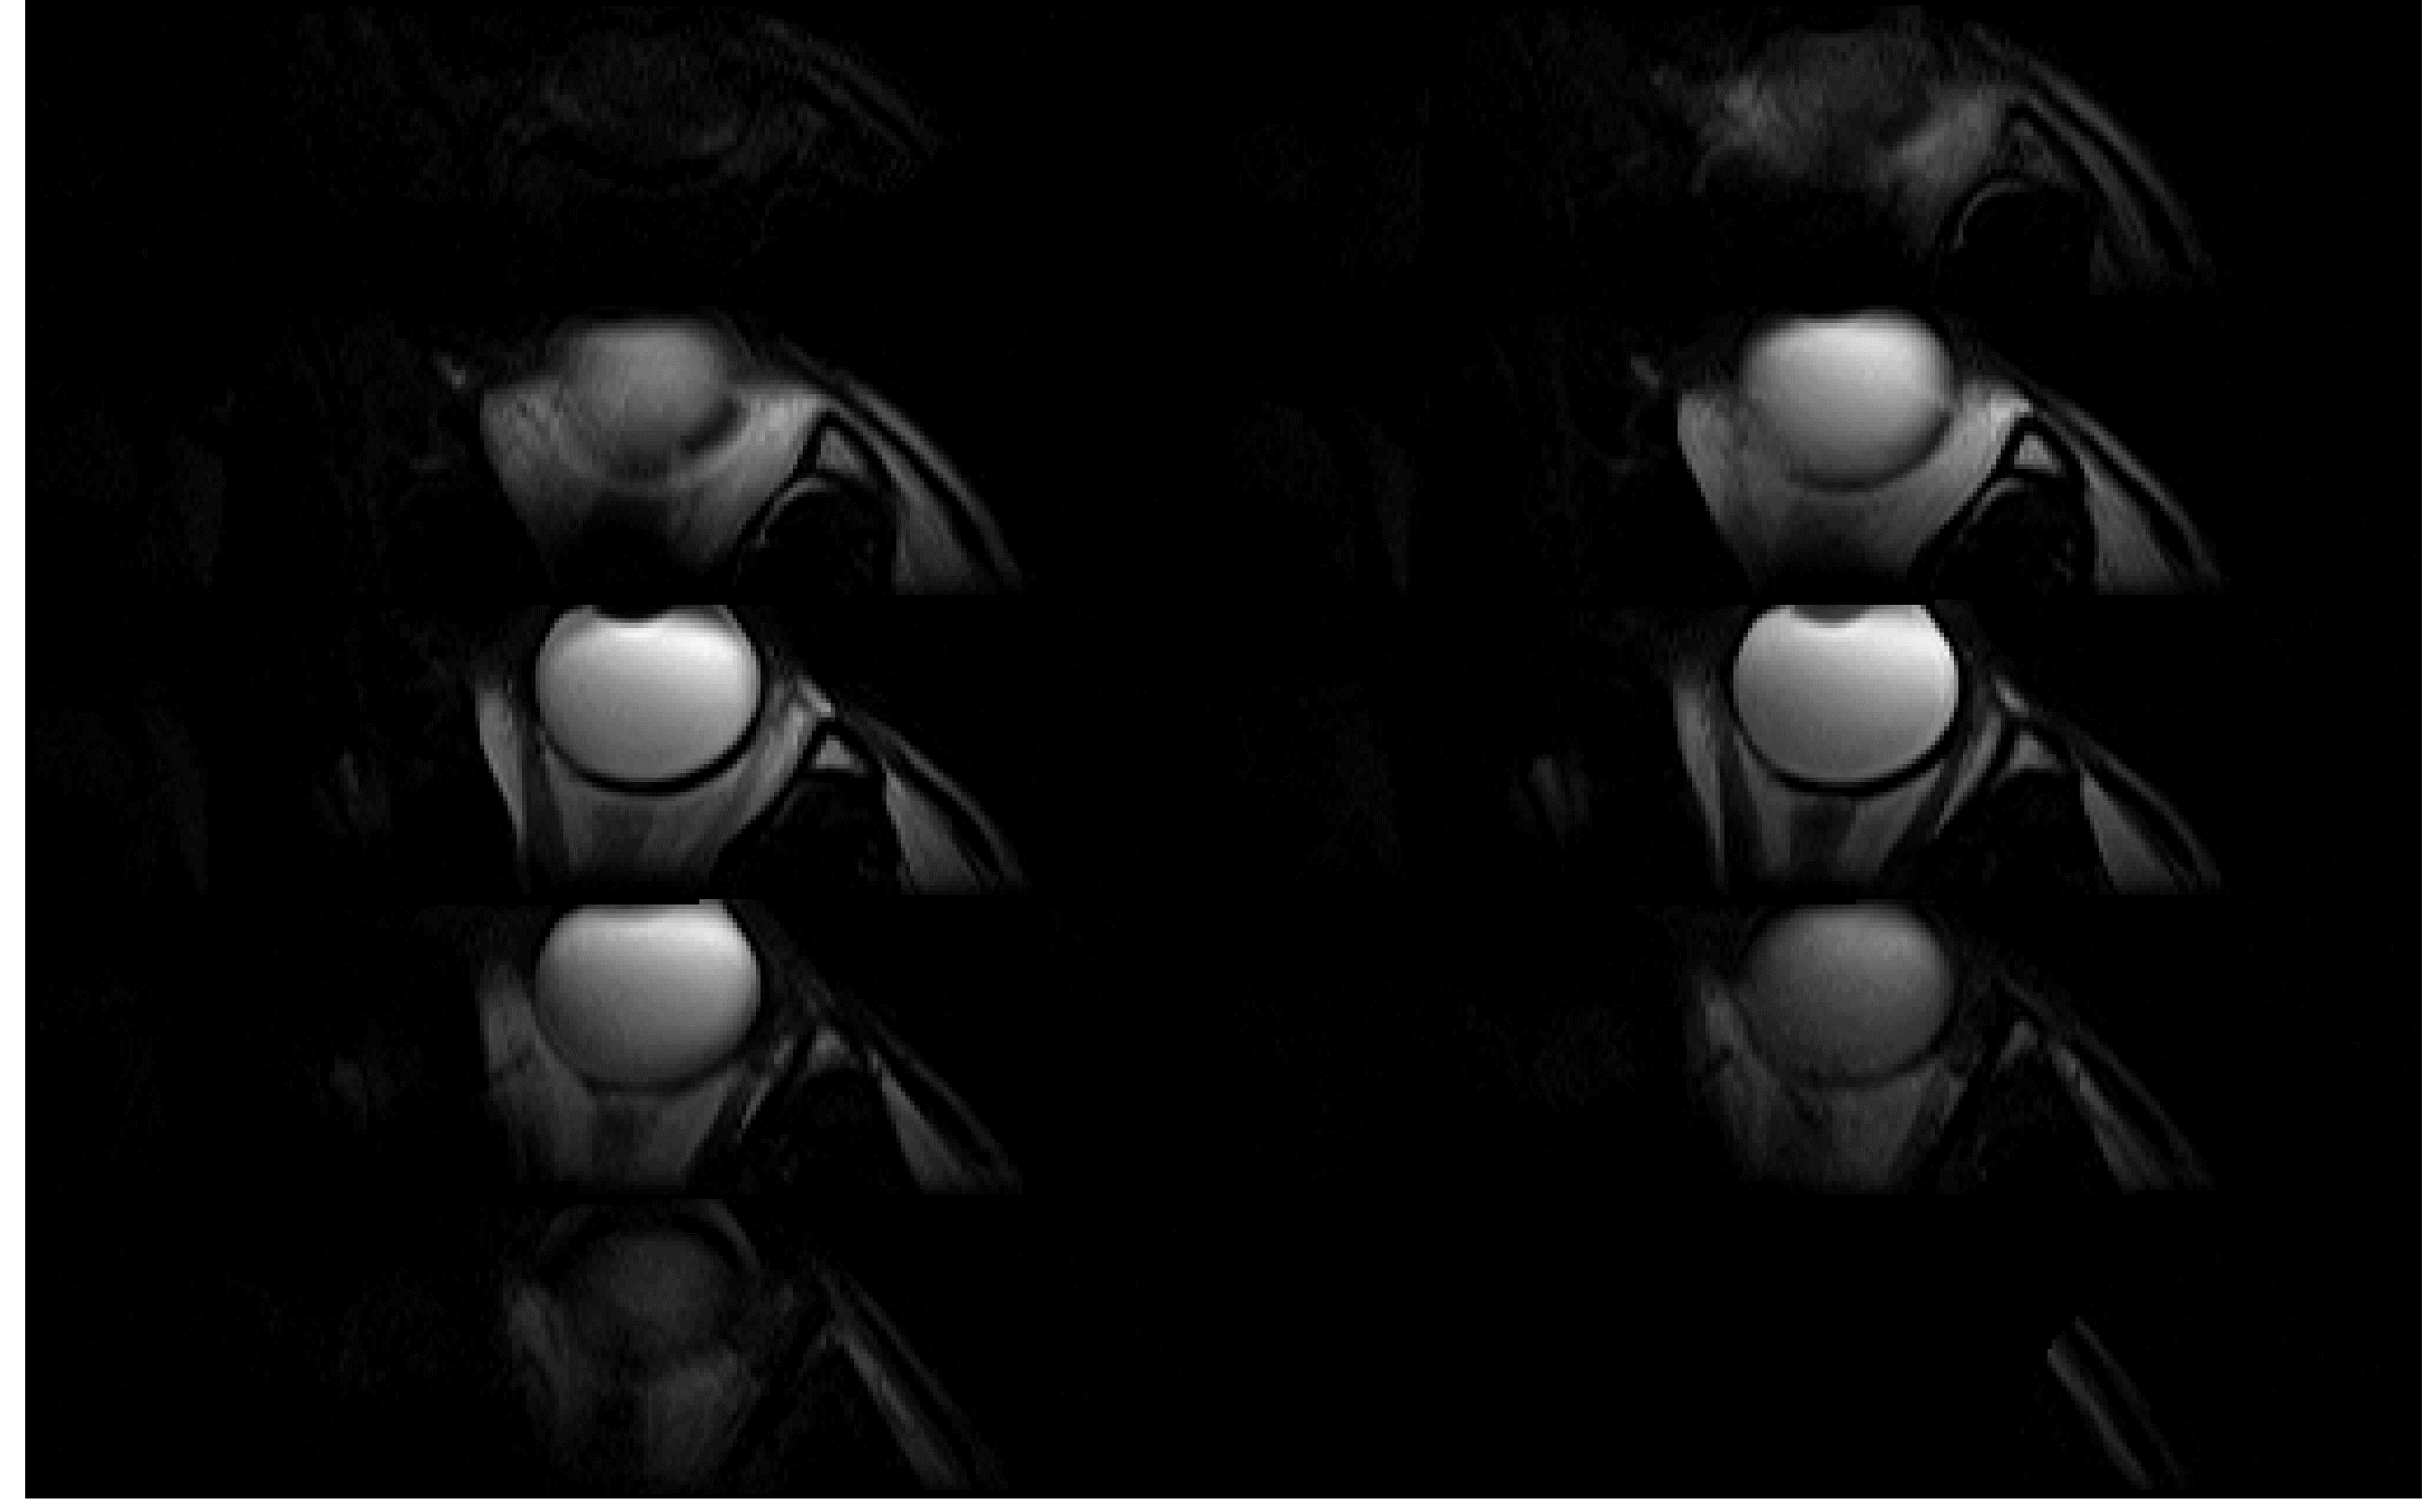
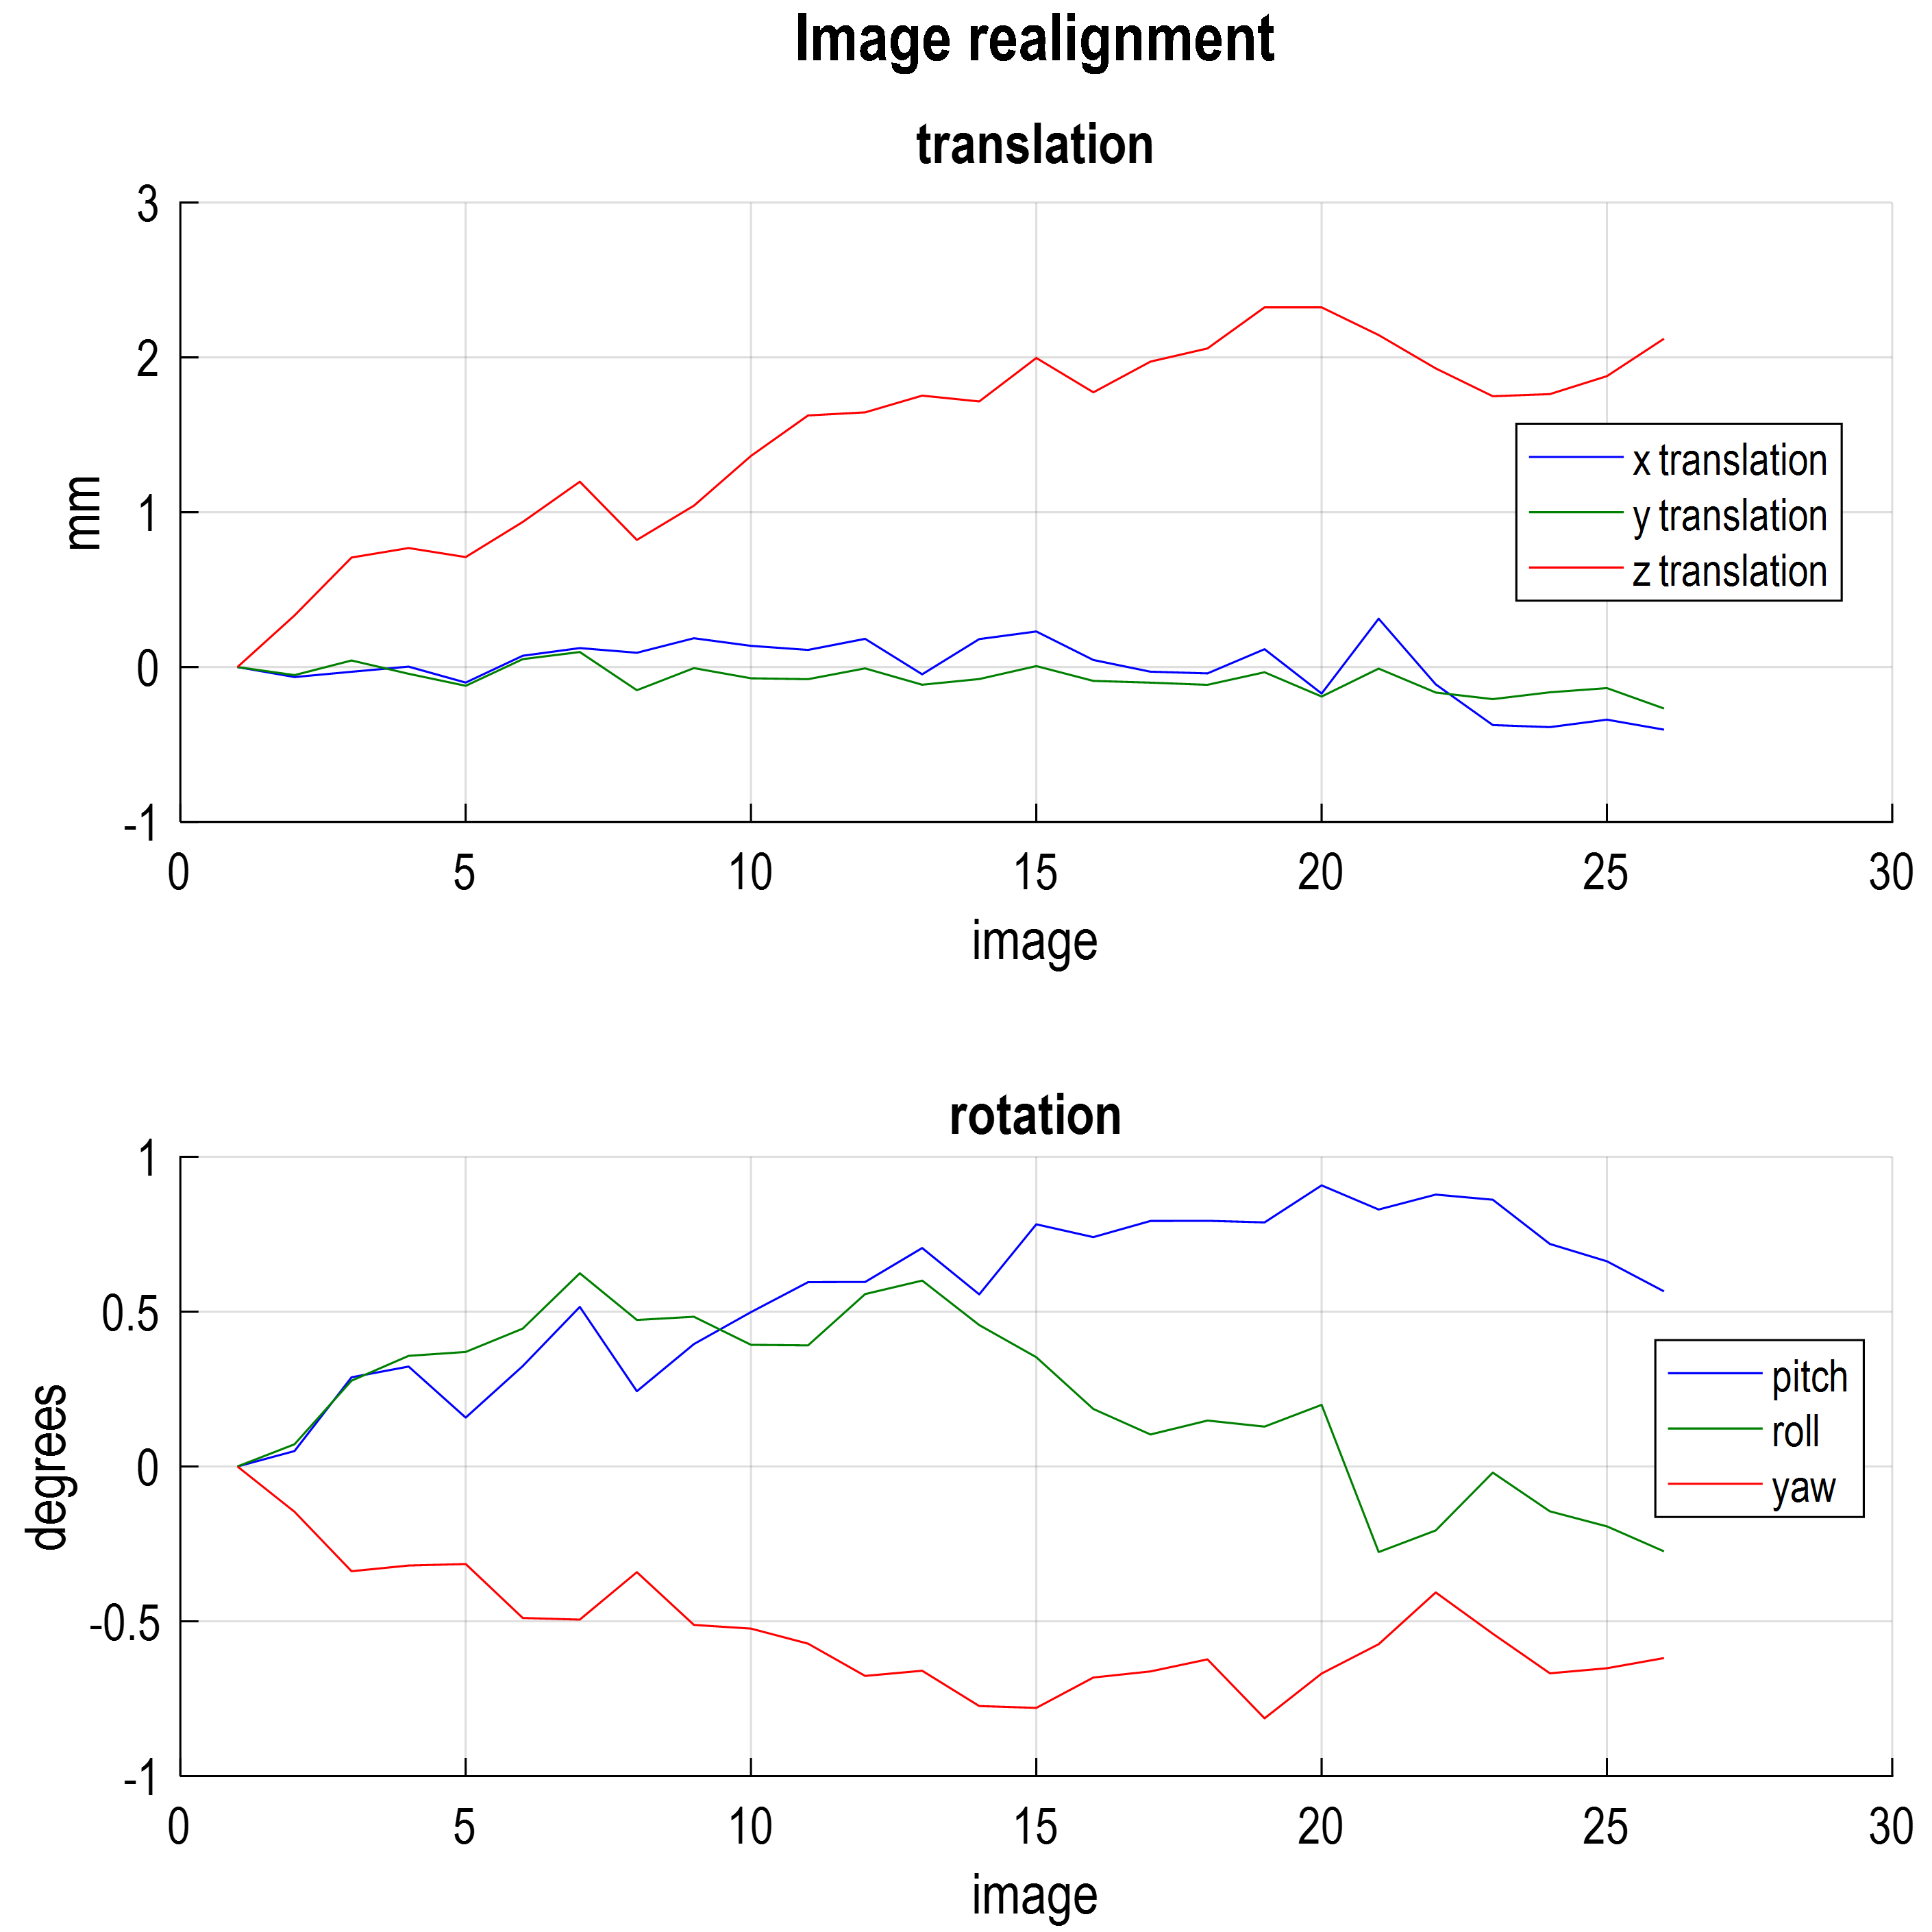
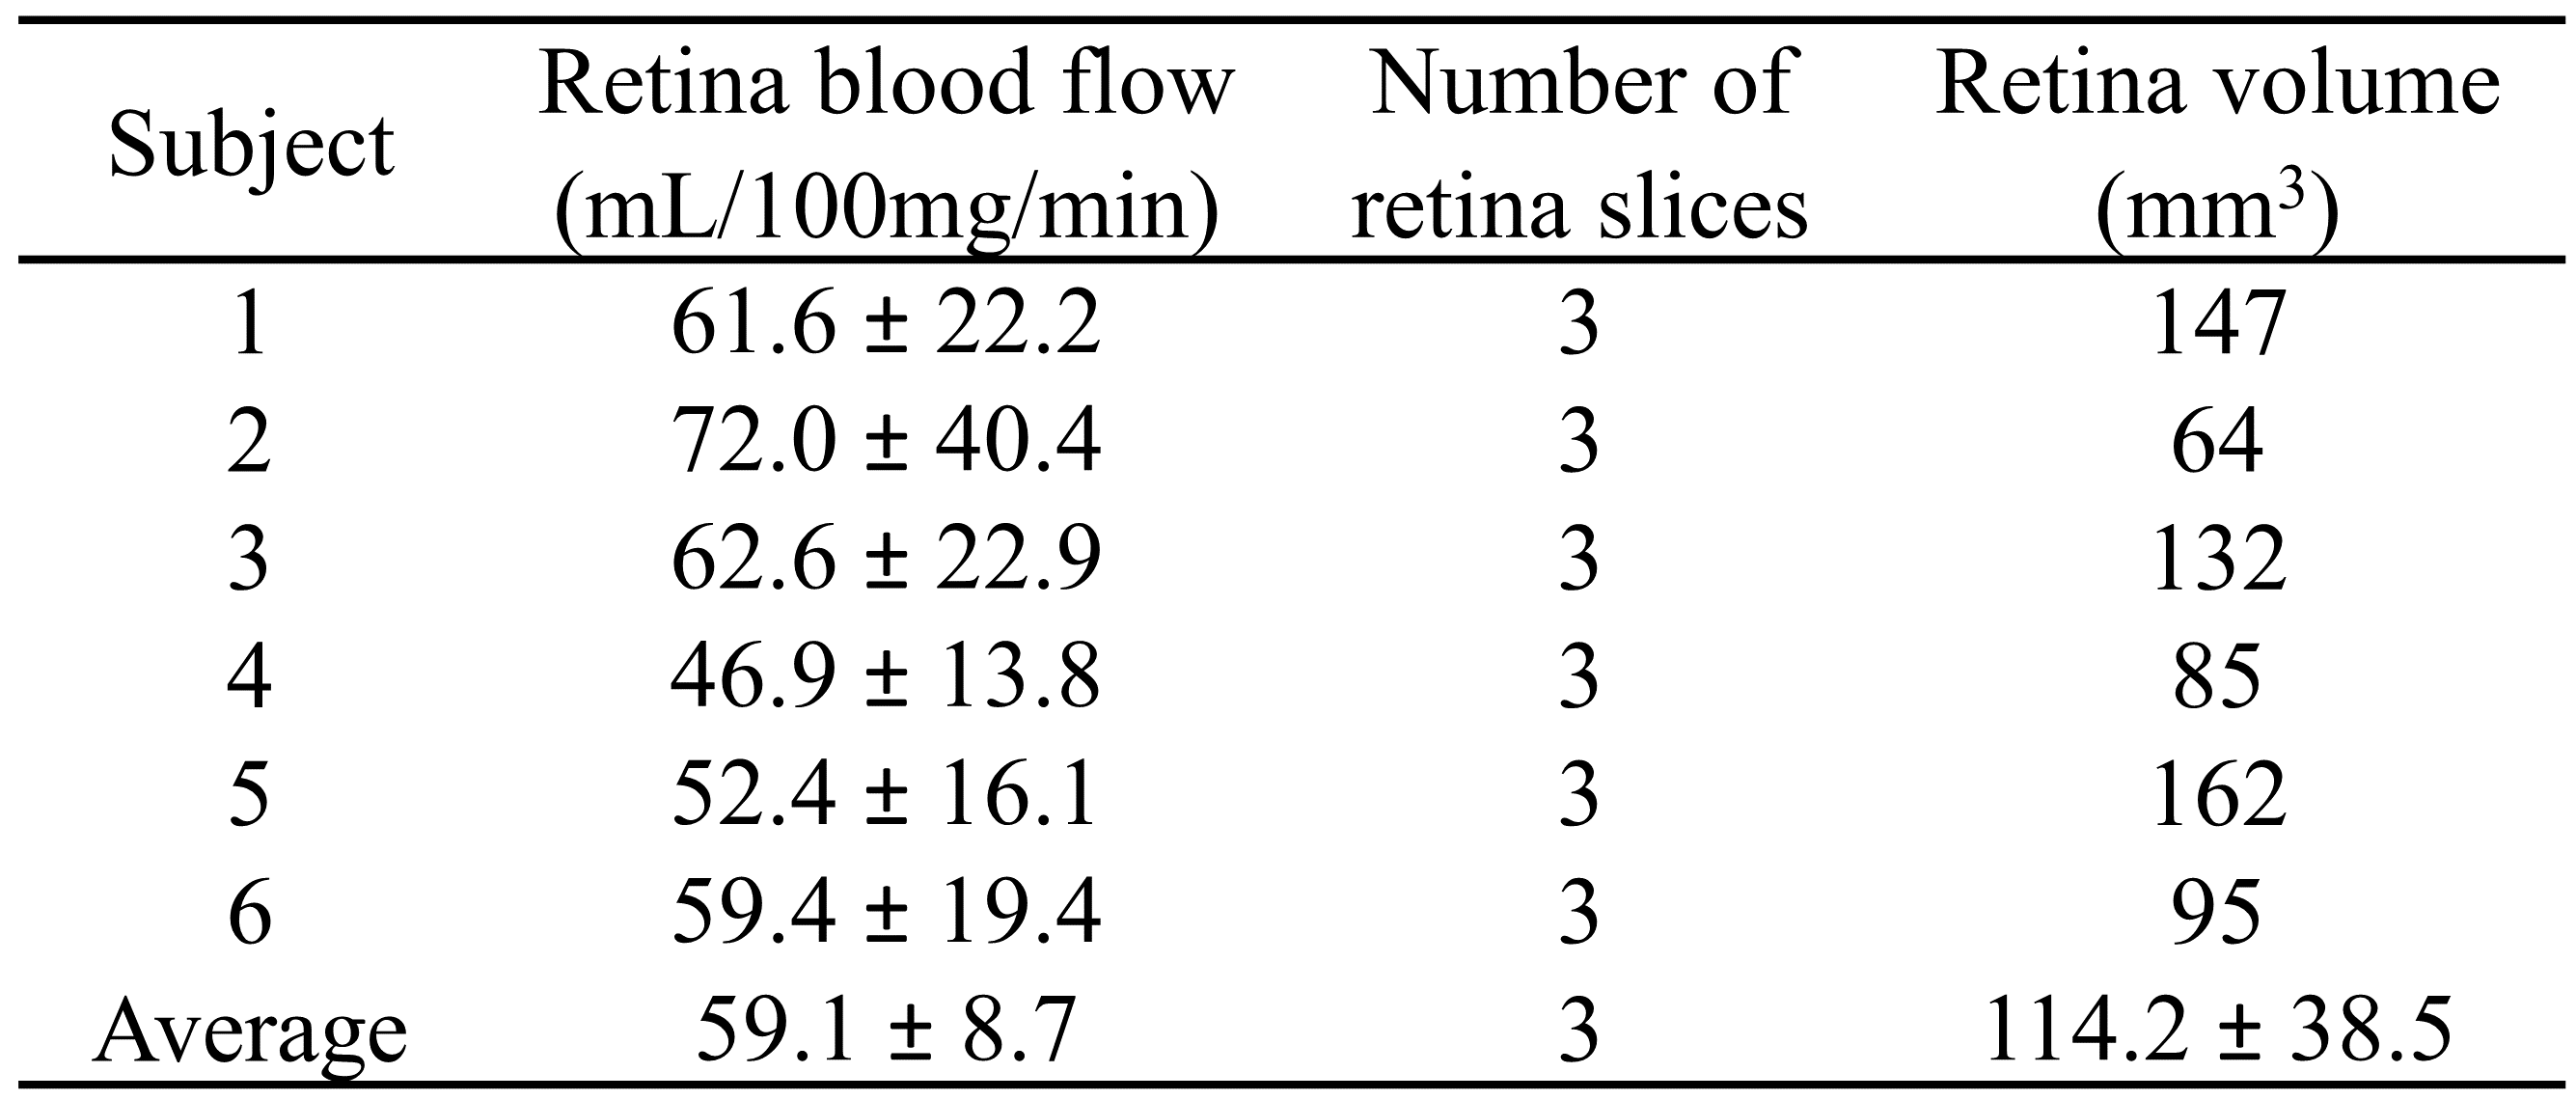
Figure 1 displays all ten slices from a pCASL with 3D TSE VFA acquisition for a typical participant. Whole-eye coverage is achieved with high SNR. The motion parameters across the ~10 min ASL acquisition for a typical participant are displayed in Fig 2. The average translations for the participant were 0.15±0.13, 0.09±0.07 and 1.44±0.61mm in x, y and z directions respectively. The average rotations were 0.54±0.25°, 0.31±0.19° and 0.53±0.19° for rotations about x, y and z axes. Figure 3 shows the blood flow map for a typical participant along with corresponding anatomical images. The typical presentation of high blood flow near the fovea and reduced blood flow at the distal edges of the retina was observed. Table 1 lists average blood flow values in the retina of the six participants. The group average blood flow was 59.1±8.7mL/100g/min, in good agreement with previous studies using pCASL with 2D TSE acquisition.Discussion:
For the first time, 3D blood flow mapping of the human retina was achieved. The 3D pCASL method presented here greatly improves spatial resolution, in addition to spatial coverage, resulting in less partial volume effect from retinal curvature. The 3D acquisition allows for more accurate motion correction than previous 2D methods. In previous studies using pCASL with 2D TSE acquisition, a single 2D slice was acquired in the region with greatest perfusion (near the fovea) resulting in higher observed average blood flow in the retina compared to this study. Here, regions of the retina further away from the fovea are imaged and included in the analysis, contributing to the lower average retina blood flow. By measuring whole-eye blood flow a more comprehensive investigation of retina blood supply can be achieved. This technique should prove useful to study regional blood flow changes in retinal disorders such as glaucoma, diabetic retinopathy and retinal ischemima6.Conclusion:
A pCASL with zoom-3D TSE VFA acquisition method was developed for whole-eye mapping of blood flow of the human retina. Initial results from healthy participants demonstrate good agreement with previous 2D studies.Acknowledgements
No acknowledgement found.References
No reference found.Figures