5529
QUANTITATIVE MULTIPLE BOLI ARTERIAL SPIN LABELLING: FROM PULSED TO PSEUDO-CONTINUOUS LABELLING1Centre for Clinical Brain Sciences, University of Edinburgh, Edinburgh, United Kingdom, 2Glasgow experimental MRI centre (GEMRIC), Institute of Neurosciences and Psychology, University of Glasgow, Glasgow, United Kingdom, 3Phelma, Grenoble, France
Synopsis
A quantitative kinetic model for the recently introduced high SNR multiple boli Arterial Spin Labelling technique (mbASL) has been developed and validated both theoretically and experimentally. By varying the labelling inversion thickness, mbASL signal was shown to switch from a pseudo-continuous to a pulsed ASL behaviour. The model reflects the hybrid nature of mbASL, which combines the high labelling efficiency of pulsed ASL with the continuous labelling advantage of pseudo-continuous ASL. We use the mbASL kinetic model produce high SNR cerebral blood flow maps based on mbASL measurements.
INTRODUCTION
Arterial Spin Labelling (ASL) allows perfusion to be imaged by inverting the longitudinal magnetisation of inflowing arterial blood water. Due to their ability to characterise tissue perfusion non-invasively, ASL techniques are becoming precious tools in the assessment of a wide range of pathologies. One of the major drawbacks is that ASL typically suffers from low signal-to-noise ratio (SNR). Recently, a high SNR multiple boli ASL technique (mbASL) was introduced1, combining the high labelling efficiency of pulsed ASL (PASL) with the continuous labelling advantage of pseudo-continuous ASL (pCASL). Here, labelling relies on a train of adiabatic inversion pulses of variable thickness (Fig.1). Despite the promising results, the hybrid nature of mbASL makes cerebral blood flow (CBF) quantification challenging. In this work, we modify the standard kinetic model2 to account for the mbASL particularities (finite slice thickness and multiple inversions) and demonstrate theoretically and experimentally the quantitative nature of the mbASL experiment.
METHODS
The theoretical expression of the mbASL magnetisation, $$$\Delta M_{mbASL}(t) $$$, was obtained by modifying the $$$\Delta M_{PASL}(t) $$$ equation proposed by Buxton et al.2 Finite slice thickness, $$$L_{inv}$$$, was considered in the expression the time of arrival of labelled blood,$$$\tau$$$: $$\tau=\frac{L_{inv}}{V_{blood}}+\delta+t_p (1) $$ where $$$V_{blood}$$$ is the average velocity of inverted blood,$$$ \delta$$$ the arterial transit time and $$$t_p$$$ the adiabatic pulse duration. A sum of modified $$$\Delta M_{PASL}(t) $$$ with different post-labelling delays allowed to account for the multiple adiabatic inversions:$$\Delta M_{mbASL}(t) = f\sum^{n_p}_{i=1} \Delta M^i_{PASL}(t) (2)$$ where $$$f$$$ is the CBF and $$$n_p$$$ the number of pulses applied during the labelling duration, CI. A MATLAB code was developed to interrogate the effect of various parameters on $$$\Delta M_{mbASL}$$$ and fit the mbASL kinetic model to experimental data. An experimental investigation on the effect of mbASL parameters was carried by performing a range of perfusion measurements on mice brains (n=8) on a 7T Bruker Biospec instrument. For the mbASL sequence, $$$n_p$$$ hyperbolic-secant inversion pulses of 3.3 ms were evenly distributed over CI. The offset of the inversion slice compared to the imaging slice was set at 11 mm. Matrix size was 96×96, TR was 7 s, TE was 12 ms, 4 acquisition segments and 6 averages were used (~7 min). Critical parameters such as the inversion thickness, $$$L_{inv}$$$, or the post labelling delay, TI, were investigated both theoretically and experimentally. For producing quantitative CBF maps, quantitative T1 measurements were also performed using an inversion recovery sequence with RARE acquisition (same geometry and resolution as for mbASL, post-processing using Paravision 5.1 software).
RESULTS
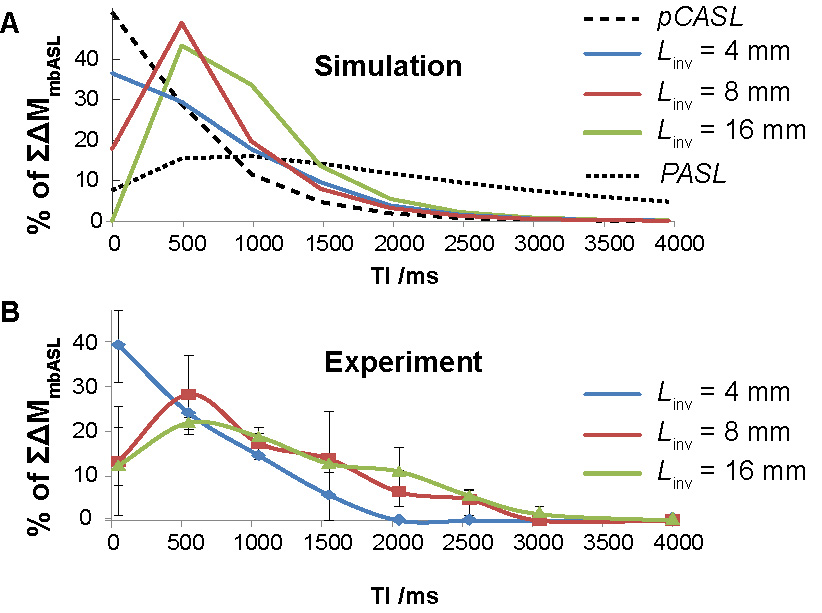
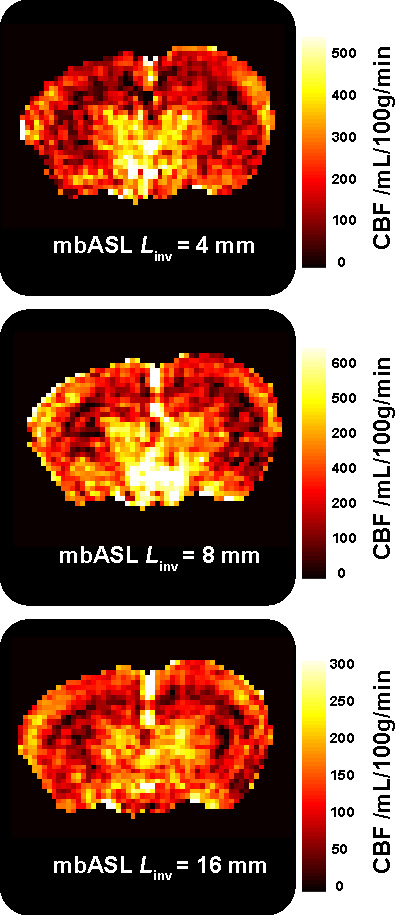
Fig.2 shows theoretical and experimental mbASL signal against post labelling delay at different inversion thicknesses. The characteristic signal peak shift observed when switching from pCASL to PASL sequences is reproduced both by mbASL simulations and measurements. By varying $$$L_{inv}$$$ one can control the shape of the inflow bolus, alternating between the highly vascular pCASL signal and the tissue component dominated PASL signal. Differences observed for higher $$$L_{inv}$$$ can be attributed to the fact that in the simulations $$$V_{blood}$$$ is considered to be constant (25 mm s-1), while in reality it is dependent on the slice thickness. For example, $$$V_{blood}$$$ is expected to be much higher for a thin slice situated at the carotid level than for a thicker one covering the heart. By fitting mbASL equations to the experimental data it is possible to provide with an estimation of the average blood velocity as a function of $$$L_{inv}$$$ (31 mm s-1 for $$$L_{inv}$$$= 4 mm, 22 mm s-1 for $$$L_{inv}$$$= 8 mm and 8 mm s-1 for $$$L_{inv}$$$= 16 mm). Introducing the experimental $$$V_{blood}$$$ to the mbASL equation allowed to produce quantitative CBF maps using T1 maps and $$$\Delta M_{mbASL}$$$ images(Fig.3).
DISCUSSION
Both $$$V_(1)$$$ and CBF values obtained using the mbASL kinetic model were found to be in agreement with the literature3. Furthermore, the results presented in this work allowed to highlight the hybrid nature of the mbASL experiment and the crucial role of the relative slice thickness. In cases of relatively low $$$L_{inv}$$$, $$$\Delta M_{mbASL} $$$ will approximate a pCASL experiment where spins are inverted on a plane, while if the relative $$$L_{inv}$$$ becomes significant then a PASL behaviour is expected. This allows explaining previously observed results1 where for a similar $$$L_{inv}$$$, the mbASL sequence produced PASL-type results for mice and pCASL-type results for rats.
CONCLUSION
A quantitative mbASL kinetic model has been developed and validated both theoretically and experimentally. Using this model it is possible to produce high SNR cerebral blood flow maps based on mbASL measurements.Acknowledgements
No acknowledgement found.References
1. Vallatos A, Gilmour L, Chalmers AJ, Holmes WM. Multiple boli Arterial Spin Labelling for high signal-to-noise rodent brain perfusion imaging. Magn Reson Med 2017. 3.
2. Buxton RB, Frank LR, Wong EC, Siewert B, Warach S, Edelman RR. A general kinetic model for quantitative perfusion imaging with arterial spin labeling. Magn Reson Med 1998;40(3):383-396. 4.
3. Duhamel G, Callot V, Tachrount M, Alsop DC, Cozzone PJ. Pseudo-continuous arterial spin labeling at very high magnetic field (11.75 T) for high-resolution mouse brain perfusion imaging. Magn Reson Med 2012;67(5):1225-1236.
Figures
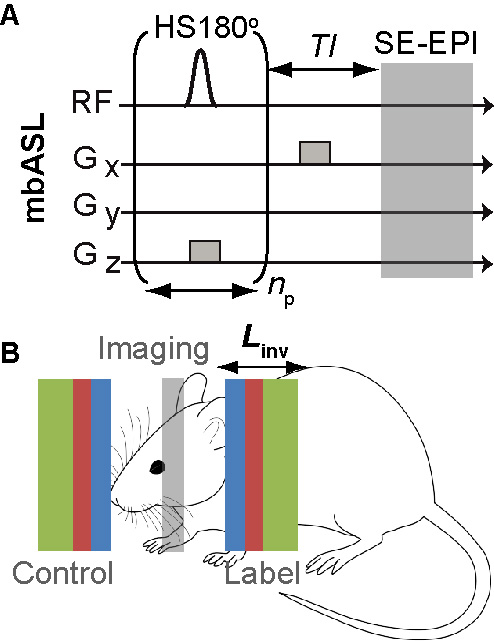
Figure 1. (A) mbASL sequence and (B) schematic diagram of the sequence showing control and labelling inversion slices of different $$$L_{inv}$$$.