5526
Impact of calibration method on CBF quantification using multiple post-labeling-delay PASL1ISR-Lisboa/LARSyS and Department of Bioengineering, Instituto Superior Técnico – Universidade de Lisboa, Lisbon, Portugal, 2Imaging Department, Hospital da Luz, Lisbon, Portugal, 3Institute of Biomedical Engineering, University of Oxford, Oxford, United Kingdom
Synopsis
Absolute CBF quantification using ASL requires the normalization of the magnetization difference images by the equilibrium magnetization of arterial blood, which is usually extrapolated from the equilibrium magnetization measured in tissue. Although different calibration methods have been previously compared, a number of subtle processing options made in their practical implementation are often assumed or overlooked, compromising the utility of absolute quantification. We systematically compared different calibration methods and associated options in multiple post-labeling-delay pulsed ASL and found that they can severely impact CBF quantification. Our results highlight the need for consistent calibration pipelines for CBF quantification using ASL.
Introduction
In order to obtain cerebral blood flow (CBF) measurements in absolute units using arterial spin labeling (ASL), it is necessary to normalize the control-label difference images by the equilibrium magnetization of arterial blood (M0a), which is usually extrapolated from the equilibrium magnetization measured in tissue (M0t). The current recommendation involves the acquisition of a calibration image followed by the extraction of M0t by TR correction, which is subsequently converted to an M0a image by smoothing and division by the brain average water partition coefficient (λ)1. In the case of multiple-PLD pulsed ASL (PASL) with no background suppression (e.g. PICORE), it is also possible to obtain M0t based on the control images, whether by averaging at a specific PLD2 or by fitting a saturation-recovery curve to the multiple-PLD images3. Separate to the acquisition of the calibration image is the choice of calculating a voxelwise M0a value, or a single value by averaging over a tissue region. Additionally, a number of more subtle choices are made in the practical implementation that are often assumed or overlooked. Although different calibration methods have previously been compared4,5,6, the impact of the multitude of processing choices involved has not been investigated. Here, we systematically assess the impact of different calibration methods and associated options on CBF quantification using multiple-PLD PASL.Methods
Nine healthy volunteers were studied on a 3T Siemens system. ASL images were obtained using PICORE PASL (TR/TE=2500/19ms, 3.5x3.5x7.0mm3) with Q2TIPS saturation limiting the labeling bolus width to 750ms, 11 PLD values (400-2400ms, in steps of 200ms), and 8 label/control repetitions for each PLD3. ASL data pre-processing included: motion correction; control magnetization averaging at each PLD (control time series); and control-label magnetization subtraction and averaging at each PLD (difference time series). An extended kinetic model was fitted to the difference time series using BASIL7,8 (T1a=1.6s, T1t=1.3s, α=0.9) in order to obtain relative CBF (CBFrel).
Extraction of M0t from control time series:
- Saturation Recovery (SatRec) fitting to control images time series
- Control Averaging (CtrAvg) of control images at a fixed PLD
Extrapolation of M0a from M0t:
- Reference Tissue - CSF (RT-CSF)
- Reference Tissue – WM (RT-WM)
- Voxelwise (Voxel)
For each method, the following options were considered:
Extraction of M0t from control time series:
- PLD value (CtrAvg): long PLD~2400ms (default), short PLD~800ms
- TR correction (CtrAvg): yes (default), no
- pre-saturation efficiency, A (CtrAvg): A=90% (default), A=100%
- pre-saturation efficiency, A (SatRec): estimated (default), A=100%
Extrapolation of M0a from M0t:
- mask for RT (RT-CSF): whole CSF, ventricles, ventricles restricted (default)
- smoothing of M0t (Voxel): none, 3mm (default), 5mm
- water partition coefficient, λ (Voxel): average (λavg=0.9) (default), PVE-weighted (λwgt, Eq.1), binarized (λbin=0.98 in GM/0.82 in WM)
$$Eq.1:\lambda_{wg t}=\frac{\lambda_{GM}PVE_{GM}+\lambda_{WM}PVE_{WM}}{1-PVE_{CSF}}$$
The different alternatives of each processing option were tested by fixing the other options to their default values (when indicated). For the extrapolation of M0a, the alternative options were tested only in the case of SatRec.
Finally, absolute CBF was computed using:
$$Eq.2: CBF(ml/100g/min)=\frac{CBF_{rel}}{\alpha M_{0a}}\times6000$$
Results
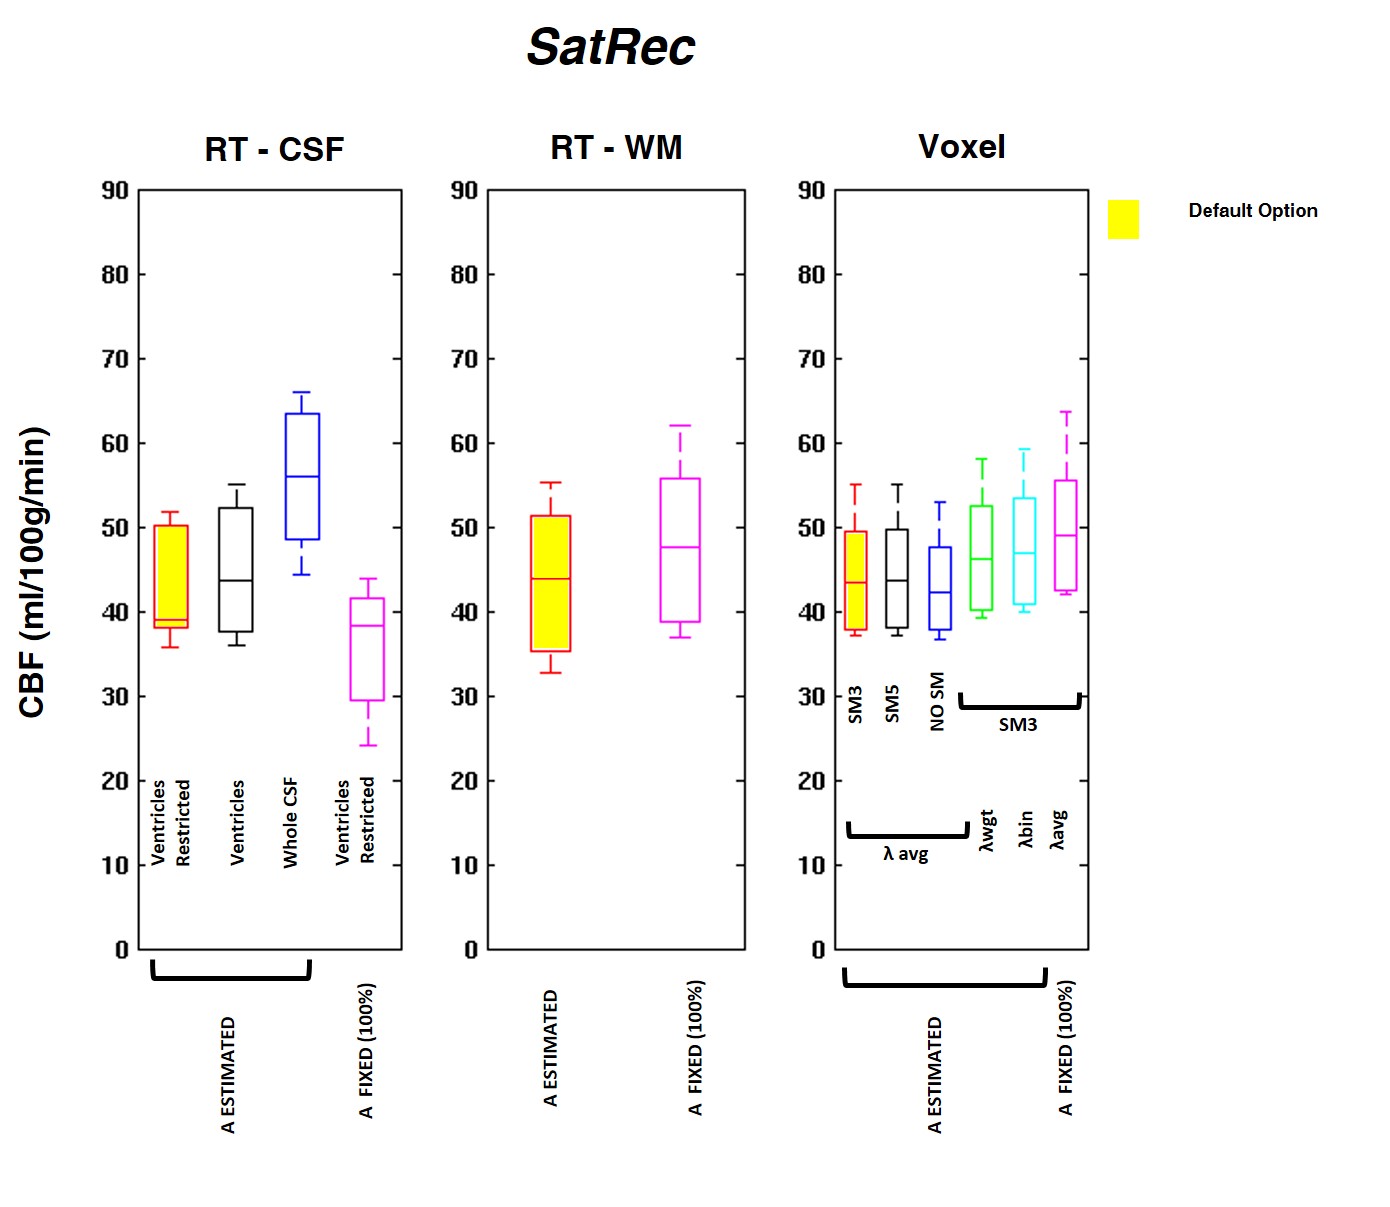
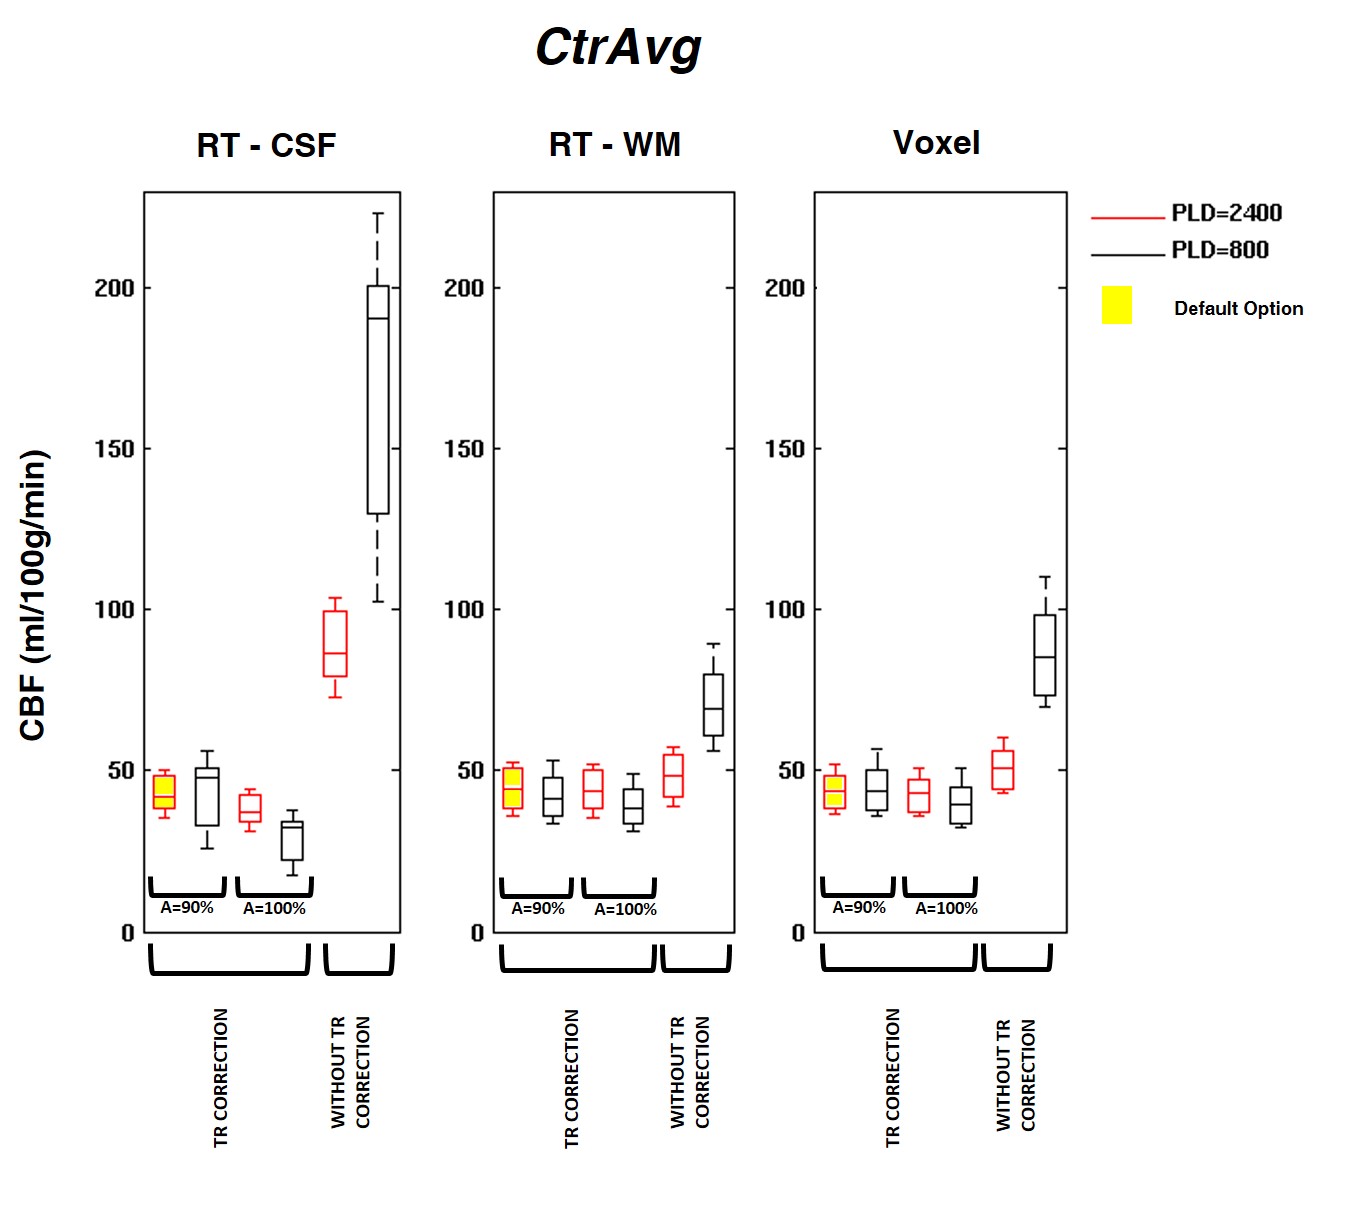
The GM CBF values obtained using the different calibration methods and processing options are depicted in Figures 1, 2 and 3. When using the default options (Fig.1), CBF values were consistent across calibration methods with only negligible differences (<5%). However, significant differences were observed when using other processing options. Using the SatRec/RF-CSF method (Fig.2), less restricted masks (ventricles/whole CSF) led to larger CBF values (5/30%). In contrast, in the SatRec/Voxel approach, different smoothing approaches only altered CBF by 2/3%. The λ value has some impact on CBF, with larger CBF (6/8%) when using weighted/binarized values. Fixing A=100%, instead of allowing its estimation, led to lower CBF values (16%) with RF-CSF and higher (8/12%) with RF-WM/Voxel. When using the CtrAvg method (Fig.3), the effects of the PLD value strongly depend on TR correction and presaturation efficiency, especially when using the RF-CSF method. In this case, no TR correction leads to higher CBF, 300/106% for short/long PLD. This effect decreased significantly if TR is corrected for but it still reached 47/13% if A=100%. When using the other methods for extrapolation of M0a, the same patterns were observed but to a much smaller extent.Conclusion
We observed that, when using default options in the calibration of ASL data, CBF results were consistent between different methods. However, applying different processing options may lead to substantial differences in CBF values, compromising the utility of absolute quantification. Overall, the RT-CSF approach was the most sensitive one to processing options in both SatRec and CtrAvg methods. The Voxel method was less sensitive and has the added advantage of intrinsically correcting for field inhomogeneities across the brain.Acknowledgements
This work was funded by FCT grants PTDC/BBB-IMG/2137/2012 and UID/EEA/50009/2013, European Union COST Action BM1103 and the EPSRC UK (EP/P012361/1).References
- Alsop, D.C., Detre, J.A., Golay, X., Günther, M., Hendrikse, J., Hernandez-Garcia, L., Lu, H., MacIntosh, B.J., Parkes, L.M., Smits, M., van Osch, M.J.P., Wang, D.J.J., Wong, E.C., Zaharchuk, G., 2015. Recommended implementation of arterial spin-labeled perfusion MRI for clinical applications: A consensus of the ISMRM perfusion study group and the European consortium for ASL in dementia. Magn. Reson. Med. 73, 102–116.
- Jain, V., Duda, J., Avants, B., Giannetta, M., Xie, S.X., Roberts, T., Detre, J.A., Hurt, H., Wehrli, F.W., Wang, D.J.J., 2012. Longitudinal Reproducibility and Accuracy of Pseudo-Continuous Arterial Spin–labeled Perfusion MR Imaging in Typically Developing Children. Radiology 263, 527–536.
- Sousa, I., Vilela, P., Figueiredo, P., 2014. Reproducibility of the quantification of arterial and tissue contributions in multiple postlabeling delay arterial spin labeling. J. Magn. Reson. Imaging 40, 1453–62.
- Cavuşoğlu, M., Pfeuffer, J., Uğurbil, K., Uludağ, K., 2009. Comparison of pulsed arterial spin labeling encoding schemes and absolute perfusion quantification. Magn. Reson. Imaging 27, 1039–45.
- Chen, Y., Wang, Z., Detre, J.A., 2011. Impact of equilibrium magnetization of blood on ASL quantification. Proc. Intl. Soc. Mag. Reson. Med 19.
- Fazlollahi, A., Bourgeat, P., Liang, X., Meriaudeau, F., Connelly, A., Salvado, O., Calamante, F., 2015. Reproducibility of multiphase pseudo-continuous arterial spin labeling and the effect of post-processing analysis methods. Neuroimage 117, 191–201.
- Chappell, M.A., Groves, A.R., Whitcher, B., Woolrich, M.W., 2009. Variational Bayesian Inference for a Nonlinear Forward Model. IEEE Trans. Signal Process. 57, 223–236.
- Chappell, M.A., MacIntosh, B.J., Donahue, M.J., Günther, M., Jezzard, P., Woolrich, M.W., 2010. Separation of macrovascular signal in multi-inversion time arterial spin labelling MRI. Magn. Reson. Med. 63, 1357–65.
Figures
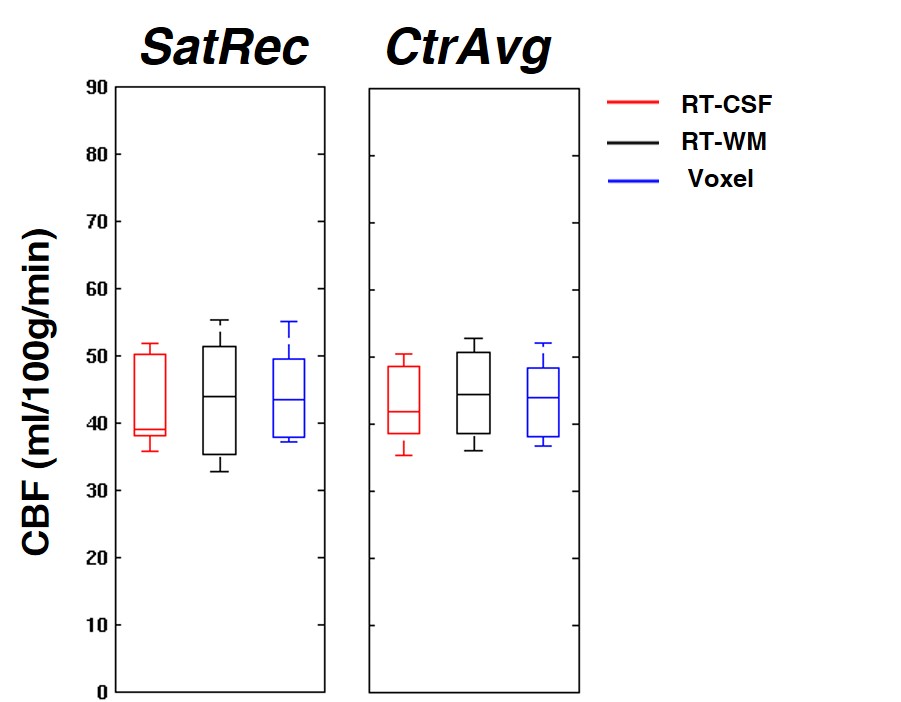
Fig. 1: CBF GM values obtained using the default options of SatRec/CtrAvg and RT-CSF, RT-WM and Voxel methods. Default options: PLD~2400ms (CtrAvg), TR correction (CtrAvg), A estimated (SatRec) and A=90% (CtrAvg), restricted mask (RT-CSF), smoothing of M0t (Voxel), water partition coefficient λ averaged (Voxel).