5525
Blood transit time heterogeneity (TTH) mapping in the human brain with multi-TI pCASL1Cardiff University Brain Research Imaging Centre, Cardiff University, Cardiff, United Kingdom, 2Wellcome Centre for Integrative Neuroimaging (FMRIB), Oxford University, Oxford, United Kingdom
Synopsis
A blood transit transit heterogeneity (TTH) mapping method is presented based on the regularised fitting of multi-TI pCASL data. The method applies a gamma variate dispersion model to account for upstream flow dispersion and tissue transit heterogeneity. The approach is shown to have sufficient sensitivity to distinguish a range of TTH times in gray matter and results are comparable with previous ROI based approaches. The mapping of TTH has the potential to be a sensitive marker for cerebrovascular dysfunction.
Introduction
The standard ASL model does not consider the effects of dispersion of the arterial input function (AIF) or flow heterogeneity in the tissue residue function in the analysis. It assumes an ideal boxcar function is produced during tagging, which is maintained until the tagged blood exchanges with the tissue. However, the AIF may be dispersed due to non-plug like flow patterns in the feeding arteries, and the multiple arteriole/capillary pathways the blood traverses before exchanging with the tissue will influence the tissue residue function. An increase in microvascular transit time heterogeneity is theorised to restrict delivery of diffusion-limited substances (such as oxygen) to the tissue 1, and appears to be elevated in a disease with cerebral-vascular involvement 2. Additionally, upstream disruption of the blood supply, for example arterial stenosis, has been shown to result in significant increases in AIF dispersion 3. Thus, a tissue measure that is sensitive to these sources of transit time heterogeneity (TTH) may be a sensitive marker for cerebral vascular dysfunction. Here we present a regularised fitting approach for the voxel-wise estimation of TTH from multi-TI pCASL data. Simulations are used to explore the sensitivity of the method and in-vivo data is acquired to demonstrate its feasibility.Methods
The kinetics of the ASL signal can be modelled by the convolution of an input function, c(t), with the tissue residue function, r(t), multiplied by the magnetization relaxation function, m(t). 4 Dispersion of the input function and flow heterogeneity in the residue function is included via convolution with a gamma variate function. Thus, the ASL kinetic model including dispersion can be described via equation 1.
$$\triangle M(t)=2M_{0b}f\left\{\left(\frac1{\beta^\alpha\Gamma(\alpha)}t^{\alpha-1}e^\frac{-t}\beta\right)\ast c(t)\ast r(t)m(t)\right\}$$
Where M0b is the equilibrium magnetization of arterial blood, f is perfusion, TTH = β/√α, the mean transit time (MTT) = αβ, and c(t), r(t) and m(t) take their normal definitions. Data fitting was performed in MATLAB (Mathworks, MA) via non-linear least squares fitting with regularisation parameters applied to MTT and TTH2/MTT2, and Gaussian smoothing applied to the perfusion data (FWHM=4.5mm). Additionally, FHWM 3.5mm smoothing was applied to the TTH maps for display. The magnitude of the regularisation parameters were chosen via a digital phantom simulation with the tSNR matched to in-vivo data (gray matter tSNR was found to be approximately 3.5 after Gaussian smoothing). ASL data was acquired from 5 volunteers (4 male, age = 35.6 ± 8.5 years). Imaging parameters: 3T Prisma scanner (Siemens, Erlangen), pCASL acquisition scheme with 2D EPI readout, pre-saturation, background suppression 5 and variable TR (minimised for each PLD). GRAPPA acceleration factor 2, 7/8 partial Fourier, 64x64 matrix, 220mm FOV, 6mm slice thickness, 35% slice gap, 16 slices, 4.8cm/s venc through-slice vascular crushing, TE = 17 ms. Eight post-labelling delays were acquired (PLDs = 150,400,650,900,1150,1400,1900,2400) with 10 repeats for a total acquisition time of 9:05 minutes.
Results and Discussion
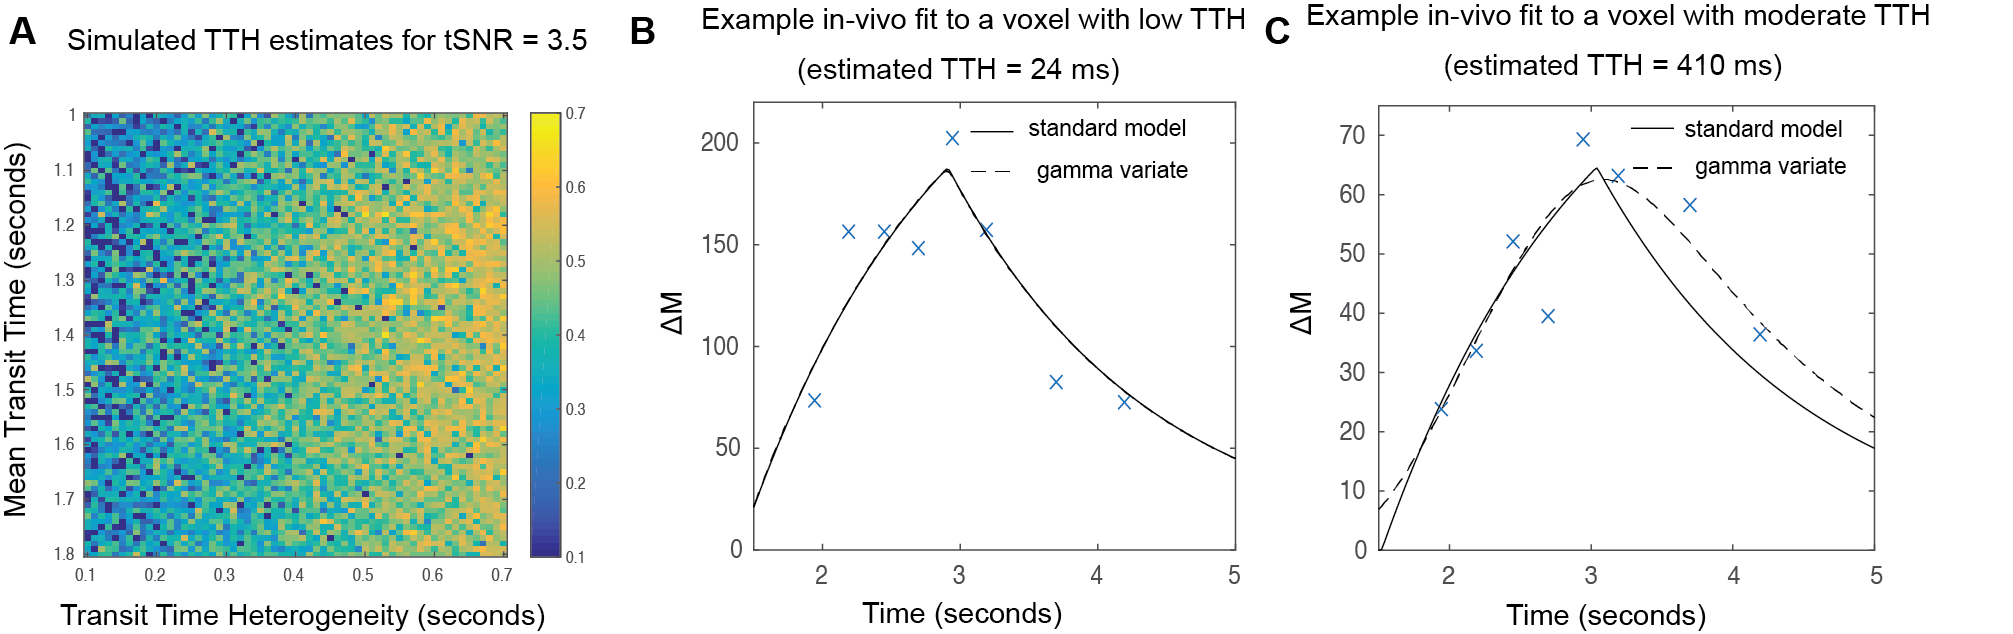
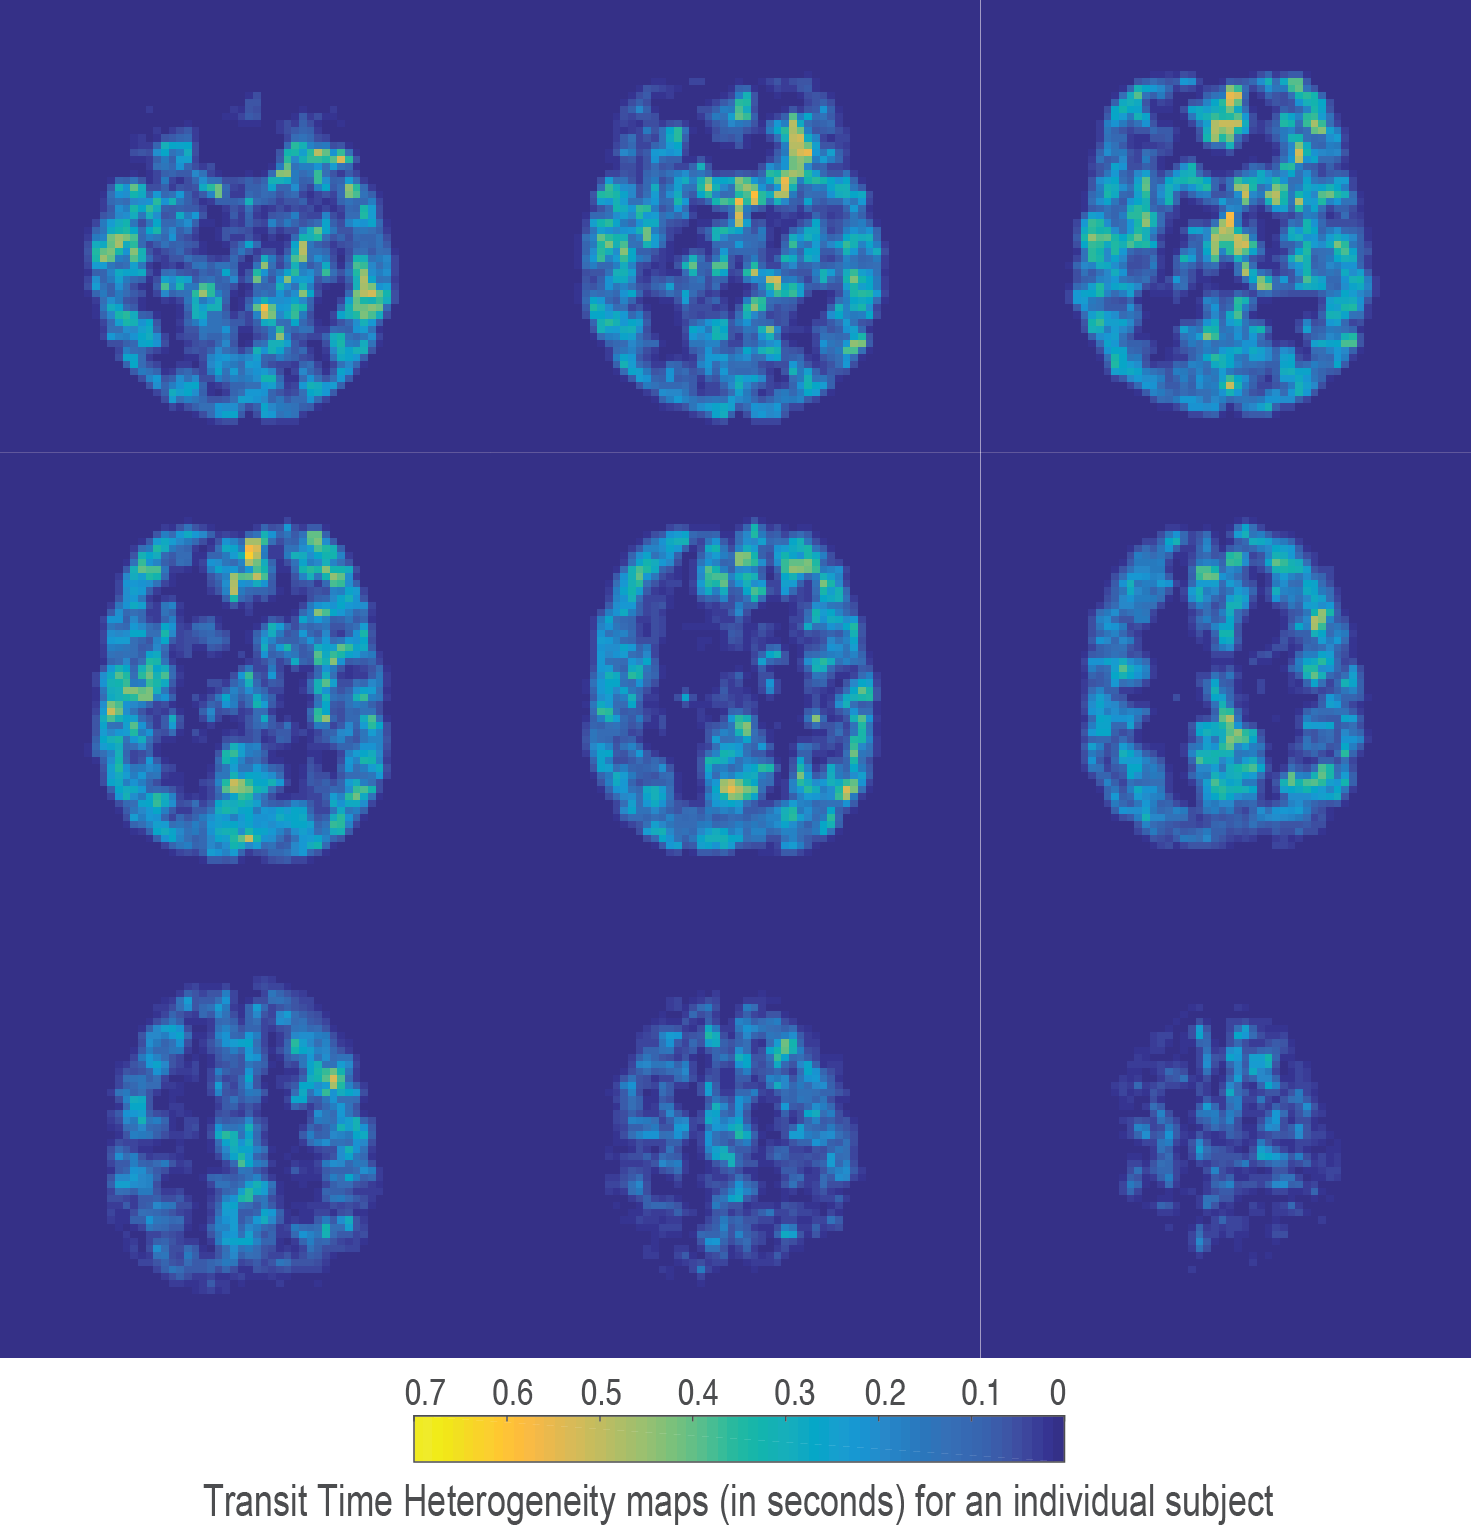
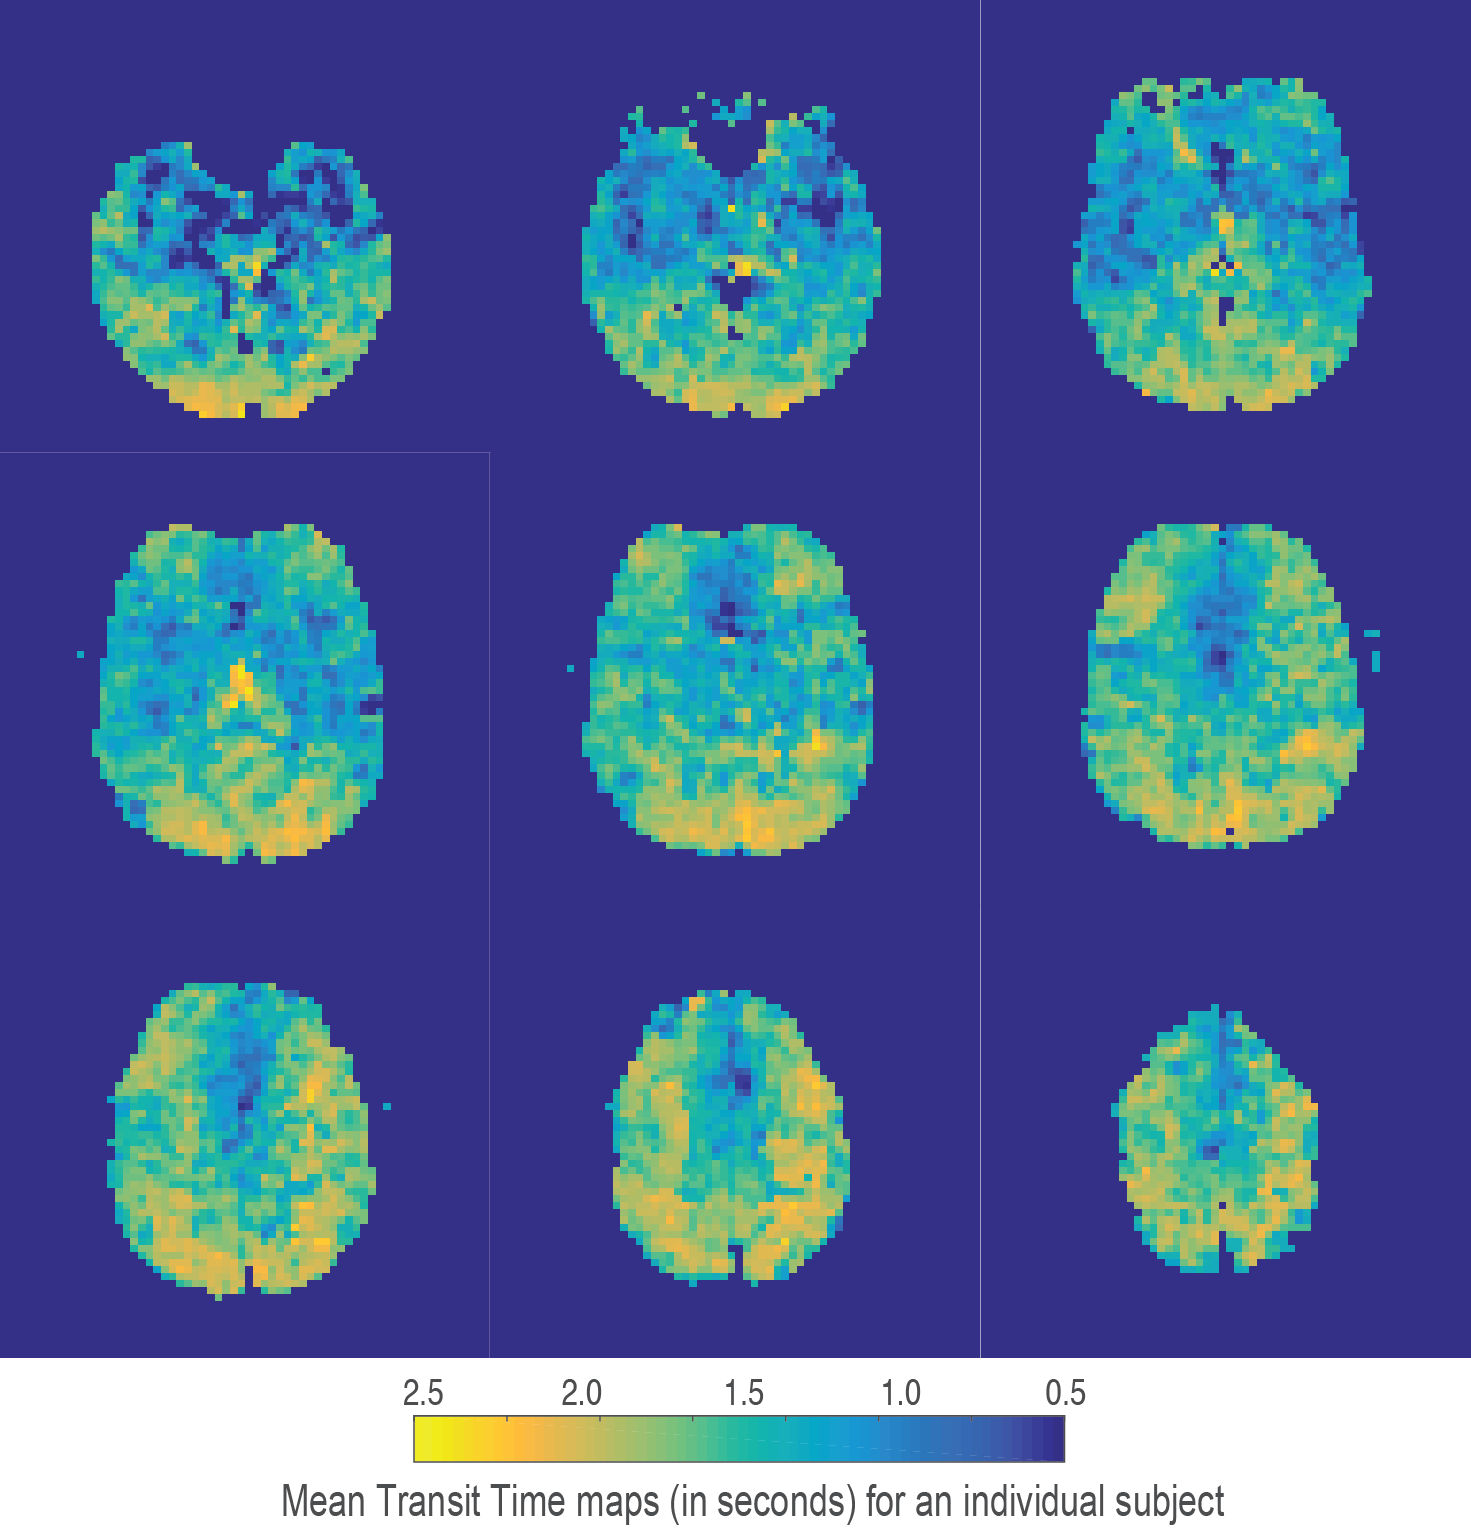
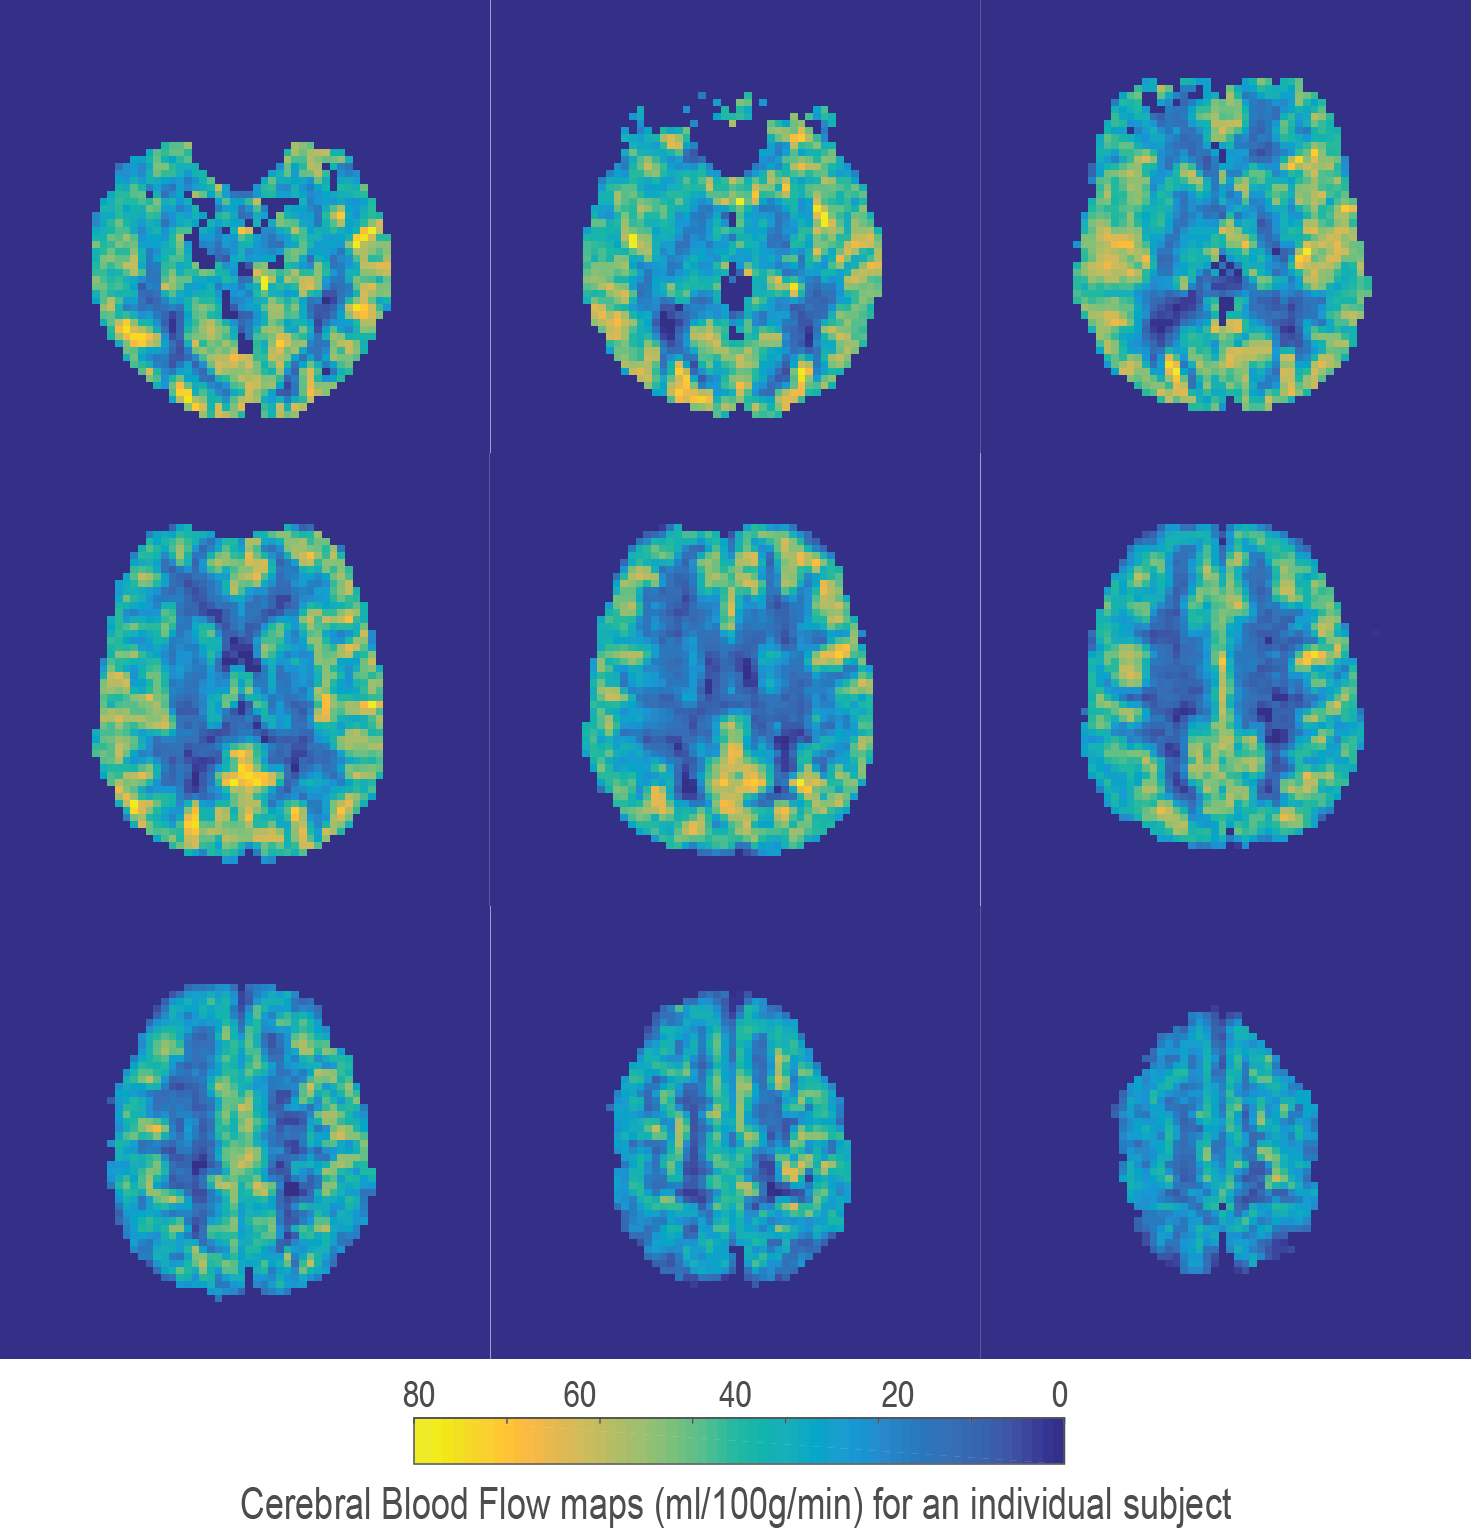
Using the chosen PLD times and regularisation parameters, digital phantom simulations predict that minimally biased estimates of TTH can be acquired with a mean error of 0.14 seconds (for MTT times from 1 to 1.8 seconds and TTH from 0.1 to 0.7 seconds), see figure 1A for a summary of simulation results. Fits to in-vivo voxels (figures 1B and 1C) demonstrate how the proposed kinetic model is identical to the standard model for minimal TTH, but is able to better capture the signal dynamics for increased dispersion. Mean gray matter values from the 5 healthy volunteers were; CBF 41.4 ± 4.2 ml/100g/min, MTT 1.41 ± 0.08 seconds, and TTH 0.25 ± 0.03 seconds. Figures 2-4 show example parameter maps from an individual subject. TTH is generally small with little variation. The small amount of transit heterogeneity detected is consistent with previous studies of ASL dispersion in healthy volunteers 6-8 and the minimal microvascular heterogeneity found in normal tissue 1.
Conclusion
Voxel-wise measurement of transit time heterogeneity has the potential to be a sensitive marker for cerebrovascular dysfunction. We have presented a regularised fitting approach that allows TTH maps to be made from standard multi-TI pCASL imaging. Simulations suggest the method is robust and sensitive to vascular changes over a reasonable range of transit times. Optimisation of the acquisition scheme for the purpose of mapping TTH could provide improvement in the sensitivity of the method, while the inclusion of locally measured AIFs could help separate upstream dispersion effects from microvascular transit heterogeneity.Acknowledgements
We would like to thank Fabrizio Fasano (Siemens Healthineers) for assistance with pulse sequence programming and the Wellcome Trust for supporting this work: Wellcome Trust Strategic Award, ‘Multi-scale and multi-modal assessment of coupling in the healthy and diseased brain’, grant reference 104943/Z/14/Z.
References
1. Larsson H, Vestergaard M, Lindberg U, Iversen H, Cramer S. Brain Capillary Transit Time Heterogeneity in Healthy Volunteers Measured by Dynamic Contrast-Enhanced T1-Weighted Perfusion MRI. J. Magn. Reson. Imaging. 2017;45:1809–1820.
2. Nielsen RB, Egefjord L, Angleys H, et al. Capillary dysfunction is associated with symptom severity and neurodegeneration in Alzheimer's disease. Alzheimers Dement. 2017 Oct;13(10):1143-1153.
3. Okell TW, Chappell MA, Schulz UG, Jezzard P. A kinetic model for vessel-encoded dynamic angiography with arterial spin labeling. Magn. Reson. Med. 2012;68:969–979.2.
4. Buxton RB, Frank LR, Wong EC, et al. A general kinetic model for quantitative perfusion imaging with arterial spin labeling. Magn. Reson. Med. 1998;40(3):383-96.
5. Okell, T.W., Chappell, M.A., Kelly, M.E., Jezzard, P. Cerebral blood flow quantification using vessel-encoded arterial spin labeling. J Cereb Blood Flow Metab 2013;33, 1716-1724.
6. Hrabe J and Lewis DP. Two analytical solutions for a model of pulsed arterial spin labeling with randomized blood arrival times. Journal of Magnetic Resonance. 2004;167:49–55.
7. Wu WC, Mazaheri Y, Wong EC. The Effects of Flow Dispersion and Cardiac Pulsation in Arterial Spin Labeling. IEEE Transactions on Medical Imaging. 2007;26(1):84-92.
8. Gallichan D, Jezzard P. Modeling the Effects of Dispersion and Pulsatility of Blood Flow in Pulsed Arterial Spin Labeling. Magnetic Resonance in Medicine. 2008;60:53–63.
Figures