5524
Reproducibility and quality assessment of a 3D-EPI Pulsed Arterial Spin Labelling scheme at 7 T in a clinical cohort1Sir Peter Mansfield Imaging Centre, University on Nottingham, Nottingham, United Kingdom, 2Division of Clinical Neurology, University on Nottingham, Nottingham, United Kingdom, 3Clinical Neurology, University of Nottingham, Nottingham, United Kingdom
Synopsis
3D-EPI arterial spin labelling (ASL) at 7T has been shown to provide advantages over 2D-EPI, however its reproducibility has not been determined. Here we assess the data quality of 7T 3D-EPI pulsed ASL data in healthy volunteers (HV) and Multiple Sclerosis (MS) patients demonstrating significantly higher temporal SNR (tSNR) in MS patients. On comparing repeats from two scans, acquired ~3 weeks apart, we observe good reproducibility of CBF estimates with a coefficient of variation of 14.7% in HVs and 12.1% in MS patients. This ASL method can be used to evaluate perfusion longitudinally in clinical cohorts.
Purpose
We evaluate the use of 3D-EPI pulsed arterial spin labelling (ASL) at 7T to provide repeatable and robust data for longitudinal clinical studies. ASL benefits from higher field strength due to the increased signal-to-noise ratio (SNR) and longer T1 relaxation time of blood and tissue. Compared to 2D-EPI ASL, a 3D-EPI readout provides increased spatial coverage, increased SNR, and has lower SAR, with the benefit of having each slice acquired at a consistent PLD and thus background suppression time1. We employ this protocol in repeat scans of healthy volunteers (HV) and patients with Multiple Sclerosis (MS) to determine its feasibility for clinical studies.Methods
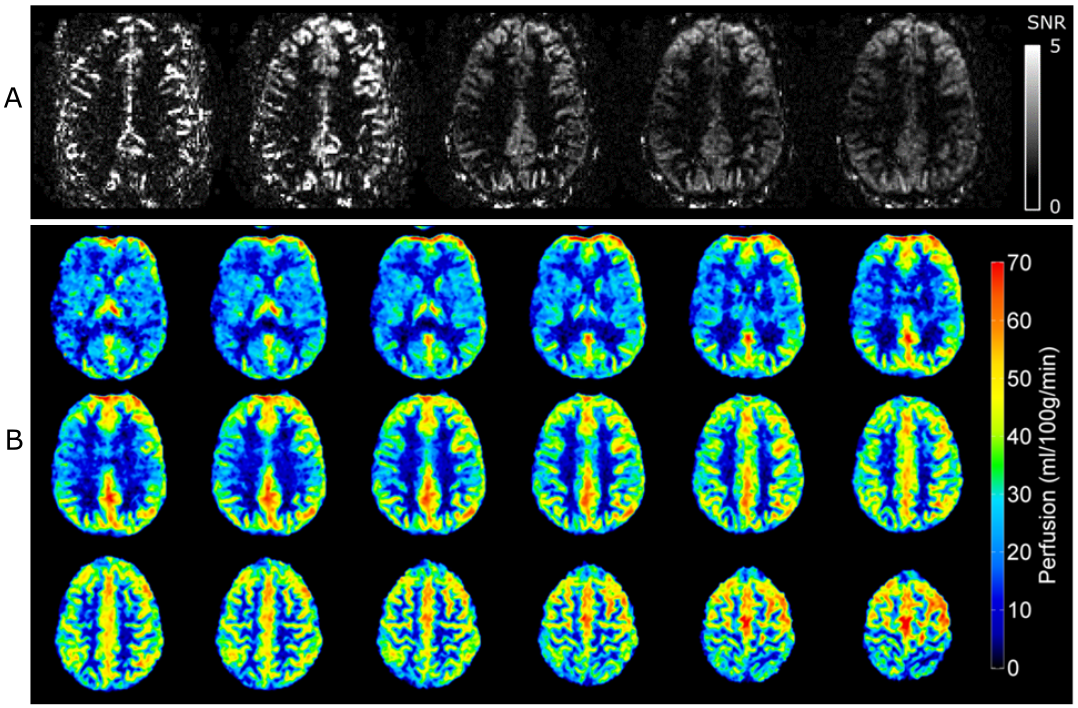
MR Acquisition: 8 healthy volunteers (2 males, 6 females, mean age of 40±9y) and 12 MS patients (5 males, 7 females, mean age of 38±8y) were scanned a median of 22 days apart on a 7T Phillips Achieva scanner with a 32-channel receive coil. FAIR ASL data were acquired using a single-shot 3D-EPI readout (spatial resolution=2×2×3mm3, 18 slices, TE/TR=15/42ms, flip angle=14°, SENSE=2 (in FH and AP), selective/non-selective width=50/300mm). The bottom of the axial imaging volume was aligned with the ACPC line. Five ASL scans were acquired at post-label delays (PLDs) of 700 and 1000ms (21 label-control repeats each), and 1300, 1600 and 1900ms (43 label-control repeats each). An M0 map using the same imaging parameters was acquired for CBF calibration. Inversion recovery data were acquired to compute a T1 map for segmentation. Data analysis: The T1 map was segmented (FSL, FAST2) to obtain a grey matter (GM) mask. ASL data for each PLD were motion corrected (FSL, MCFLIRT3) and co-registered, and perfusion-weighted images (PWI) were created by subtracting label-control image pairs. Temporal SNR (tSNR) maps were calculated, defined as the mean PW signal divided by the standard deviation for each PLD (Fig.1.A). The median tSNR value within the GM mask and for each slice was computed. After discarding outlying PWIs associated with large head movements4, perfusion values were calculated by combining ASL data from all PLDs (FSL BASIL5 using spatial priors6 and fit for microvascular components7), and calibrated using the M0 image8 to yield quantitative perfusion maps in ml/100g/min (Fig.1.B). The mean GM perfusion and the coefficient of variation (CoV) between scanning sessions was calculated.Results
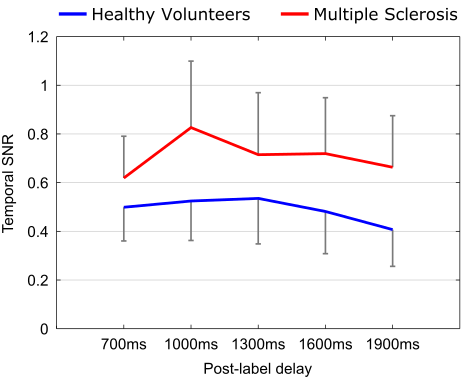
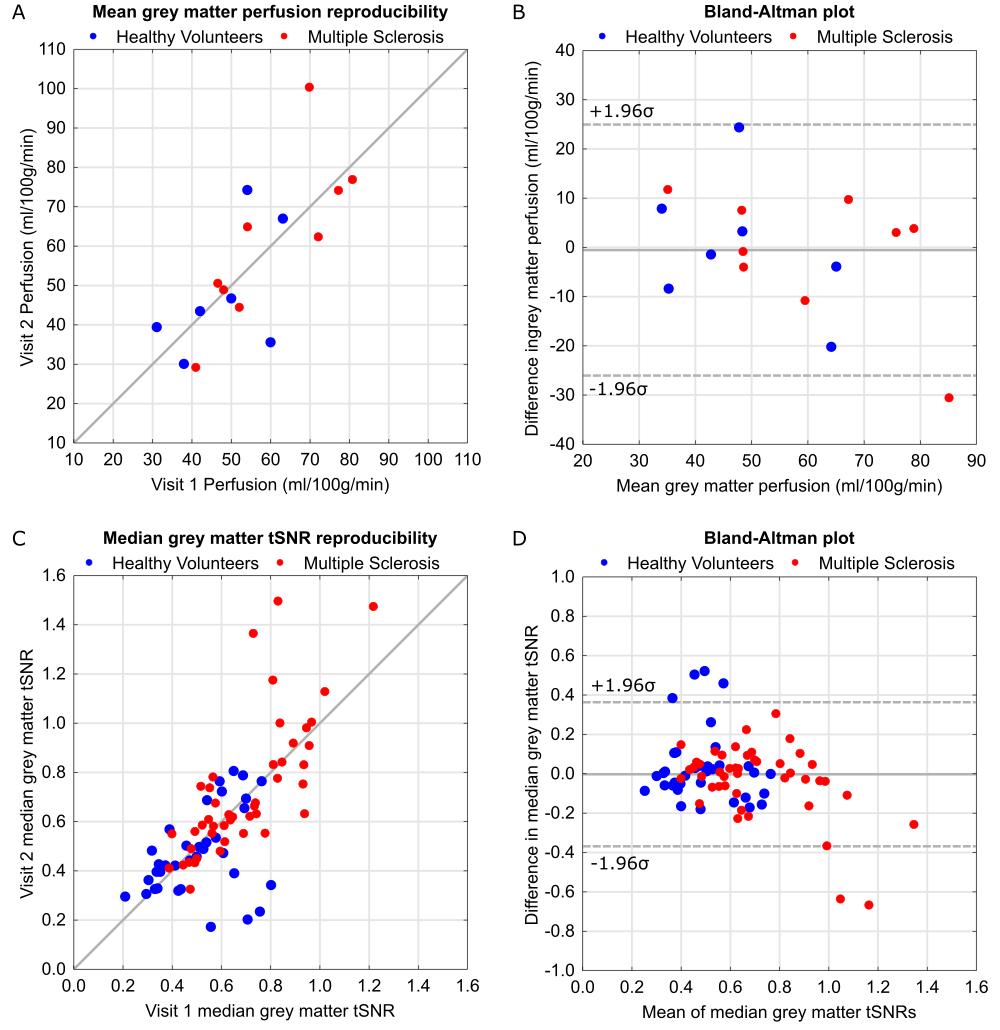
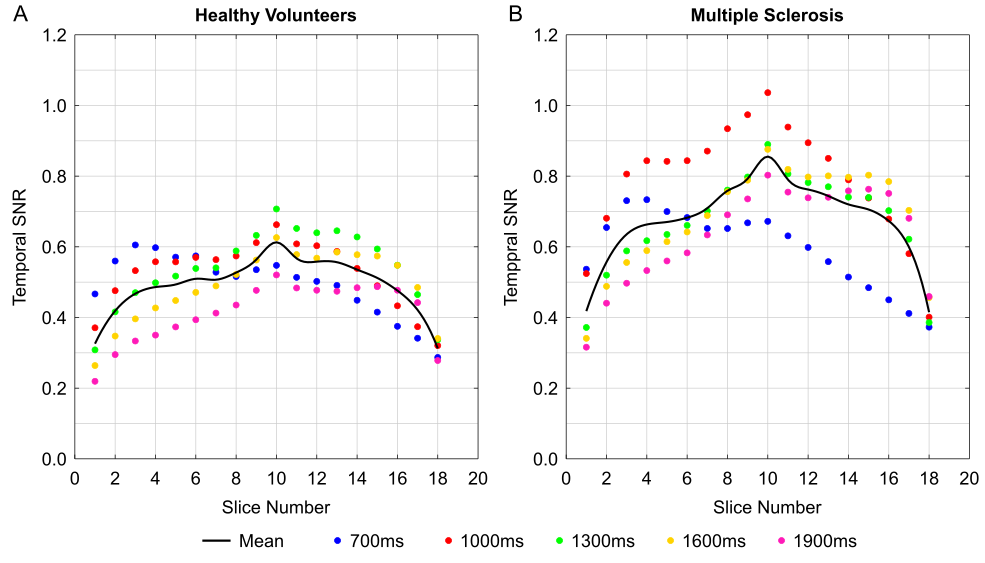
Data from 3 MS patients and 1 HV were discarded due to either severe head motion or coil constraints in individuals with larger head sizes[BM1] . An example perfusion map and GM tSNR map for each PLD are shown in Fig.1; SNR was significantly higher for all PLDs in the MS group compared to the HV group (p<0.05, un-paired t-test, two-tailed, Fig.2). Shown in Fig.3, significant correlation was observed between the GM perfusion values across visits (r=0.75, p=8×10⁻⁴), and the CoV of GM perfusion was 18.7±21.4% (HV) and 11.3±10.4% (MS). tSNR of individual PLD scans also significantly correlated between visits (r=0.71, p=1×10-13) with CoV of 14.7±12% (HV) and 10.7±8.79% (MS). When tSNR is assessed slice-by-slice, it is consistent across the central slices with only minimal loss on the upper and lower slices. (Fig.4).Discussion
Mean GM perfusion can be successfully acquired and reproduced using a 3D-EPI FAIR ASL scheme at 7T in both HV and MS groups. The observed CoV for both cohorts falls below 20%, which is the expected variability observed between-session using 3T ASL data using the same labelling scheme9. The smaller CoV and significantly increased tSNR in the MS group potentially reflects greater familiarity with the scanner environment.Conclusion
ASL data can be repeatedly acquired at 7T with high resolution and good coverage using a 3D-EPI readout, with the benefit of having each slice acquired at the same PLD with similar tSNR. This acquisition protocol is appropriate for longitudinal studies of perfusion changes in MS.Acknowledgements
This work was funded by the Medical Research Council.References
[1] Hall et al., (2010) ISMRM P. 517.
[2] Zhang et al., (2001) Trans. Med. Imag. 20(1), P. 45-57.
[3] Jenkinson et al., (2002) NeuroImage, 17(2), P. 825-841.
[4] Tan et al., (2009) J Magn Reson Imaging 29(5), P. 1134-1139.
[5] Cavusoglu et al., (2009) Magn Reson Imaging 27(8), P. 1039-1045.
[6] Chappell et al., (2009) IEEE Trans. Sig. Process 57(1), P. 223-236.
[7] Groves et al., (2009) Neuroimage 45(3), P. 795-809.
[8] Chappell et al., (2010) Magn Reson Med 65(3), P. 1365-2010.
[9] Gevers et al., (2011) J Cereb. Blood Flow Metab. 31(8), P. 1706-1715.
Figures