5523
ASL meets Machine Learning: Classification of type-2 diabetes and normoglycemia using ASL-derived cerebral hemodynamic features.1Academic Unit of Radiology, University of Sheffield, Sheffield, United Kingdom, 2Neuroimaging in Cardiovascular Disease (NICAD) Network, University of Sheffield, Sheffield, United Kingdom, 3Psychology Department, University of Sheffield, Sheffield, United Kingdom, 4Academic Unit of Diabetes and Endocrinology, University of Sheffield, Sheffield, United Kingdom, 5Department of Computer Science, University of Sheffield, Sheffield, United Kingdom
Synopsis
QUASAR ASL is an arterial transit time insensitive perfusion imaging technique which can be used to unravel hemodynamic patterns. This study evaluates cerebral perfusion hemodynamics using QUASAR in patients with type-2 diabetes mellitus (T2DM) and normoglycemic controls. In addition to standard perfusion parameters, multiple metrics were extracted from five QUASAR-derived curves pre and post acetazolamide injection both globally and locally, from regions adjacent to major vascular territories. Following feature reduction, a binary classification task was performed (normoglycemia vs. T2DM). Necessary steps were undertaken to reassure that the observed results were not due to overfitting. The achieved classification accuracy was 95%.
Introduction
Type-2 diabetes mellitus (T2DM) is a prevalent disease and causes numerous complications such as nephropathy, neuropathy, retinopathy and cardiovascular problems. Brain imaging has shown significant structural changes in the diabetic brain. However, the cause of such drastic changes and importantly whether it is related to impaired brain perfusion is unclear with contradictions rife in the literature [1]. A potential explanation of the contradictory findings might be the lack of a gold standard for perfusion assessment.
Quantitative STAR labeling of arterial regions (QUASAR) arterial spin labeling (ASL) allows for the assessment of multiple parameters including cerebral blood flow (CBF), arterial blood volume (aBV) and arterial transit time (ATT) [2]. Additionally, this multi-inversion time technique allows for acquisition of hemodynamic curves such as the arterial input function (AIF). This study aims to extract numerous metrics from multiple hemodynamic curves along with standard perfusion metrics and evaluate their discriminatory capacity in a binary classification task of T2DM vs normoglycemic healthy volunteers (HV).
Methods
Data were acquired from 25 HV and 15 subjects with T2DM. Two QUASAR ASL scans were acquired; one at baseline and one following acetazolamide administration (vasodilating stimulus), to assess cerebrovascular reactivity (CVR). Data were processed using a previously presented pipeline whereby AIF assignment takes place using local AIF weighting [3]. Vascular territory masks were used to extract localized measurements. Data were extracted from the whole brain and from four ROIs adjacent to: anterior cerebral artery (ACA), middle cerebral artery (MCA), posterior cerebral artery (PCA) regions and watershed areas (W). The extracted standard metrics were CBF, ATT and aBV. Additionally, the time-to-peak (TTP), peak, full-width half maximum (FWHM), average signal power (BP), skewness (SKEW), kurtosis (KURT), half width half maximum left (HWL) and right (HWR) were determined from each anatomical ROI using the following curves: final AIFs (AIF) (following AIF weighting), residue function (RES), tissue signal (ΔMcr), mixed arterial-tissue signal (ΔMncr) and initial AIF shape (ΔMncr-ΔΜcr) - AIFSH.The adopted approach for feature reduction and classification was as follows [4]: t-tests were used to perform an initial feature reduction keeping the significant features (p < 0.05); subsequent support vector machine recursive feature elimination (SVM-RFE) was performed 40 times leaving out one subject every time [5] in order to retain the most influential features in the correct classification of a subject. Features scoring in the top-5 in the SVM-RFE task were kept each time and used for the final classification. For the classification task, linear SVM was used with a 5-fold cross validation. In order to account for overfitting additional to the 5-fold cross validation, random classes were assigned to every individual and the same feature extraction and classification procedure was followed. This step was performed five times in order to monitor whether the classification performance could be attributed to noise resulting from low sample size.
Results
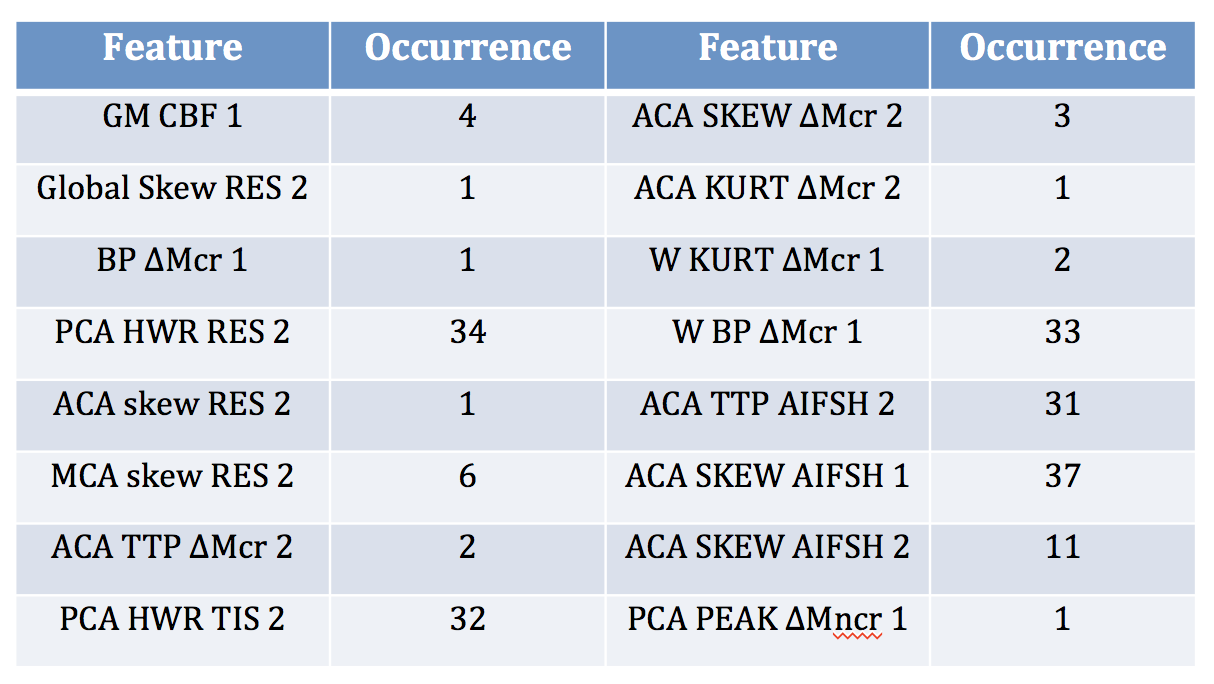
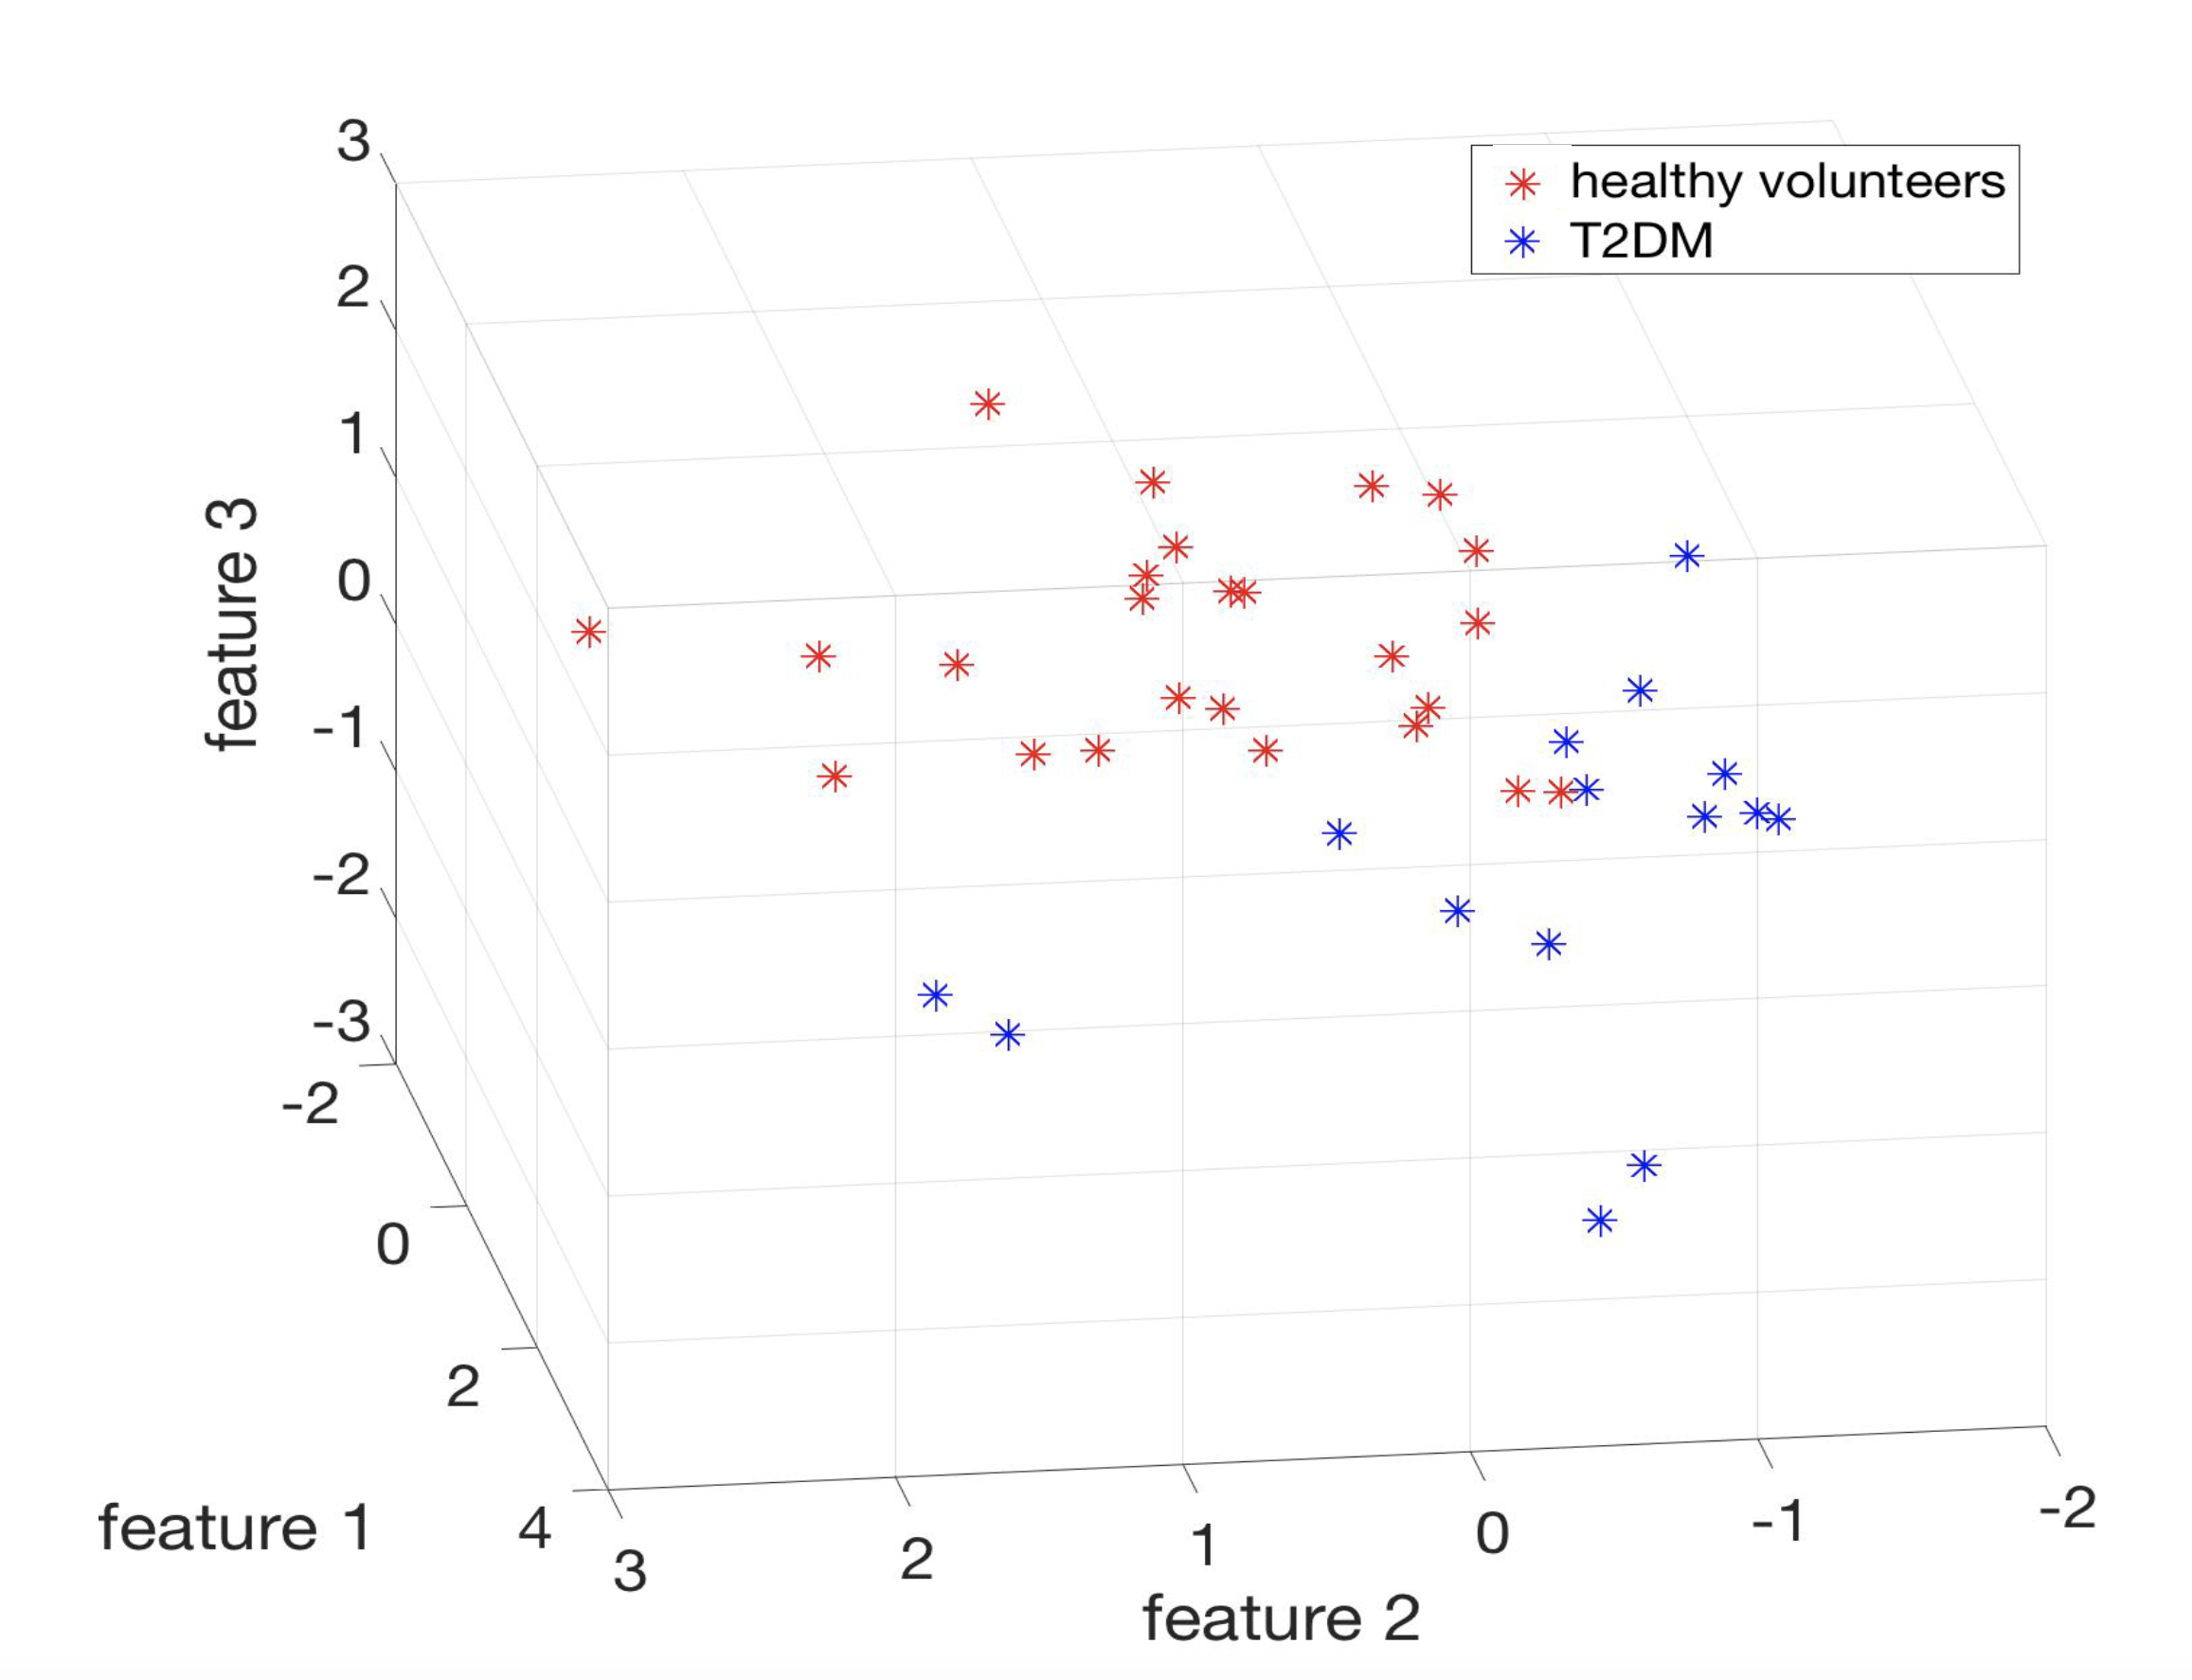
A total of 353 features were extracted and were used in the machine learning pipeline along with age (total 354). The t-tests identified 127 significant features. Following the SVM-RFE implementation and retention of features scoring at least once in the top-5, 16 features were retained. These features were used as an input to linear SVM. The classification accuracy was 95%. The identified features are tabulated (Table 1). Based on the three most frequently occurring features, clusters can be visually identified (Figure 1). The results for the random classes task were as follows: mean feature number following t-tests: 15.8±16.8, mean retained features after SVM-RFE: 8.6 ± 6.3, mean classification accuracy: 60.9±8.3%.Discussion and Conclusions
It has been shown that the extraction of additional metrics from the acquired QUASAR ASL curves provides information pertaining to the differentiation between HV and T2DM patients. The most significant features were the additional parameters extracted from the acquired hemodynamic time-curves and baseline GM CBF. The machine learning approach tried to address the ‘curse of dimensionality’ in an attempt to avoid overfitting.
QUASAR ASL provides rich information compared to other ASL implementations since the 3 signals associated with the system-voxel (input, transfer function, output) are either acquired or can be determined. Quantification of the described metrics is not time-consuming and can be used in order to unravel non-physiological hemodynamic patterns in pathological conditions which are not apparent in perfusion parameters that are typically quantified. In this implementation, we demonstrated that there is actually an impaired hemodynamic pattern in T2DM which can be monitored using the acquired QUASAR ASL-derived curves in combination with a machine learning feature reduction strategy.
Acknowledgements
No acknowledgement found.References
1. Brundel, M., L.J. Kappelle, and G.J. Biessels, Brain imaging in type 2 diabetes. European Neuropsychopharmacology, 2014. 24: p. 1967--1981.
2. Petersen, E.T., T. Lim, and X. Golay, Model-free arterial spin labeling quantification approach for perfusion MRI. Magnetic Resonance in Medicine, 2006. 55(2): p. 219-232.
3. Dounavi, M.-E., et al. Validation of an ASL processing pipeline accounting for low SNR and the presence of an EPI artifact, using simulated and real data. in Intl Soc Mag Reson Med. 2017. Honolulu, Hawaii, USA.
4. Zacharaki, E.I., et al., Classification of brain tumor type and grade using MRI texture and shape in a machine learning scheme. Magn Reson Med, 2009. 62(6): p. 1609-18.
5. Rakotomamonjy, A., Variable Selection Using SVM-based Criteria. Journal of Machine Learning Research, 2003. 3: p. 1357-1370.
Figures