5522
Can ve be larger than one? A modification for asymmetric vascular permeability in Toft’s model may reveal glymphatic dysfunction in tumor1Department of Biomedical Engineering and Environmental Sciences, National Tsing Hua University, Hsinchu, Taiwan, 2Nuclear Medicine, Chang Gung Memorial Hospital, Linkou, Taiwan, 3Department of Automatic Control Engineering, Feng Chia University, Taichung, Taiwan, 4China Medical University Graduate Institute of Cancer Biology, Taichung, Taiwan
Synopsis
The ve is limited between 0 and 1 by definition. However, we observed large ve when fitted the Toft’s model or its modified version to both Gd-DTPA and D2O perfusion MRI. In this study, we modified the ve to Pas*ve to incorporate the asymmetry permeability into model. Therefore, the region with high Pas*ve in D2O perfusion imaging may be attributed to the blocked pathway of water draining, which could be correlated to glymphatic dysfunction in tumor.
Introduction
The Toft’s model and its modified version are widely used for DCE MRI. The ve parameter was recognized as a fractional volume of extravascular extracellular space (EES), and theoretically ranged between 0 and 1. [1, 2] The tissue concentration time course follows this equation:
dCt(t))/dt=Ktrans*Cp(t)-(Ktrans/ve)*Ct(t)
The permeability of vessel is assumed symmetry, therefore the outflux transfer constant equals to the influx transfer constant divided by volume fraction. The dividing of ve is to calculate the true concentration in the EES space. This assumption of symmetry permeability is widely accepted for DCE MRI using Gd based contrast agent, and also used in D2O perfusion MRI. [3] However, we sometimes calculated very large ve in tumor, which means that the outflux may be much smaller than the influx. We anticipated that the assumption of symmetry permeability may need a modification. Therefore, we aimed to study the ve in tumor by DCE MRI and D2O perfusion MRI on small animal.
Materials and Methods
ALTS1C1 tumor cells prepared by cell culture medium containing 10% fetal bovine serum (FBS), which would grow glioma in mouse brain. 105 cells/mL of ALTS1C1 cell (~2μL) was intracerebrally inoculated into C57BL/6J mice (N=9, weight:18~30g). After fourteen days of tumor growth, MRI scanning were performed. Mice were scanned under 3% isoflurane anesthesia with oxygen on 7T Bruker Clinscan scanner. Isotonic D2O contained 0.9% w/w NaCl with 2mL/100g dose was administered through tail vein within 20s with syringe pump. Turbo spin-echo (TSE) was used to dynamically scan. Imaging parameters were: TR/TE=1000/14ms, turbo factor=8, matrix size=128*64, FOV=20mm, 6 slices with thickness=1mm, measurement=120, temporal resolution=9s. After using D2O as contrast agent, Gd-DTPA with 0.2mmol/Kg dose was subsequently implemented scanned with 2D-FLAIR. Imaging parameters were: TR/TE= 4.9/1.97ms, FA=20, matrix size=128*128, FOV=20mm, 3 slices with thickness=1mm, measurement=160, temporal resolution=2.2s.Result
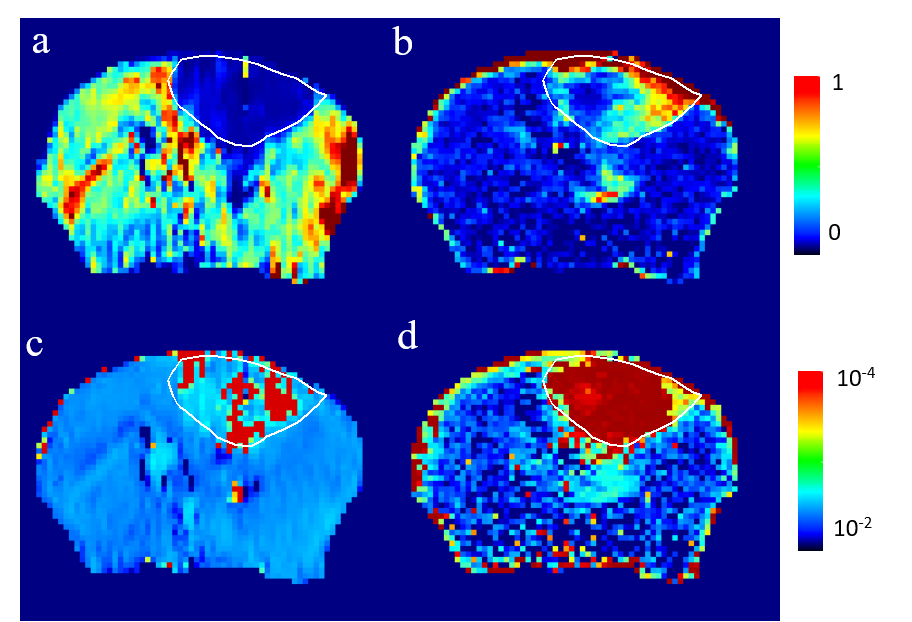
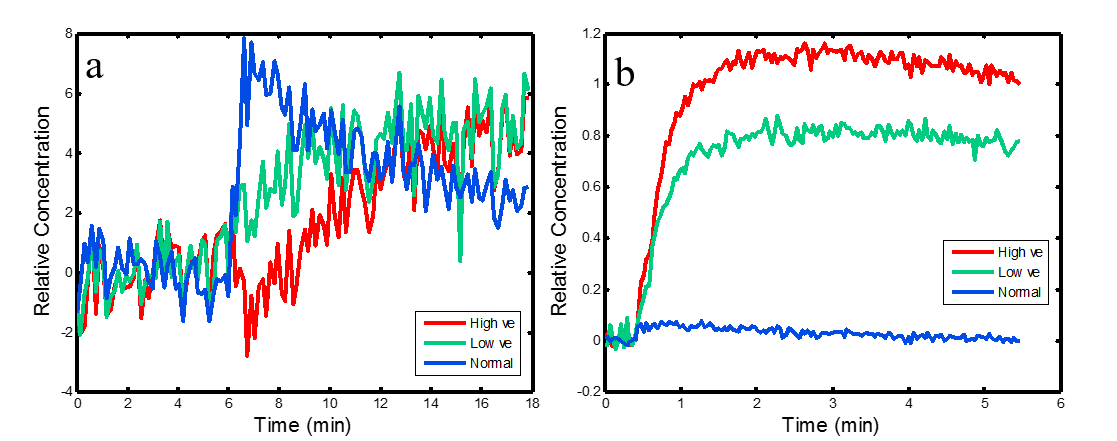
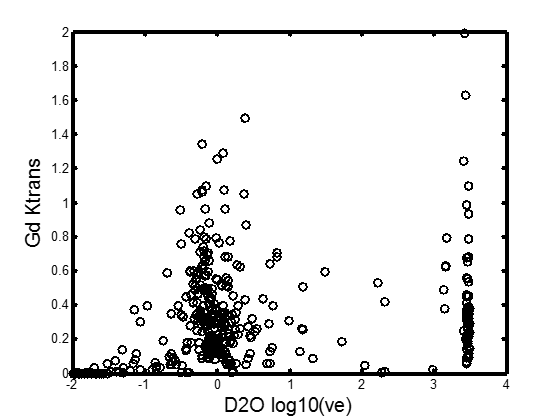
In fig.1, we showed one of our mice with sizable tumor, where large ve was found for both Gd-DTPA and D2O. Inside the tumor, the Ktrans of Gd-DTPA (upper right) was positively enhanced by the leakage of Gd-DTPA contrast agent, while the Ktrans of D2O (upper left) was negatively enhanced by the reduced blood flow. The ve of Gd-DTPA (lower right) was significantly larger than 1 inside the tumor, and the ve of D2O (lower left) also showed large intensities inside. In fig.2, we average the concentration time course of high ve, low ve, and normal tissue for D2O (fig. 2a) and Gd-DTPA (fig. 2b). For D2O, the time course of high ve is delayed and continuously increasing, while the time course of low ve increased at the same time with normal tissue until reached a plateau. For Gd-DTPA, the concentration time of both normal and low ve tissue declined after a maximum value, while the concentration time of high ve keep increasing to a stable height. Ktrans of Gd-DTPA and ve of D2O showed the heterogeneity inside the tumor. In fig. 3, we plotted a scatter plot of these two parameters from the pixels inside the tumor. No significant correlation was observed, and two peak was found on the logarithmic axis.Discussion
The Ktrans of D2O is dominated by flow, and the flow inside the tumor were slower than in normal area. [4] In the Ktrans map of Gd-DTPA , there were obvious variations of the Ktrans inside the tumor due to the vascular heterogeneity of angiogenesis. The values of ve are higher than one, which is inconsistent with the definition of ve. In the ve map of D2O, ve in the tumor region are substantially higher than one. In fig.2, the pixels with high ve accumulated the tracer continuously after injection, and hardly flow out. Therefore, the permeability should be modified to asymmetric permeability. The fraction ve could be changed to Pas*ve, which lead to:
dCt(t))/dt=Ktrans*Cp(t)-(Ktrans/(ve*Pas))*Ct(t)
in which the parameter Pas is asymmetric permeability ratio. Furthermore, the D2O is supposed to be drained out by the outflux pathway of water, which is correlated the glymphatic system. Therefore, the high ve of D2O may represent that the draining pathways of water were blocked. Consequently, the variations of Pas*ve inside the tumor could be attributed to a “glymphatic heterogeneity” phenomenon, and it is not correlated to the vascular heterogeneity. In addition, the high ve region are most likely the necrotic region, because of the delayed wash-in of the contrast agent. we speculate that this necrotic region is accompanying with glymphatic dysfunction simultaneously.
Acknowledgements
No acknowledgement found.References
(1) PS Tofts and AG Kermode. Magnetic Resonance in Medicine 17:357-367 (1991).(2) SP Sourbron and DL Buckley. NMR in Biomedicine 26:2004:1027 (2013).
(3) Fu-Nien Wang et al. NMR Biomed. ;26: 692–698 (2013).
(4) Pei-Lun Yu, et al. Intl. Soc. Mag. Reson. Med. 14 (2017) .
Figures