5521
Imaging ocular water inflow in the mouse with deuterium oxide MRI1Ophthalmology, University of Texas Health Science Center, San Antonio, TX, United States, 2Research Imaging Institute, University of Texas Health Science Center, San Antonio, TX, United States, 3Biomedical Engineering, University of Texas at San Antonio, San Antonio, TX, United States
Synopsis
Abnormal intraocular fluid flow or clearance is involved with a variety of eye diseases such as diabetic retinopathy, but there is a lack of non-destructive methods to assess the permeability directly of water in the eye. In this study we investigate the feasibility of different MRI sequences for direct imaging of deuterium oxide inflow in the mouse eye. Balanced steady state free precession provided high signal to noise ratio for imaging deuterium oxide in the intraocular fluid, providing dynamic imaging of intraocular water inflow.
Purpose
MRI can be used to measure the permeability of water using deuterium oxide (2H2O) as a tracer. Abnormal intraocular fluid flow or clearance is involved with a variety of eye diseases such as diabetic retinopathy, for which 2H2O MRI could potentially be applied to assess intraocular fluid exchange. In this study we investigated direct dynamic imaging of 2H2O inflow in the mouse vitreous. The signal to noise ratio of different MR sequences for 2H2O imaging was also investigated.Methods
MRI was performed at 7T with 1500mT/m gradient (Bruker) with a double 1H (6mm) / 2H (10mm) surface coil transceiver. Most scans used 3D balanced steady state free precession (bSSFP) with: TE/TR=4/8 ms, field of view (FOV)=25.6x25.6x24mm, and matrix=64x64x16. 3D FLASH scans were acquired with the same geometry and TE/TR=3.14/175ms. 2D RARE scans were acquired with TE/TR=26/2000ms, echo train length=4, FOV=25.6x25.6mm, matrix=64x64, and one slice with thickness=1.5mm.
Mice (male C57BL/6J, 31-36g) were anesthetized with isoflurane. 99.9% 2H2O was mixed with 0.9% sodium chloride and injected by tail vein. 2H2O was given either by multiple infusion periods (0.833ml/kg/min over 10min, 3 repeats per animal, n=4) or by multiple boluses (5ml/kg bolus given over 45s, 4 repeats per animal, n=3). For analysis, the whole vitreous signal was summed, normalized by average mouse vitreous volume, then normalized by two reference tubes of known 2H2O concentration place to the sides of the eye. For bolus data the wash-in rate (linear fitting) and area under the curve were calculated, after the pre-injection baseline was subtracted for each bolus period to normalize the baseline to zero.
Results
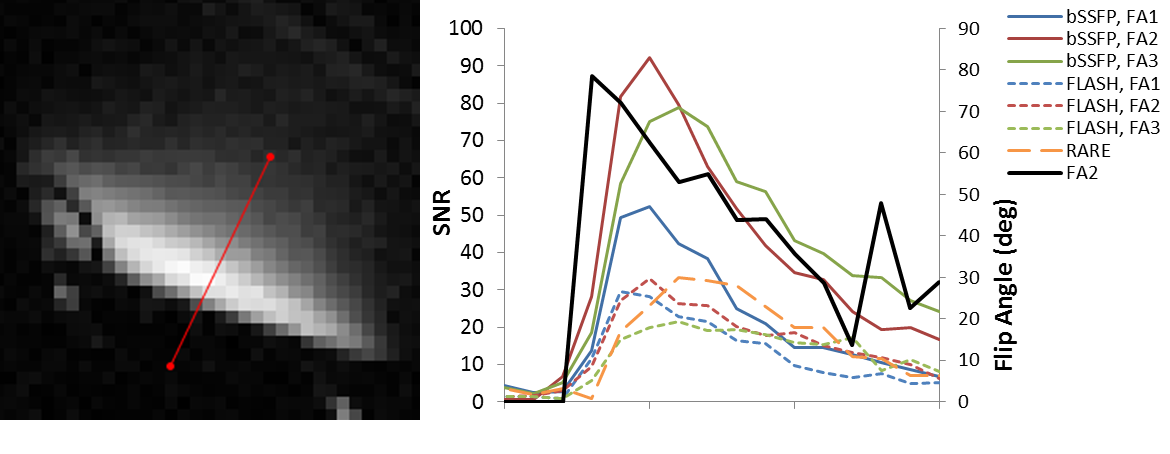
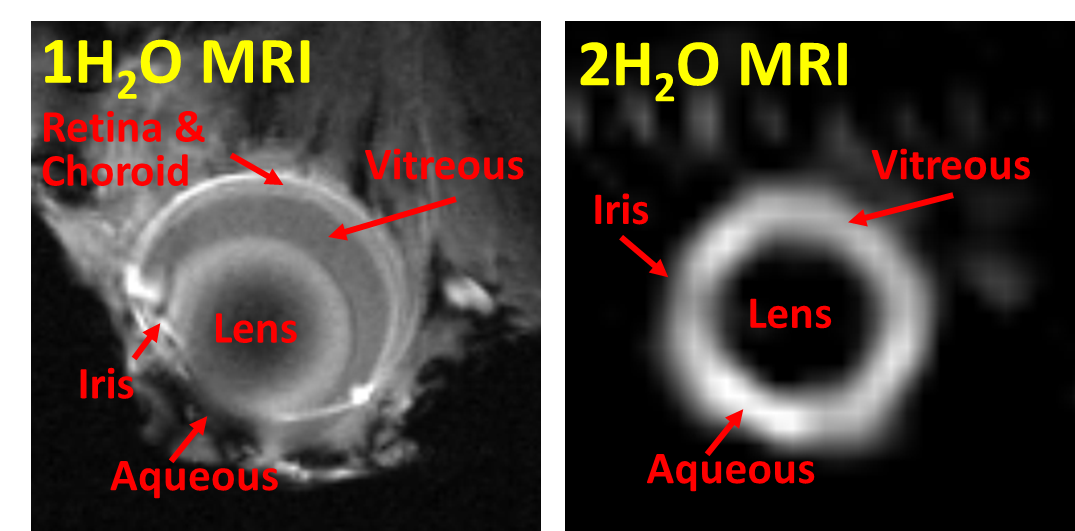
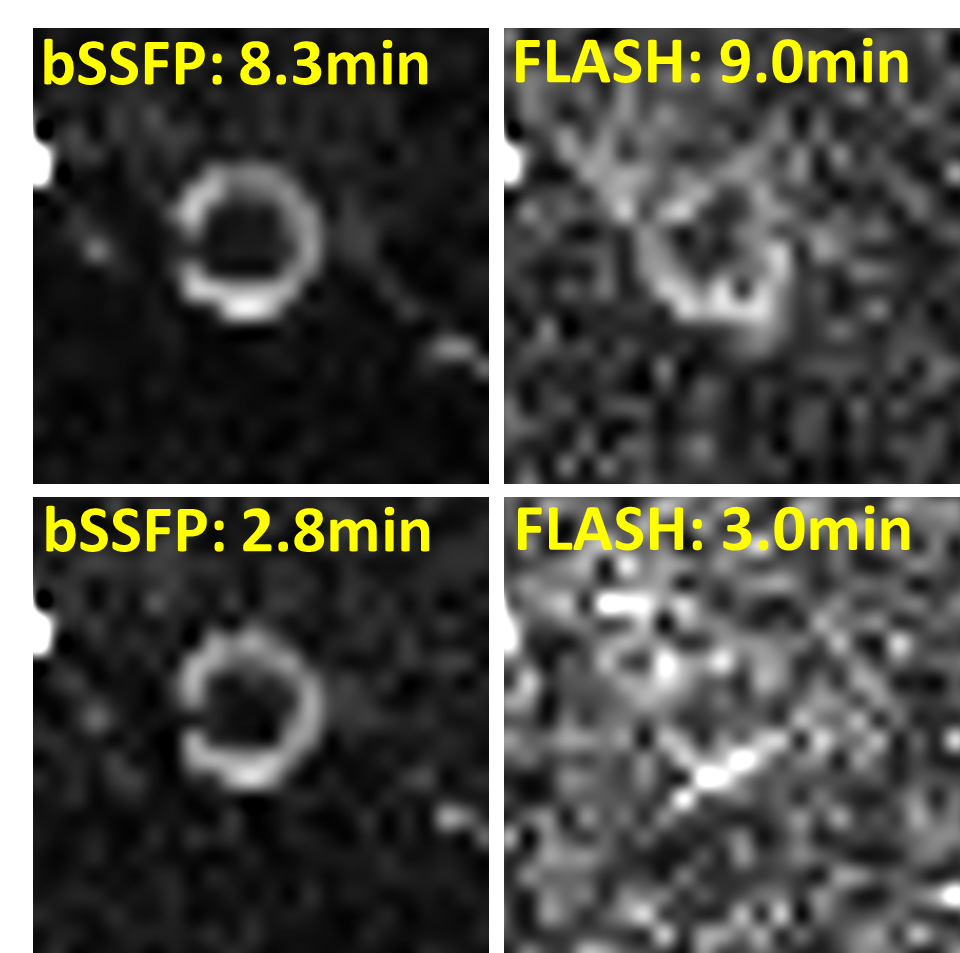
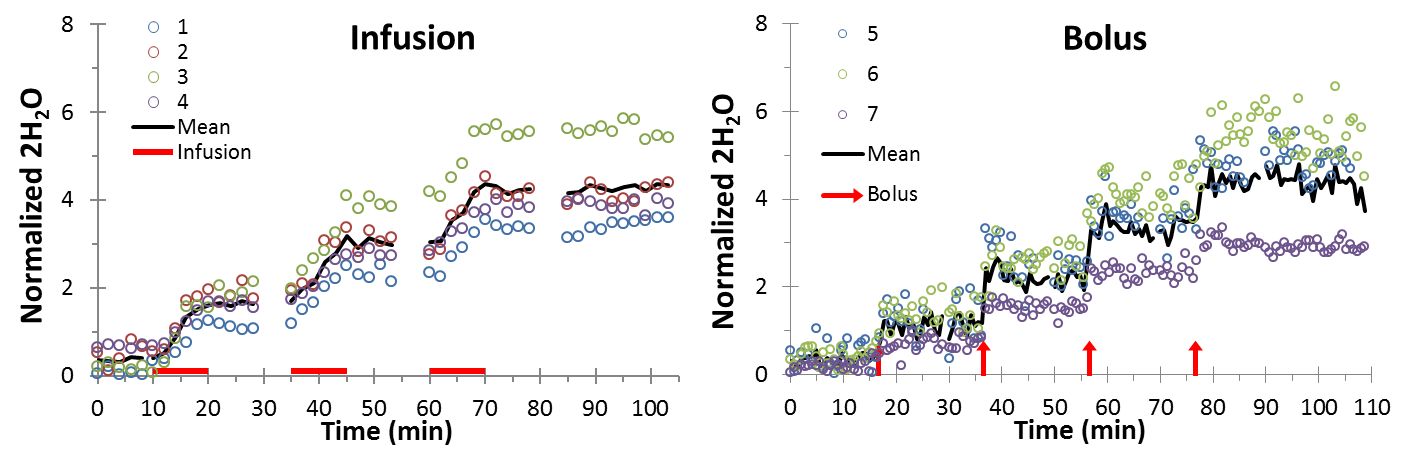
On a 10% 2H2O phantom, bSSFP showed much higher SNR compared to FLASH and RARE (Fig 1). T1 and T2 were measured on the phantom (with inversion-recovery EPI and multi-echo RARE, respectively) at room temperature to be T1=451ms and T2=325ms. With this small T1/T2 ratio, bSSFP is expected to provide high signal. Fig 2 shows example mouse eye images with structures labeled with a reference 1H2O image and 2H2O bSSFP image. Fig 3 shows 2H2O bSSFP and FLASH images from a mouse eye, with bSSFP showing much higher SNR in the vitreous (which is 99% water) similar to the phantom results. Dynamic 2H2O imaging was thus performed using bSSFP, with Fig 4 showing dynamics of infusion and bolus administration. With infusion, the 2H2O MRI signal began to increase soon after injection began and quickly became steady when the infusion was stopped, suggesting rapid equilibration between the blood and vitreous. Similarly, the vitreous signal rapidly increased following bolus. From the bolus data, the relative area under the curve (for 10.4 min after bolus) and wash-in rate of the rising slope of the normalized vitreous 2H2O intensity were 10.7±2.8 and 0.31±0.14, respectively (12 trials from n=3 mice, mean±SD).Discussion
These studies showed that bSSFP could give dramatically improved SNR for imaging 2H2O inflow into the intraocular fluid. This was expected as bSSFP generally provides high signal in fluids which usually have relatively small T1/T2 ratio. Phantom and in vivo studies suggested that FLASH or RARE would not provide sufficient SNR and spatial resolution for dynamic imaging of 2H2O in the mouse eye. bSSFP 2H2O MRI showed the dynamics of water inflow in the mouse vitreous, revealing different dynamics of 2H2O bolus and infusion, suggesting rapid exchange of water across the blood retina barriers and into the eye. With an external reference for normalization as used herein, the method could potentially provide 2H2O concentration in the vitreous, although correction for coil sensitivity and possibly B0 would be needed for accurate quantification. This method could be useful to study retina diseases in which the ocular permeability is affected.Acknowledgements
Amor B. and Loddie Lee Whitehead Fellowship Fund in Ophthalmic ResearchReferences
1. Obata T, Ikehira H, Koga M, et al. Deuterium Magnetic Resonance Imaging of Rabbit Eye in vivo. Magn Reson Med 1995;33:569. 2. Obata T, Ikehira H, Shishido F, et al. Deuterium MR in vivo Imaging of the Rat Eye using 2H2O. Acta Rad 1995;36:552. 3. Remtulla S, Hallett PE. A schematic eye for the mouse, and comparisons with the rat. Vis Res 1985;25:21.Figures