5518
Spinal Cord Perfusion is Associated with Diffusion in Postoperative Patients with Cervical Spondylotic Myelopathy1CBIR,school of medicine, Tsinghua University, Beijing, China, 2Jishuitan hospital, Beijing, China
Synopsis
Cervical Spondylotic Myelopathy (CSM) is a progressive central-nervous degenerative disease caused by vertebral volume abnormalities. A certain proportion of postoperative patients suffered the fluctuation of symptoms after spinal canal decompression. Spinal cord blood supply change was reported as one of the crucial pathophysiological process in CSM. MR DTI has been verified as a relative mature technique in assessing neuro-impairment. In this study, we investigate the relationship between spinal cord blood perfusion and microstructure deficit using MR DSC and DTI technique respectively, and find a certain correlation between DSC and DTI metrics.
Introduction
Cervical Spondylotic Myelopathy (CSM) is a progressive central-nervous degenerative disease caused by vertebral volume abnormalities that result in spinal cord damage related to primary mechanical and secondary biological injuries1. A certain proportion of postoperative patients suffered the fluctuation of symptoms after spinal canal decompression. Structural image and signal change using conventional T1W and T2W MRI are most commonly studied, but tend not to be sensitive predictor of CSM functional recovery for CSM pregnosis1. In histological studies, spinal cord blood supply change was reported as one of the crucial pathophysiological process in CSM2. Recently, Diffusion Tensor Imaging (DTI) has been widely used to evaluate the microstructure deficit3. Thus, we aim to investigate the relationship between spinal cord blood supply and microstructure deficit assessed by DTI which has been verified as a relative mature technique in assessing neuro-impairment3.Method and materials
Image acquisition
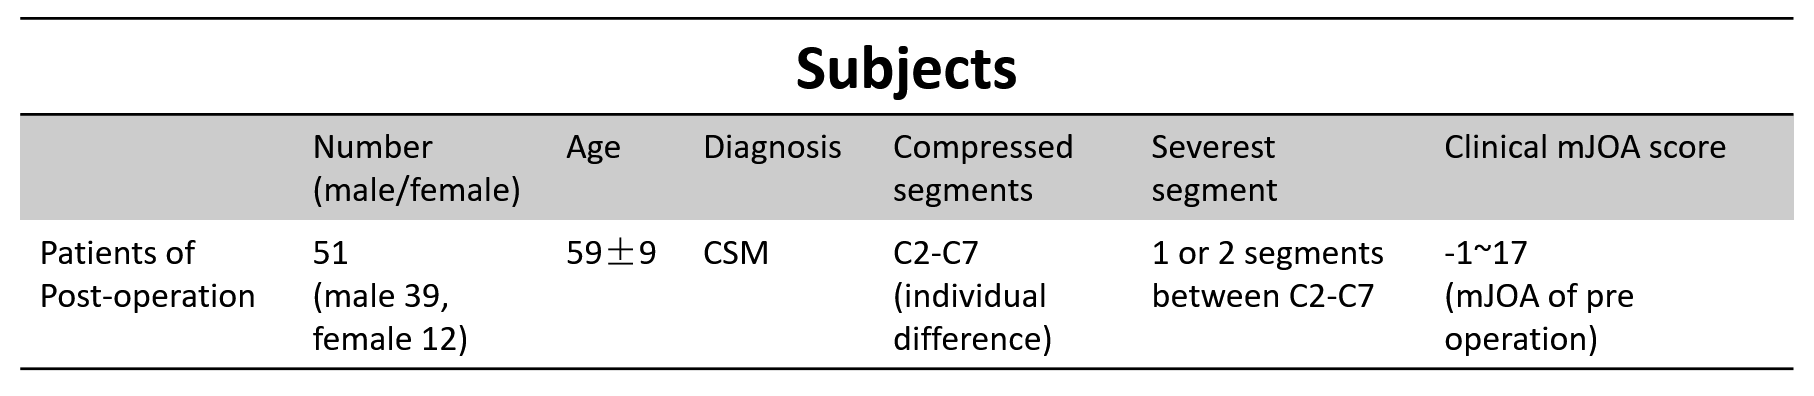
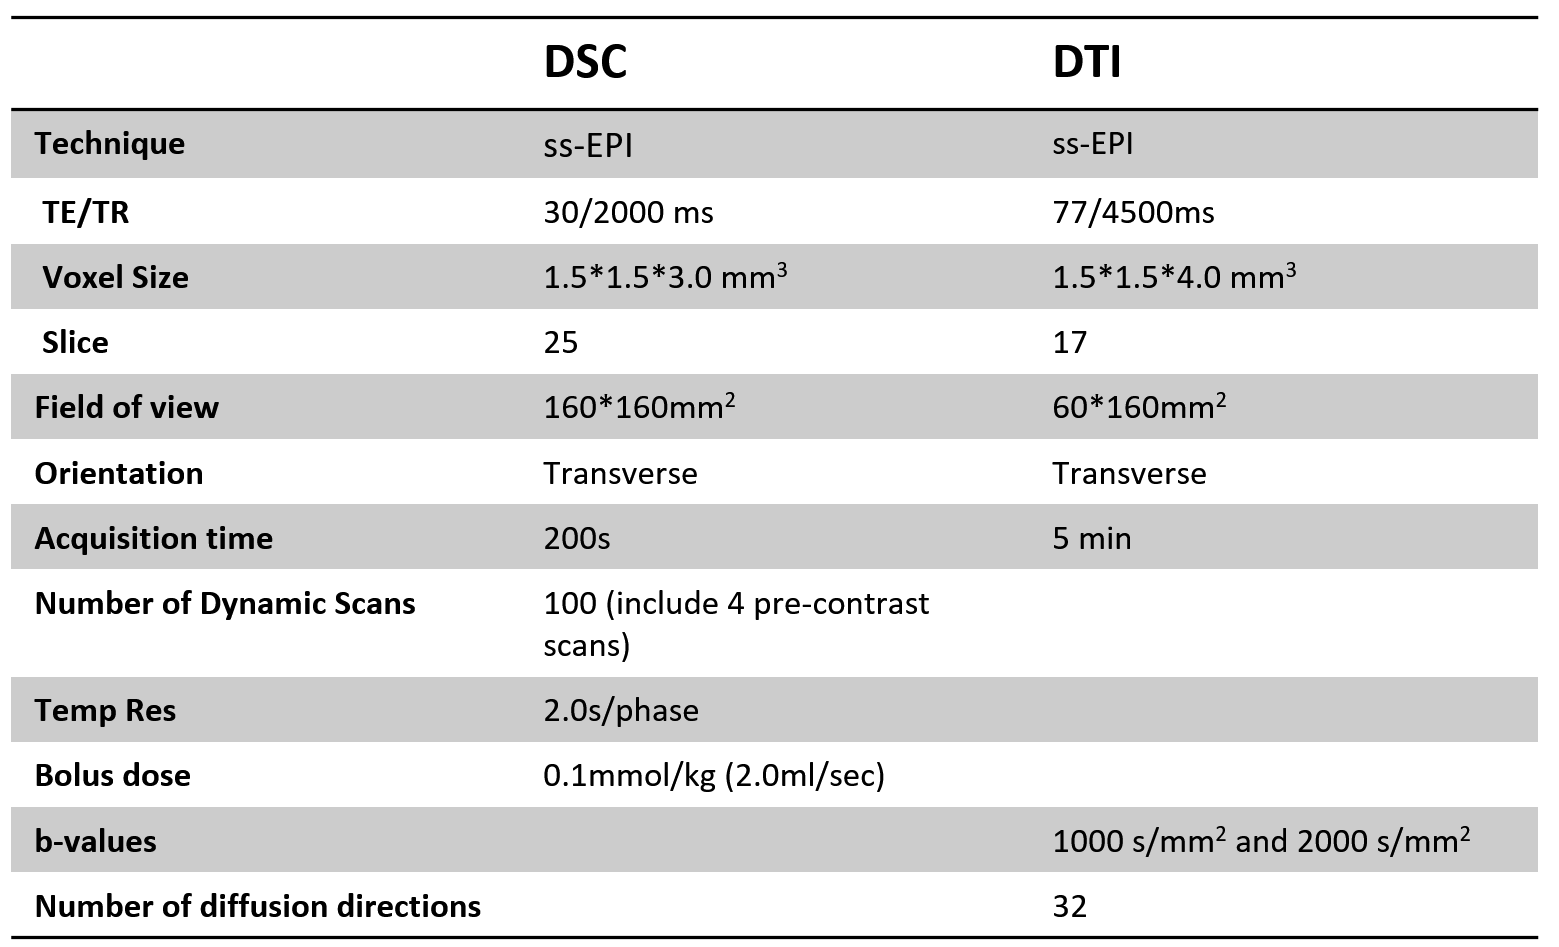
After signed written consent form obtained, 51 postoperative CSM patients (12 F and 39 M, age 37-75 years, mean 59 years) (Table 1) were called back and scanned on a Philips Achieva 3.0T (Philips, Best, The Netherlands) with a 16-channel head-neck coil. DSC and DTI images of all the patients were obtained axially with following parameters (Table 2). All imaging were done covering all the compressed vertebral segments vary from C2-C7. SENSE and partial Fourier techniques were adopted for imaging acceleration.
Data processing and analysis
Transverse slices containing the compressed segments (C2-C7) were selected for DSC and DTI analysis.
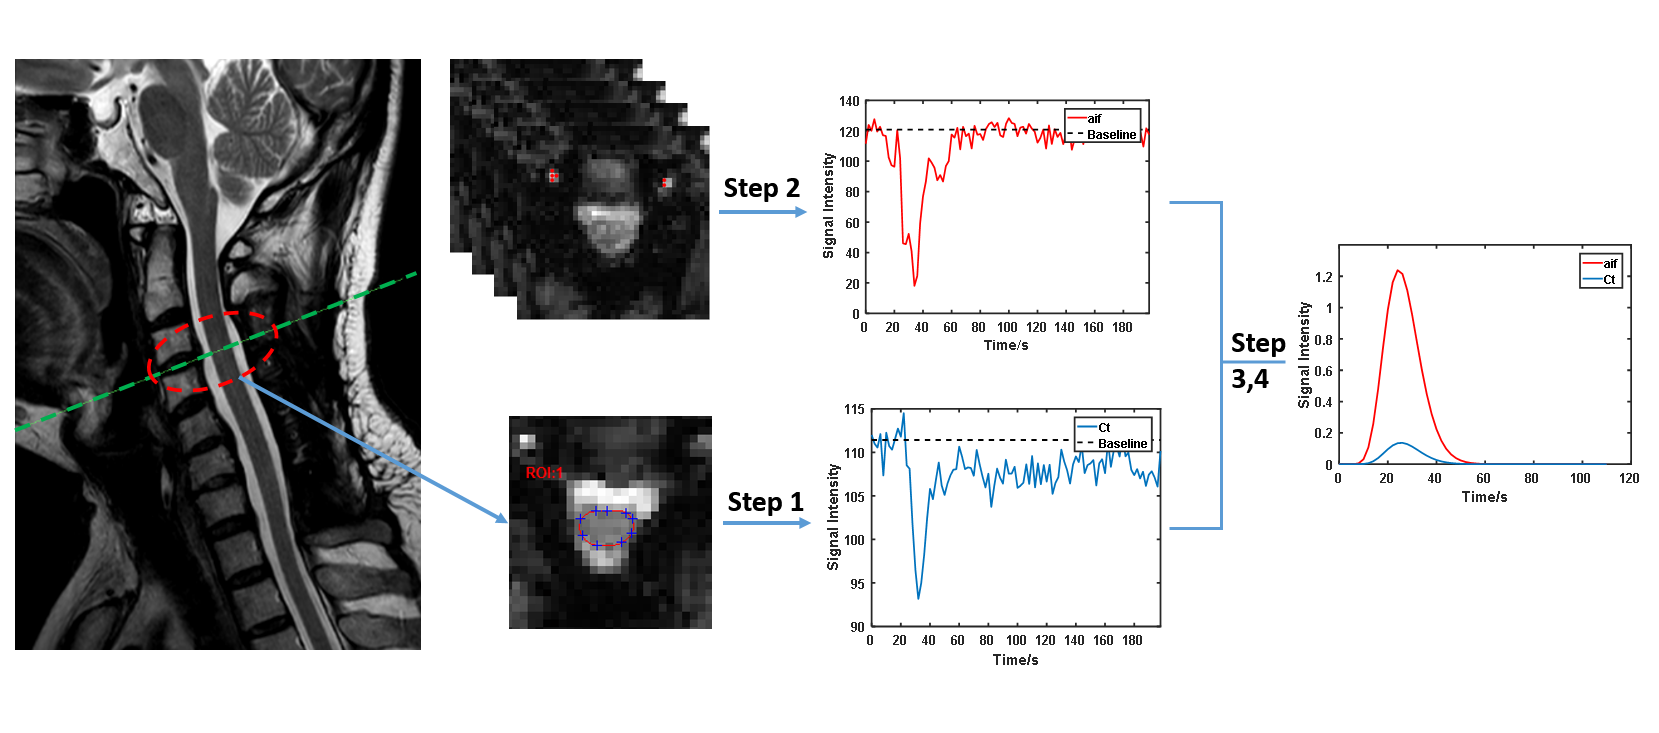
DSC (Fig 1)
Step 1: for each case, manually depict ROIs of spinal cord corresponding to all clinical reported compressed slices;
Step 2: automatic searching strategy for potential artery input function (AIF) voxels within vertebral artery area;
Step 3: Gd concentration conversion4: $$$C(t)=-k\times\ln\frac{s(t)}{s_{0}}$$$;
Step 4: Concentration of spinal cord and AIF curves were fitted with Gamma function4 for the following calculation;
Step 5:Classic Indicator Dilution Theory4 was taken to quantify the spinal cord blood volume (SCBV), spinal cord blood flow (SCBF) and mean transition time (MTT).
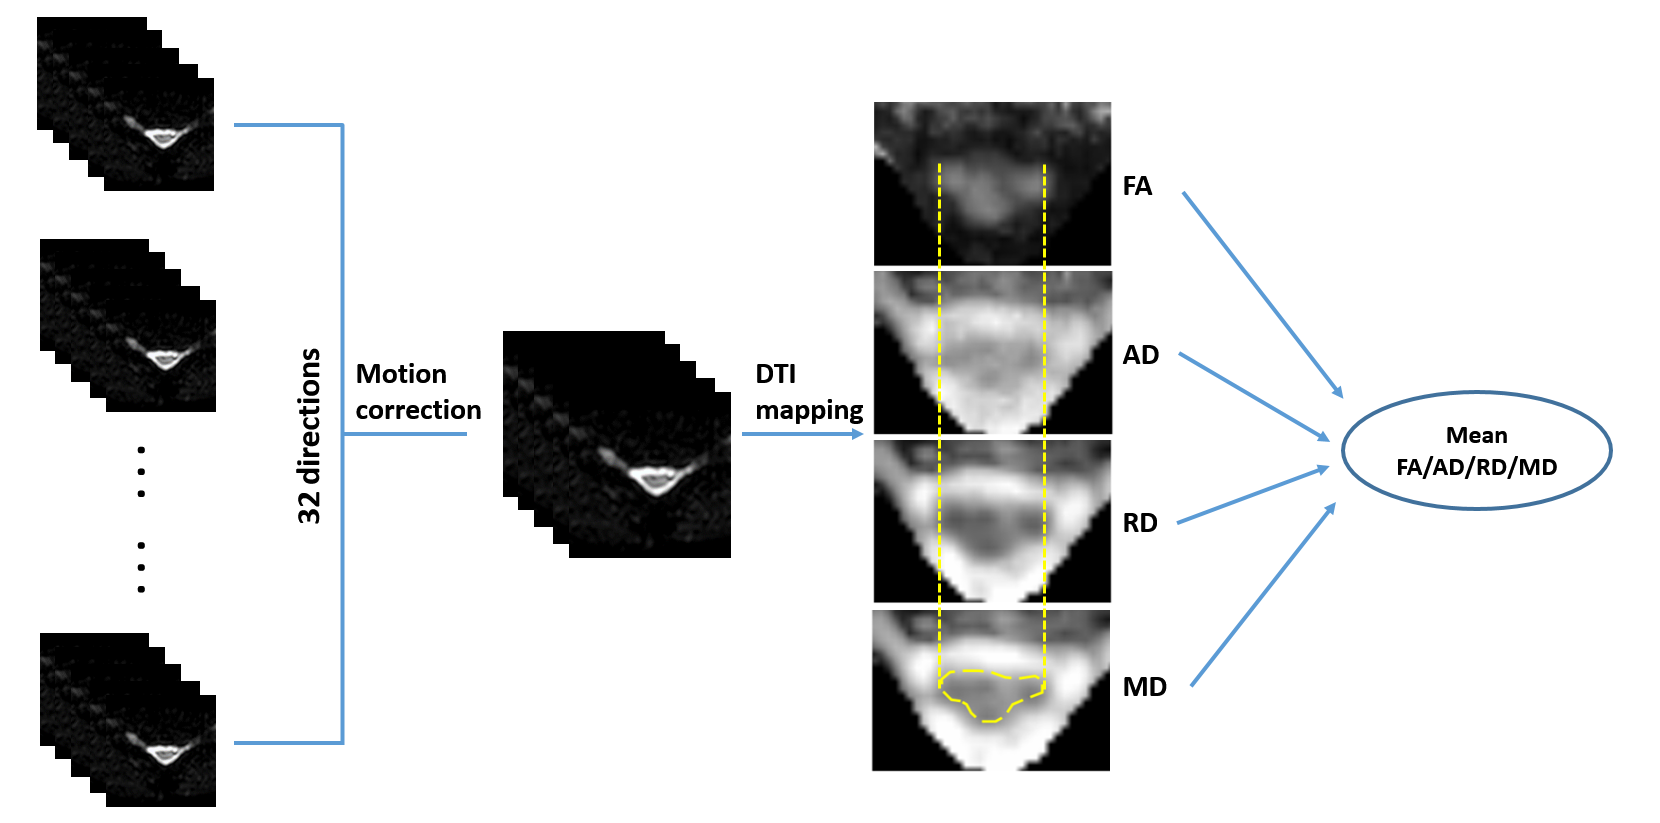
DTI (Fig 2)
Step 1: diffusion weighted images were pre-registered to different directions using Spinal Cord Toolbox (SCT)8;
Step 2: calculate the fractional anisotropy (FA), axial diffusivity (AD), radial diffusivity (RD) and mean diffusivity (MD) maps from the corrected images using FSL5;
Step 3: Region of interest (ROI) was drawn on MD maps to outline the spinal cord using DTI-Studio6;
Step 4: the mean FA, AD, RD and MD within ROIs were calculated and reported.
Case-based analysis was carried out by averaging all slices’ results for each subject. For all cases, the spearman correlation was employed to explored the relationship between DSC and DTI parameters.
Results
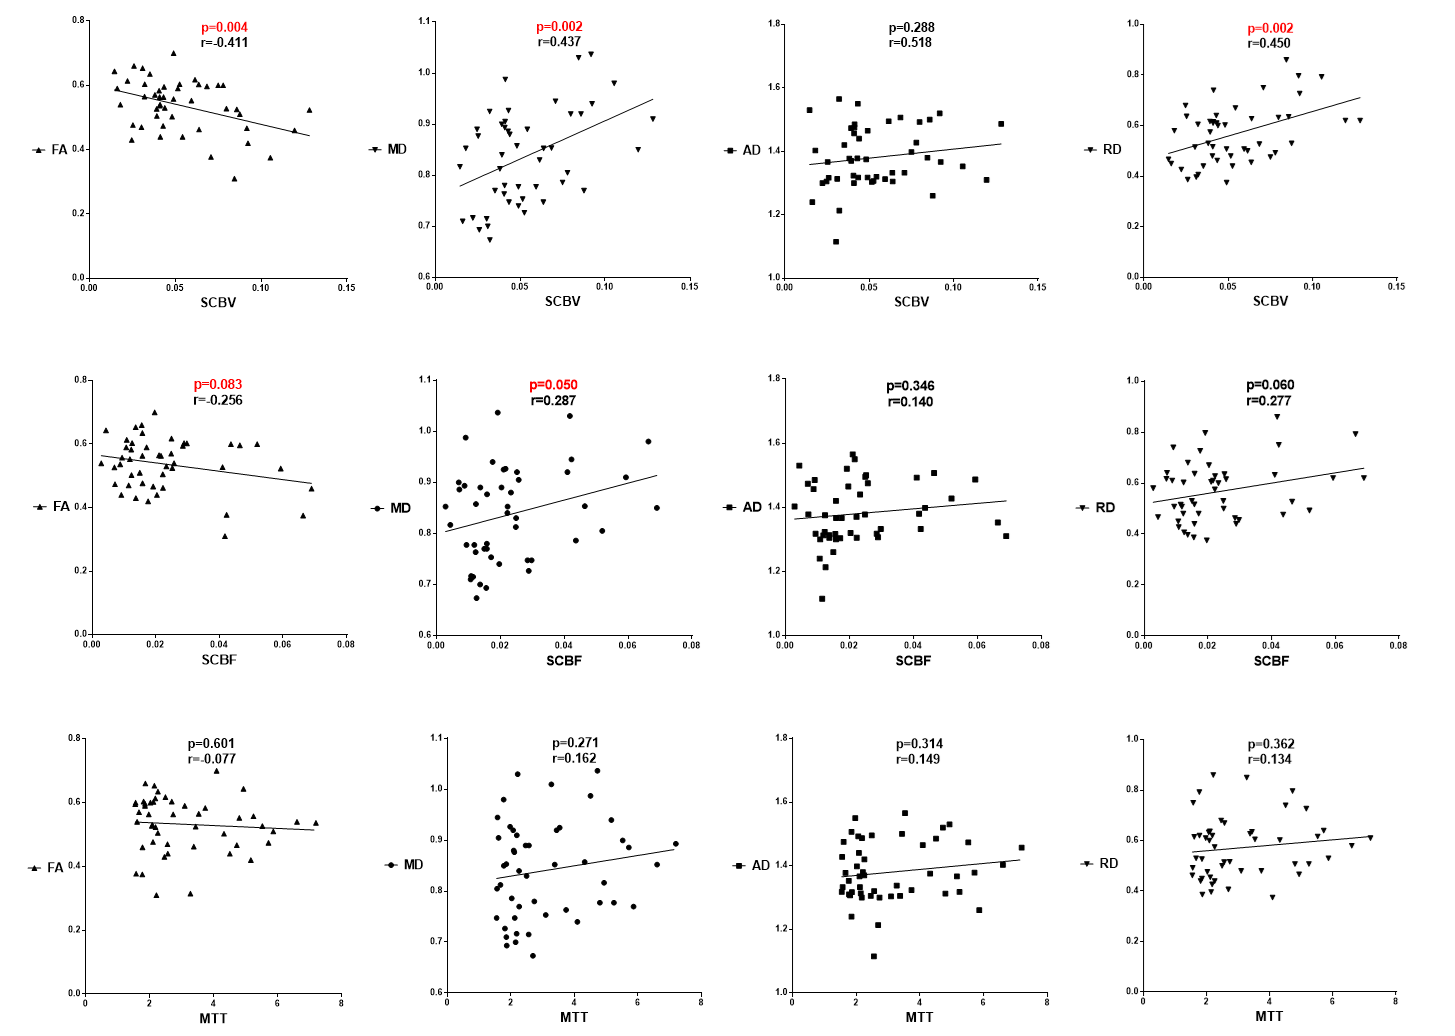
The spearman correlation coefficient between parameters of DSC and DTI is shown in Fig 3. The results indicate that SCBV is negative correlated with FA (p<0.05), and positive correlated with MD and RD (p<0.05). SCBF results present the similar trend against DTI parameters. Whereas AD shows no significant correlation with SCBV and SCBF. Results of correlation analysis suggest that patients with higher SCBV and SCBF tend to have loss of diffusion anisotropy (FA). Nevertheless, the results of MTT show no significant correlation with DTI parameters.Discussion and conclusion
In this study, we found that the spinal cord perfusion parameters quantified by MR DSC are significantly correlated with spinal cord diffusion parameters acquired by DTI imaging. DTI imaging has been widely verified as a reliable tool to evaluate microstructure integrity whose FA and RD are often used as a marker of structural integrity and myelination, respectively9. Clinical studies have clearly documented a significant decrease of FA and increase of RD in the site of chronic compression with myelopathy1. Correlation analysis also presents a consistent result that SCBV/SCBF is sensitive to FA/RD changes, but not to AD. Synthesizing the above results, we infer that the increase of blood supply (SCBV increase) in compressed site is a co-occurring pathological event when demyelination (RD increase) happened in CSM. The changes of SCBV and SCBF could be an alternative indicator in predicting microstructure deficit and pregnosis of CSM. Chronic inflammation was considered as a possible cause of blood supply increase, but what roles the inflammation plays in primary and secondary pathological injuries and whether it can be a more sensitive biomarker for early prognosis in patients with CSM are still uncertain. Our study may provide a good tool and a clue to search a deeper insight of complex interaction and relationship between pathological factors in course of CSM. In conclusion, the spinal cord blood flow perfusion evaluated by MR DSC is associated with microstructure disruption assessed by DTI imaging.Acknowledgements
No acknowledgement found.References
1. Ellingson B M, Salamon N, Holly L T. Advances in MR imaging for cervical spondylotic myelopathy[J]. European Spine Journal, 2015, 24(2):197-208.
2. Karadimas S K, Gatzounis G, Fehlings M G. Pathobiology of cervical spondylotic myelopathy[J]. European Spine Journal, 2015, 24(2):132-138.
3. Martin A R, Aleksanderek I, Cohen-Adad J, et al. Translating state-of-the-art spinal cord MRI techniques to clinical use: A systematic review of clinical studies utilizing DTI, MT, MWF, MRS, and fMRI[J]. Neuroimage Clinical, 2015, 10(C):192.
4. Smith A M, Grandin C B, Duprez T, et al. Whole brain quantitative CBF, CBV, and MTT measurements using MRI bolus tracking: Implementation and application to data acquired from hyperacute stroke patients[J]. Journal of Magnetic Resonance Imaging Jmri, 2000, 12(3):400.
5. Jenkinson M, Beckmann CF, Behrens TE, Woolrich MW, Smith SM. Fsl. NeuroImage 2012;62(2):782-790.
6. Jiang H, van Zijl PC, Kim J, Pearlson GD, Mori S. DtiStudio: resource program for diffusion tensor computation and fiber bundle tracking. Computer methods and programs in biomedicine 2006;81(2):106-116.
7. Carroll, T. J, et al. (2003). "Automatic calculation of the arterial input function for cerebral perfusion imaging with MR imaging." Radiology 227(2): 593-600.
8. De Leener B, Levy S, Dupont SM, et al. SCT: Spinal Cord Toolbox, an open-source software for processing spinal cord MRI data. NeuroImage 2017;145(Pt A):24-43.
9. Song SK, Sun SW, Ramsbottom MJ, et al. Dysmyelination revealed through MRI as increased radial diffusion of water, Neurimage 2002; 17: 1429-1436.
Figures