5515
Slice-Accelerated Gradient-Echo Echo-Planar Imaging: Feasibility and Utility of Isotropic Perfusion Imaging1Radiology, Tokyo Medical Clinic, Tokyo, Japan, 2Radiology, Juntendo University School of Medicine, Tokyo, Japan
Synopsis
The purpose of this study was to investigate the feasibility and utility of isotropic perfusion maps obtained using multi-band (MB) single-shot echo-planar imaging (EPI) technique. We evaluated the quantitative equivalence between MB dynamic susceptibility contrast-enhanced (DSC) magnetic resonance imaging (MRI) and single-band (SB) DSC MRI, as well as the superiority of registration accuracy in isotropic MB-DSC MRI compared with anisotropic SB-DSC MRI. MB-DSC MRI yields isotropic perfusion maps that can improve the registration accuracy and multisection assessment by creating multiplane reconstruction, without deteriorating or altering the quantitative parameters.
INTRODUCTION
Dynamic susceptibility contrast-enhanced (DSC) magnetic resonance imaging (MRI) is commonly used for the determination of cerebral perfusion parameters. DSC MRI incorporates rapid acquisition techniques, such as single-shot echo-planar imaging (EPI). However, given the need to balance temporal resolution, spatial resolution, and signal-to-noise ratio (SNR), clinical EPI based DSC MRI with sufficient coverage of the whole brain is typically performed with interslice gaps, which yields anisotropic perfusion maps. Multi-band (MB) EPI can increase the number of slices in repetition time (TR) using a parallel imaging technique that excites multiple sections simultaneously with a MB excitation pulse [1]. Recently, the technique has been applied to gradient-echo EPI (GRE-EPI) for DSC [2] to decrease section thickness, increase matrix size, and reduce interslice gaps. Consequently, isotropic perfusion maps which have been difficult to achieve with standard temporal resolution (e.g., 1500 ms) using a conventional EPI technique.PURPOSE
The purpose of this study was to investigate the feasibility and utility of isotropic perfusion maps obtained using the MB EPI technique.METHODS
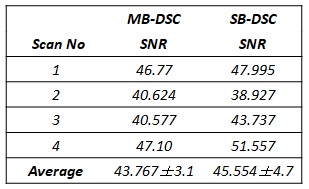
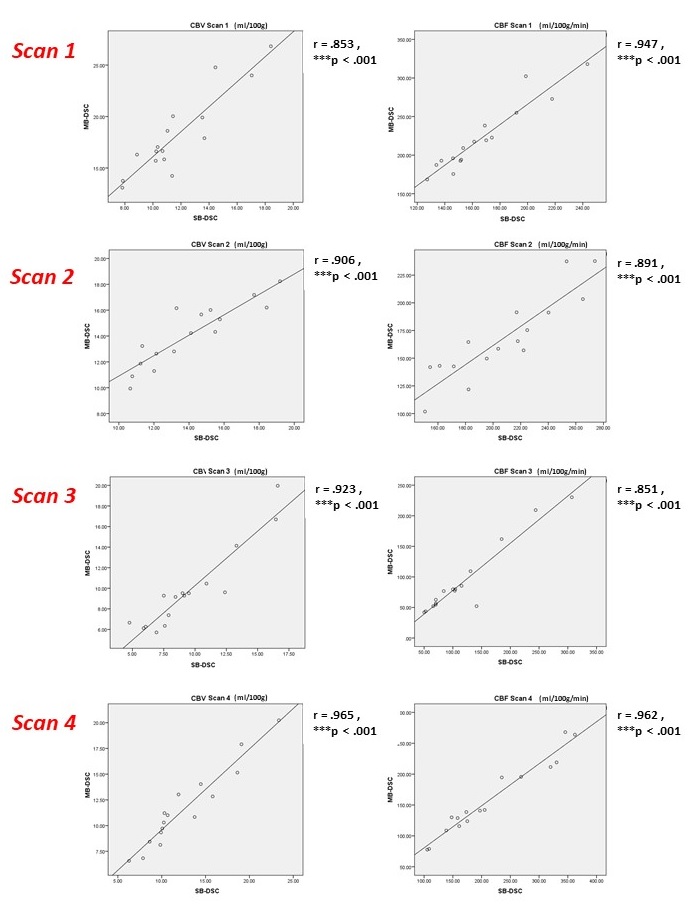
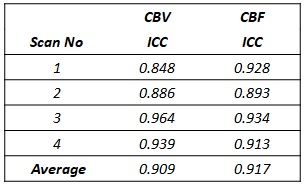
We included four participants without intracranial abnormality. All examinations were performed using a 3T Siemens Skyra MRI scanner with a 32-channel head coil. Slice-accelerated DSC MRI scan was performed with the GRE-EPI sequence with MB radiofrequency excitation and MB factor 3. Imaging parameters for both single-band (SB) DSC and MB-DSC acquisitions were: TR = 1600 ms, TE = 36 ms, 21/63 slices (MB = 1/MB = 3), slice thickness = 2 mm, in-plane field of view = 248 × 248 mm, in-plane resolution = 2 mm, in-plane acceleration of 2. All participants underwent SB-DSC and MB-DSC scans during a single examination to ensure consistency. Each scan was performed after injection of half-dose of gadobutrol (Gadovist, Bayer Schering Pharma, Berlin, Germany) contrast agent (0.1 mmol/kg) at 3 mL/s. Magnetic resonance perfusion data were analyzed using a commercial software (Nordic ICE NordicNeuroLab AS, Bergen, Norway). We used the arterial input functions (AIF) deconvolution method with standard singular value deconvolution to create cerebral blood volume (CBV) and cerebral blood flow (CBF) maps. AIFs were set automatically via an established clustering method [3]. We evaluated the equivalence between SB-DSC and MB-DSC in terms of the SNR of pre-bolus T2*WI and perfusion measurements including CBV and CBF, as well as the superiority of registration accuracy when T2*WI was registered with 3DT1WI. SNR of the pre-bolus T2*WI was measured by calculating the signal intensity of the whole brain parenchyma at the level of the basal ganglia divided by standard deviation/√2 of signal intensity of the subtracted whole brain parenchyma (Subtraction Mapping Methods). To assess the consistency of perfusion measurements, the mean value in 16 circular ROIs manually placed on the left and right in the cortex and basal ganglia between SB-DSC and MB-DSC was assessed using the Spearman rank correlation coefficient and intra-class correlation coefficient (ICC). Registration accuracy was visually assessed in terms of the spatial consistency of the lateral ventricle margin by fusing T1WI and cregistered T2*WI.RESULTS
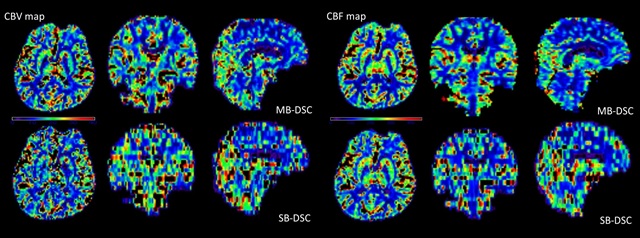
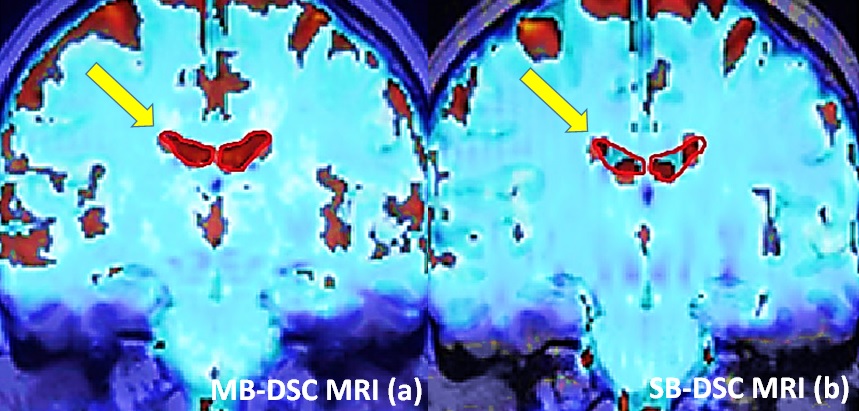
All isotropic CBV and CBF maps were successfully generated (Figure 1). The mean SNR was similar for MB-DSC (43.767 ± 3.1) and SB-DSC (45.554 ± 4.7); (p = 0.273, ICC = 0.855) (Table 1). CBV and CBF values showed high correlation in MB-DSC and SB-DSC (r > 0.851, p < 0.001 for all; Figure 2). Average ICC was 0.909 for CBV and 0.917 for CBF (Table 2). In the visual assessment of registration accuracy, the margin of lateral ventricle on the registered T2*WI was more spatially consistent with that on 3DT1WI in MB-DSC compared to SB-DSC (Figure 3).DISCUSSION
Our study evaluated the quantitative equivalence between MB-DSC and SB-DSC, as well as the superiority of registration accuracy in MB-DSC compared with SB-DSC. MB-DSC yields isotropic perfusion maps, which decreases misalignment in registration or more accurately evaluates abnormal perfusion status such as ischemia or brain tumor by creating a multiplanar reconstruction. Eichner et al. reported the maintenance of SNR and perfusion metrics in large coverage scans obtained using MB-DSC, compared with limited-coverage scans obtained using the conventional method [4]. This is the first study to demonstrate the equivalence of quantitative parameters between isotropic resolution achieved by MB-DSC and anisotropic resolution.CONCLUSION
MB-DSC MRI yields isotropic perfusion maps that can improve the registration accuracy and multi-section assessment by creating multiplane reconstruction, without deteriorating or altering the quantitative parameters.Acknowledgements
No acknowledgement found.References
[1] Larkman DJ, et al., JMRI, 2001. 13(2):313-7.
[2] Wang D, et al., ISMRM, 2013. p 6464.
[3] Mouridsen K, et al., Magn Reson Med, 2006. 55(3): 524-31.
[4] Eichner C, et al., Magn Reson Med, 2014. 72(3): 770-8.
Figures