5514
Application of spin and gradient-echo (SAGE) sequence for renal perfusion imaging1Institute for Medical Imaging Technology, Shanghai Jiao Tong university, Shanghai, China, 2Academy for Advanced Interdisciplinary Studies, Peking University, Beijing, China, 3College of Engineering, Peking University, Beijing, China, 4Philips Healthcare, Suzhou, China, 5Department of Radiology, Peking University First Hospital, Beijing, China
Synopsis
Quantification of absolute R2/R2* instead of the relative signal changes provides T1-independent perfusion imaging, which is beneficial for renal blood volume (RBV) estimations. This study applied the multiple spin- and gradient-echo (SAGE) sequence for renal perfusion imaging in ischemic acute kidney injury (AKI) animals. The results show that Both RBV and Tmax were significantly attenuated during the acute phase of AKI. R2/R2*-derived RBVs were significantly lower in the AKI kidney than that in the healthy contralateral kidney. Both R2-based and R2*-based perfusion imaging can be used to detect renal injury in AKI animals.
Purpose
We applied the multiple spin- and gradient-echo (SAGE) sequence for renal perfusion imaging in ischemic acute kidney injury (AKI) animals.Introduction
Alterations of renal hemodynamics and perfusion have been identified as key mediators in the progression of renal impairment. Recently, a SAGE-EPI sequence1,2 has been developed for perfusion imaging that permits simultaneous measurements of R2 and R2*. Quantification of absolute R2/R2* instead of the relative signal changes provides T1-independent perfusion imaging, which is beneficial for renal blood volume (RBV) estimations3-5.Materials and Methods
In vivo study
The animal experiment was performed on 8 rabbits (7-8 weeks, 2.5-3.5 kg) under the approval of local Animal Care and Use Institutional Committee. Ischemic AKI was induced by injection of a 1000-microsphere dose of acryl beads (40-120 μm in diameter) into the right kidney under the guidance of digital subtraction angiography (DSA). MRI scans were immediately performed after the surgery.
MR Imaging
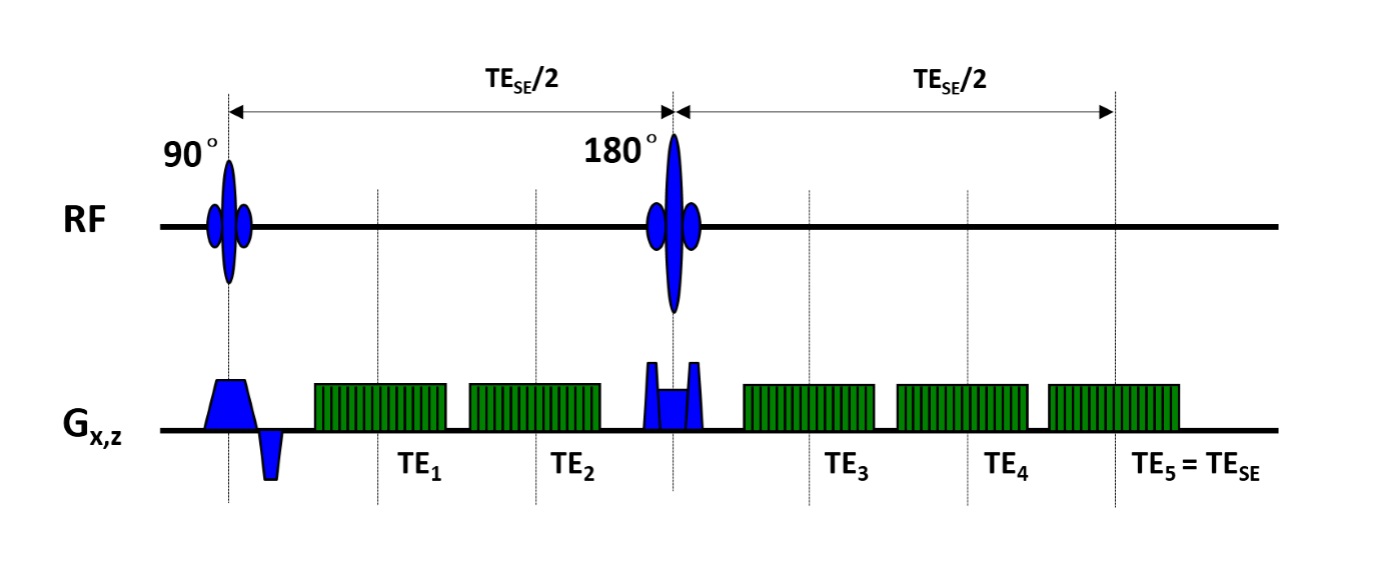
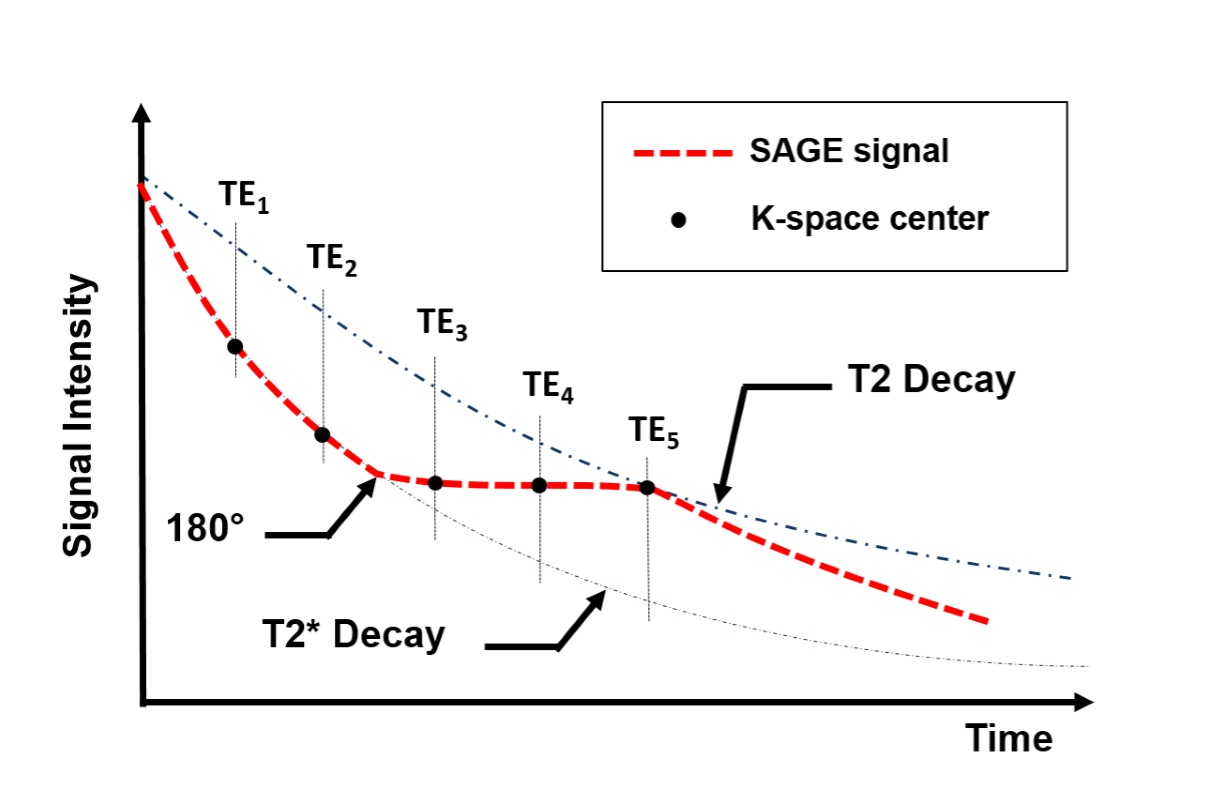
MR image was performed on a 3.0 T MRI system (Achieva, Philips Medical Systems, Best, Netherlands). SAGE sequence was used to obtain both spin-echo (SE) and gradient-echo (GE) data simultaneously (Fig.1). The SAGE sequence incorporate two GEs before the 180° pulse, two mixed SE/GEs after the 180° pulse and a final SE readout. Theoretical signal decay of the SAGE sequence is shown in Fig.2. To obtain acceptable TEs, SENSE factor of 2.5 was applied. Scan parameters were: TR = 2.0 s, FOV = 120 × 120mm2, voxel size = 1.6 × 1.6 × 5.0 mm3, TE1-TE5 = 12/34/56/78/100 ms. The scan duration of dynamic SAGE imaging was 3.5 minutes (100 dynamics). A single-dose bolus (0.1 mmol/kg body weight) of a Gd-based contrast agent (Gd-DTPA) was injected intravenously. The contrast agent bolus was immediately followed by 10 mL of saline.
Quantitative Analysis
R2 and R2* estimates were calculated according to the following MRI signal equation:
$$S(t) = \left\{ \begin{array}{l l} S_0\cdot e^{-t\cdot R2*} & \quad \text{0<t<TE/2}\\ \frac{S_0}{\delta}\cdot e^{-TE(R2*-R2)}\cdot e^{-TE(2R2-R2*)}& \quad \text{TE/2<t<TE}\\ \end{array} \right.$$
where S(t) is the signal acquired at each time point (t) during the SAGE scan, δ accounts for the residual signal differences caused by imperfectly slice profiles. Voxel-wise fitting of all echoes was performed during contrast agent passage to obtain ΔR2 and ΔR2* time series. To determine the renal blood volume (RBV, ml/100g tissue), area under the measured tissue concentration-time curves was calculated and normalized6. Tmax was defined as the time point when enhanced R2/R2* reached the peak values.
Results
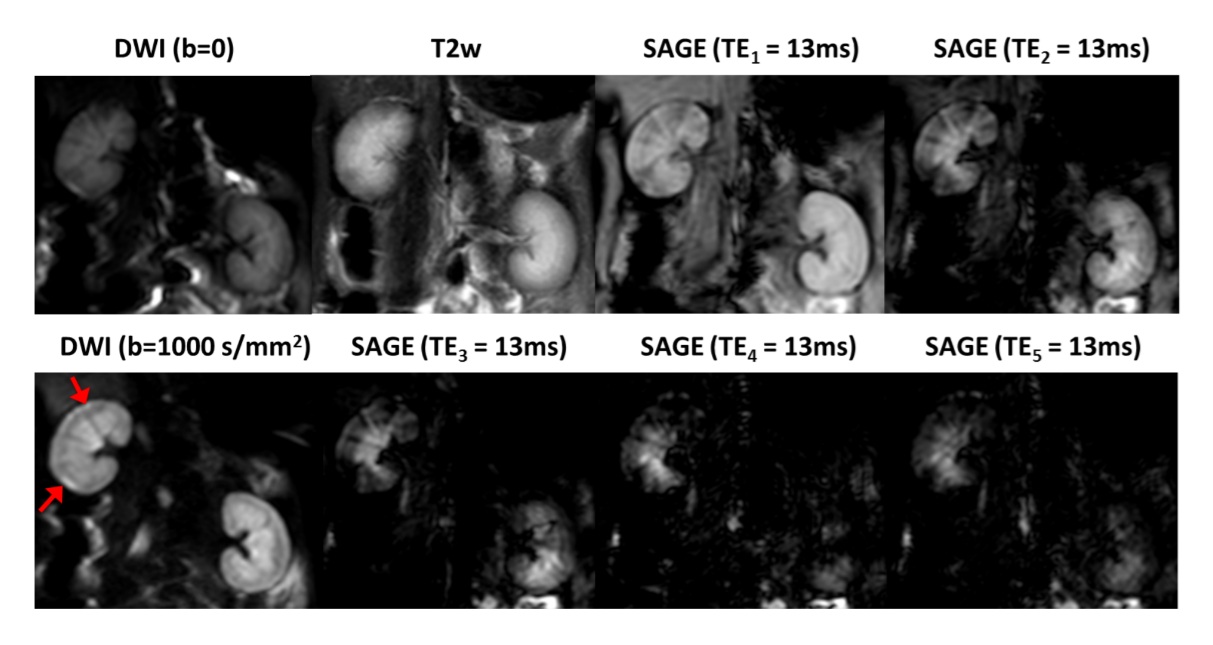
Fig.3 shows example of baseline SAGE images at each echo as
well as the corresponding T2w and diffusion-weight images. Elevated diffusion
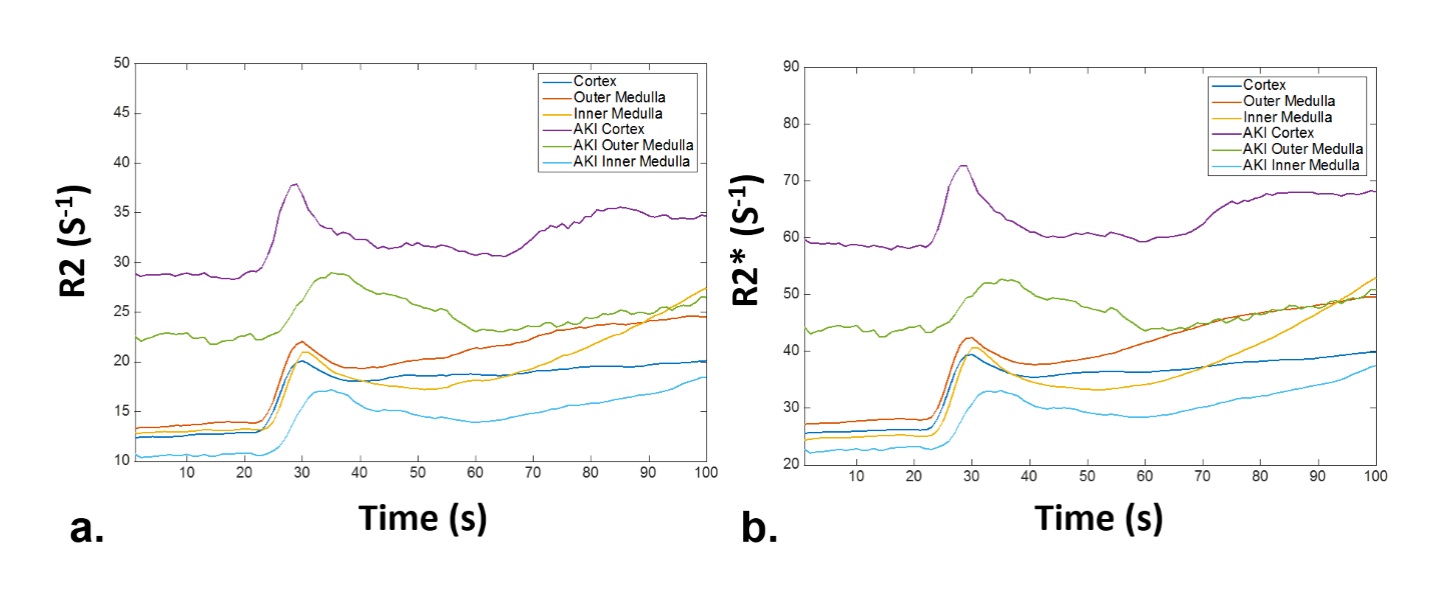
signal can be seen in the injured renal cortex (pointed with red arrows). Fig.4
shows the SAGE derived R2/R2* curves of renal cortex, outer medulla, inner
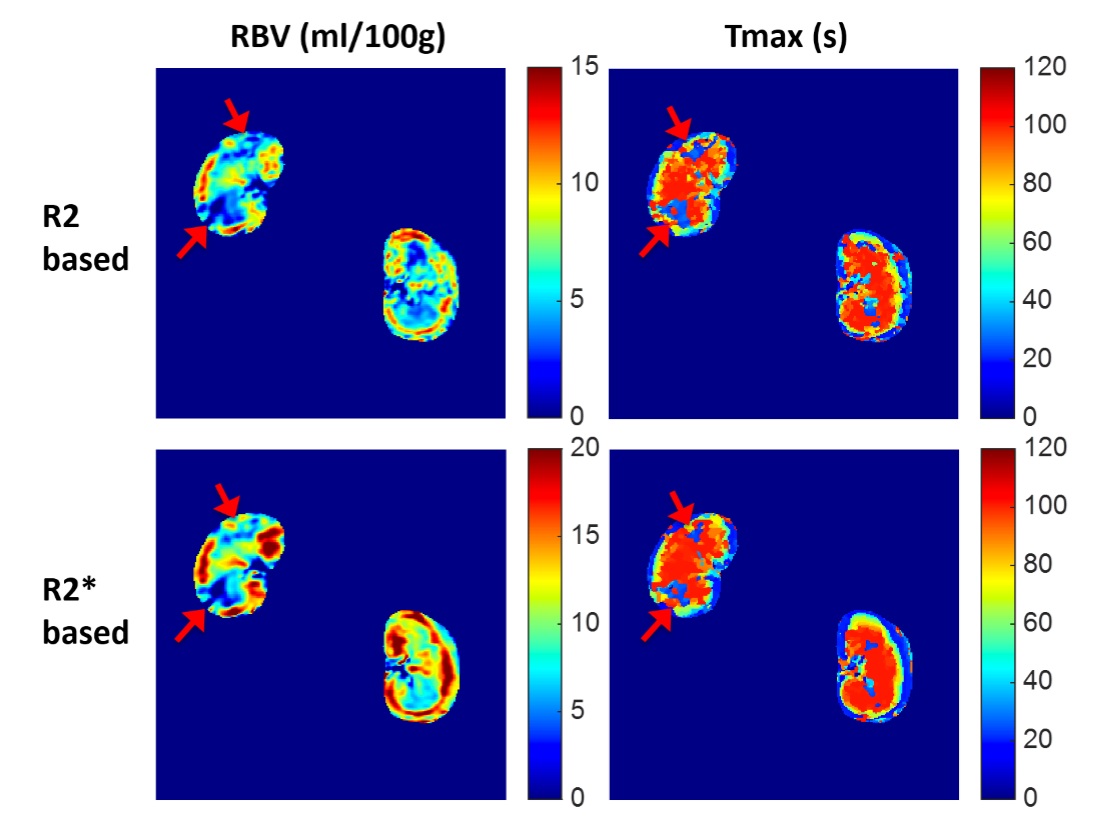
medulla, and injured regions following the administration of Gd-DTPA. Both RBV
and Tmax were significantly attenuated during the acute phase of AKI (Fig.5,
red arrows). The R2/R2*-derived
RBVs were significantly lower in the AKI kidney than that in the healthy contralateral
kidney (3.88 ± 4.61 vs 8.40 ± 1.63 ml/100g for R2-RBV, 4.37 ± 8.08 vs 12.36 ± 1.98
ml/100g for R2*-RBV, P < 0.01 for
each comparison).Discussion & Conclusion
This study presented an application of time-resolved R2/R2*-based perfusion imaging for ischemic AKI study. Both R2-based and R2*-based perfusion imaging can be used to detect renal injury in AKI animals. The SAGE-based calculation of renal R2 and R2* transverse rates agreed well with reports from literatures6. The advantage of SAGE perfusion is to obtain both GE- and SE-based DSC images in a single scan, in which GE-PWI and SE-PWI can provide complementary information of renal functionality. Since R2 and R2* are able to provide differential sensitivities to macro- and microvasculature, it can be further applied to the estimation of relative blood vessel size, which seems to be an important biomarker in functional renal imaging.Acknowledgements
No acknowledgement found.References
1. Schmiedeskamp H, Newbould R D, Pisani L J, et al. Improvements in parallel imaging accelerated functional MRI using multiecho echo-planar imaging. Magn Reson Med 2010; 63:959-969.
2. Schmiedeskamp H, Straka M, Newbould R D, et al. Combined spin- and gradient-echo perfusion-weighted imaging. Magn Reson Med 2012; 68:30-40.
3. Vonken EJ, van Osch MJ, Bakker CJ, Viergever MA. Measurement of cerebral perfusion with dual-echo multi-slice quantitative dynamic susceptibility contrast MRI. J Magn Reson Imaging 1999;10:109–117.
4. Newbould RD, Skare ST, Jochimsen TH, Alley MT, Moseley ME, Albers GW, Bammer R. Perfusion mapping with multiecho multishot parallel imaging EPI. Magn Reson Med 2007;58:70–81.
5. Paulson ES, Schmainda KM. Comparison of dynamic susceptibility- weighted contrast-enhanced MR methods: recommendations for measuring relative cerebral blood volume in brain tumors. Radiology 2008;249:601–613.
6. Aumann S, Schoenberg S O, Just A, et al. Quantification of renal perfusion using an intravascular contrast agent (part 1): results in a canine model. Magn Reson Med 2003, 49(2):276.
Figures