5513
Effect of B1 Inhomogeneity propagated error of DCE MRI Data on Tumor Grading of Gliomas at 3T1Centre for Biomedical Engineering, IIT Delhi, New Delhi, India, 2Radiology, Fortis Memorial Research Institute, New Delhi, India
Synopsis
DCE-MRI data is generally acquired using spoiled gradient Recalled(SPGR) echo sequence which is highly sensitive to B1 inhomogeneity. The error introduced due to B1 inhomogeneity effect on SPGR sequence is propagated to various perfusion parameters calculated in DCE-MRI. These parameters are used in various clinical analysis such as grading of tumor patients. This study had evaluated the change in perfusion parameters due to B1 inhomogeneity on 35 patients. Further simulations were done to evaluate its clinical significance. This study concluded that the change in perfusion parameters because of B1 inhomogeneity can change grading of glioma patients.
Introduction
At high field MRI scanner(≥3T), there can be a substantial transmit B1 field inhomogeneity(B1FI) depending upon RF coil used and tissue 1-5. In general, dynamic-contrast-enhanced(DCE) MRI data is acquired using fast GRE sequences6,7 which are highly sensitive to B1FI8-12. It has been shown previously that substantial B1FI errors were introduced in the perfusion-parameters derived from DCE-MRI data of human brain13. This study is aimed to find out the clinical significance of B1FI propagated errors on DCE-MRI obtained perfusion-parameters by investigating its potential influence on tumor grading of Glioma-patients.
Methods
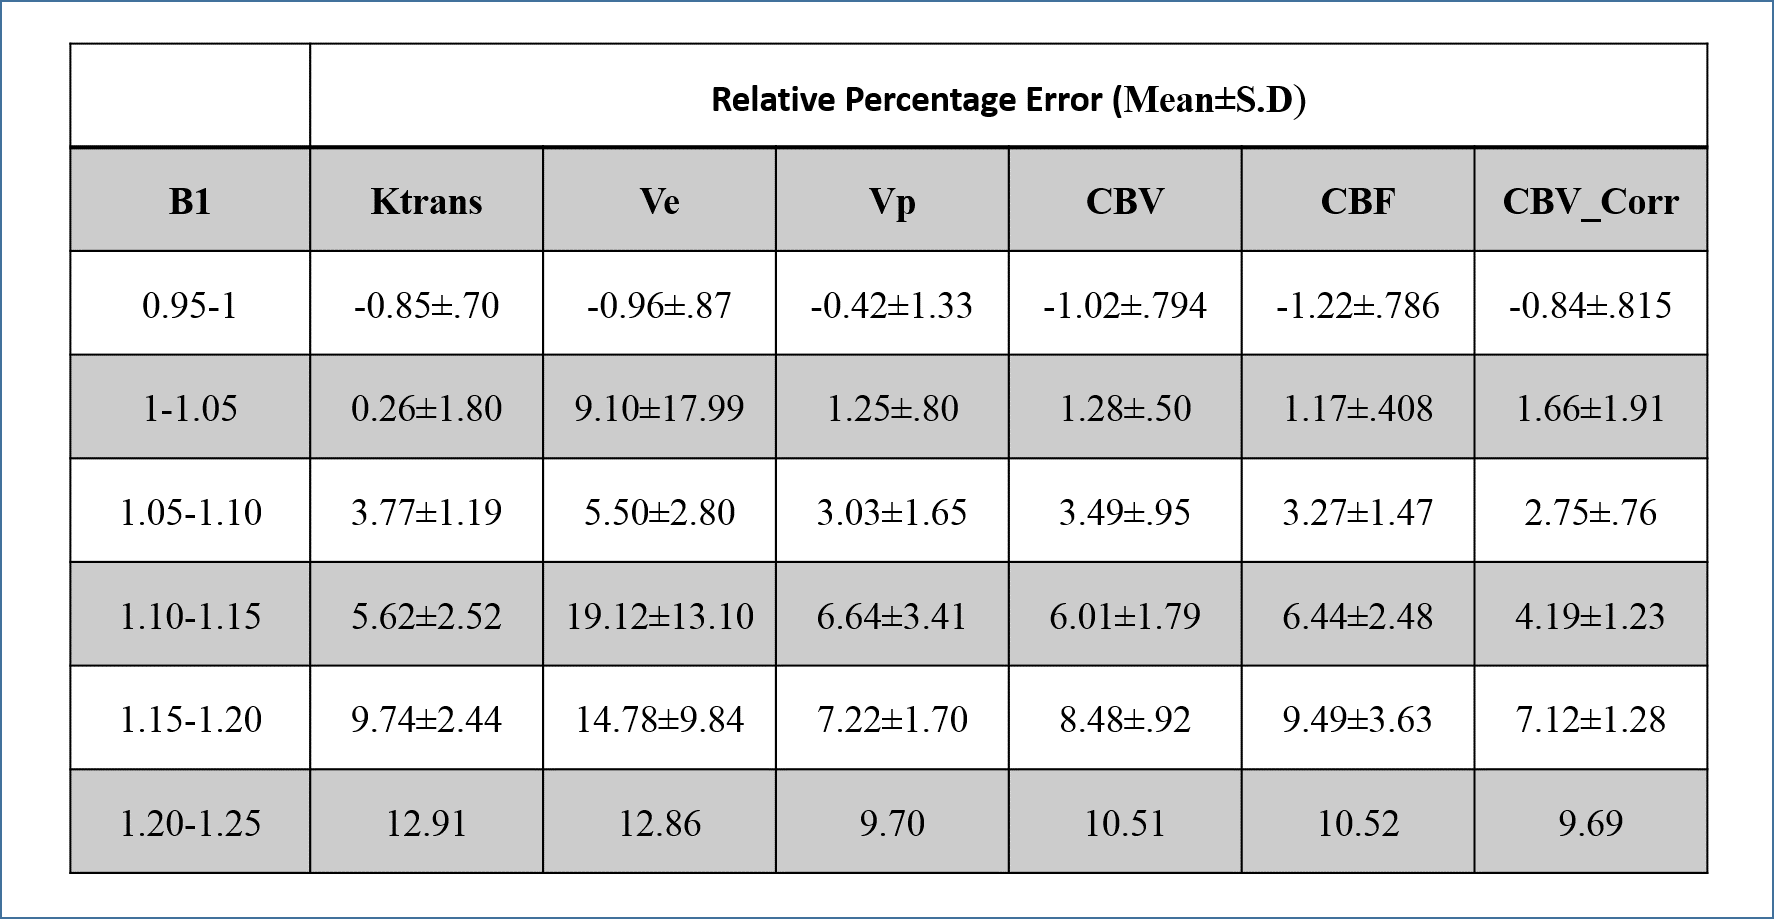
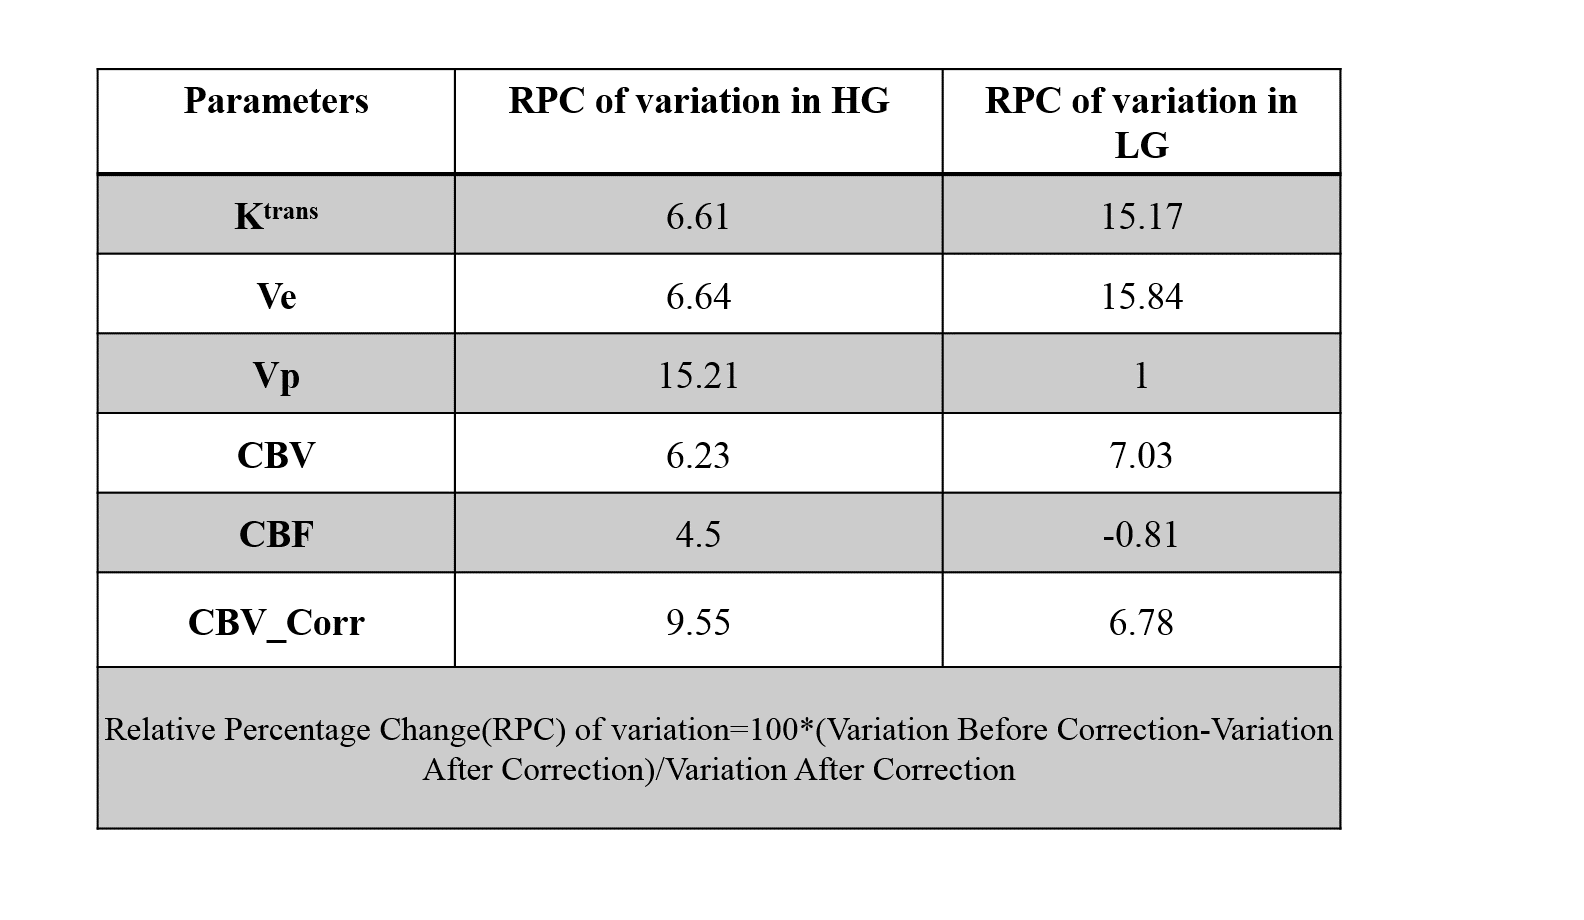
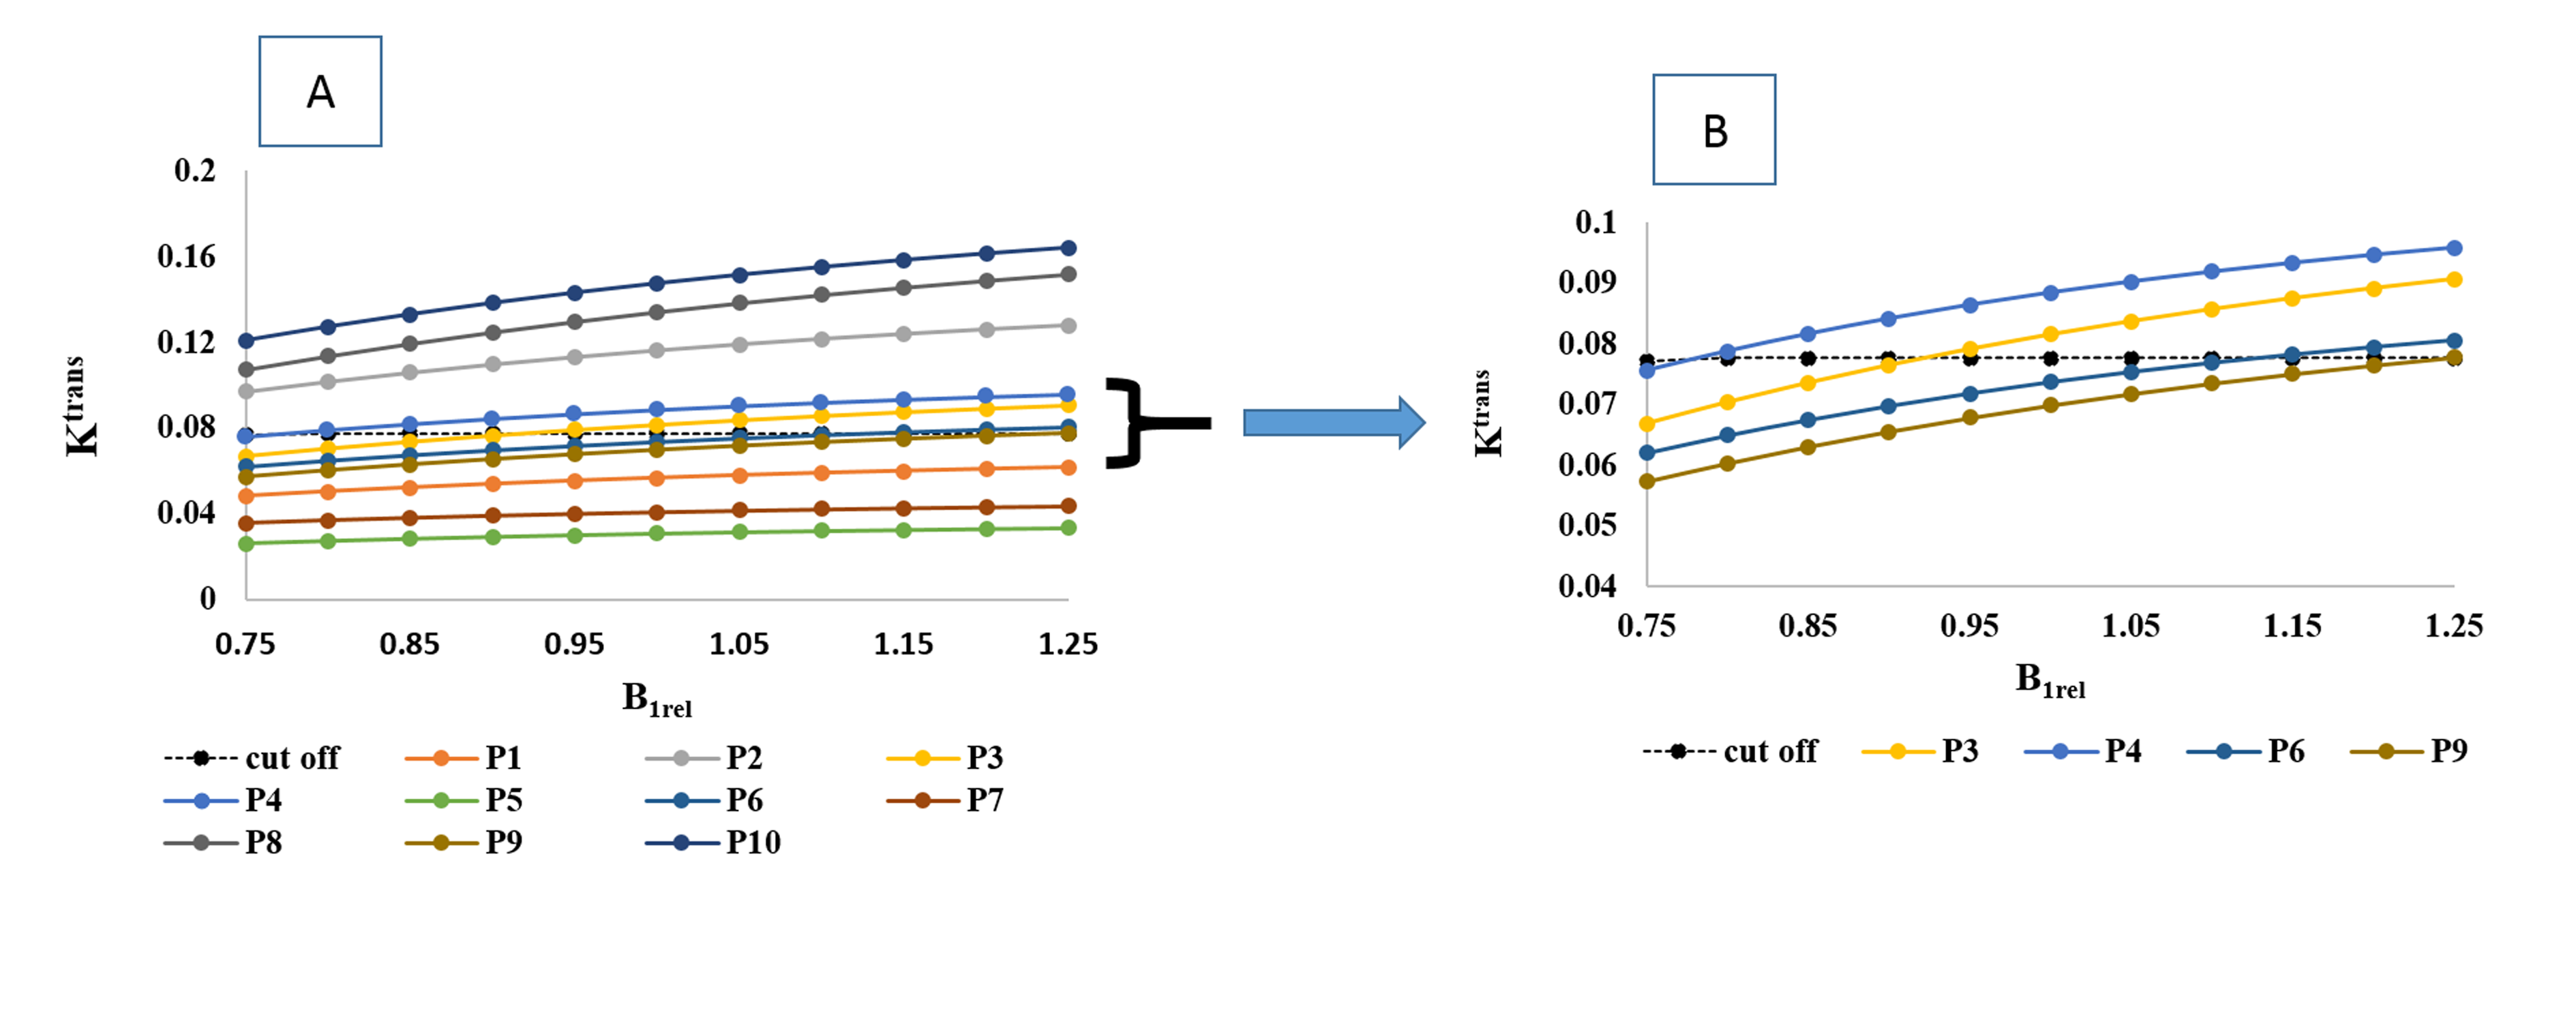
A MRI study was conducted at 3T Philips scanner on 35 Glioma-patients out of which 23 were high-grade(HG) and 12 low-grade(LG). Along with conventional MRI, data for B1 mapping14, T1 mapping using variable flip-angle method15,16 and DCE-MRI were acquired. B1 maps were generated using saturated-double angle method14. Signal-intensity time(S(t)) curve was converted to concentration-time(C(t)) curve17 followed by tracer kinetic analysis(Ktrans,Ve,Vp,Kep) using the General tracer-kinetic model and first-pass analysis(leakage corrected CBV, CBF). For each Glioma-patient, a five voxel radius having maximum value of post B1 correction(B1Corr) leakage corrected CBV(CBV_Corr) within tumor region, was choosen as the Region of Interest(ROI) . All perfusion-parameters before and after B1Corr were obtained from the ROIs and Relative Percentage Error(RPE) was computed.. A paired t-test with two-tailed distribution as well as Bland-Altman(BA) plot was obtained to find out whether the change in each perfusion-parameter before and after B1Corr is significant or not. Variation (calculated as square of Standard Deviation) of perfusion-parameters was calculated before and after B1Corr in HG and LG group. The AUC,sensitivity and specificity of the perfusion-parameters at the optimal value for differentiating between HG and LG were calculated from receiver-operating characteristic(ROC) analysis. Simulation study was done to illustrate the clinical significance of B1Corr. 5 HG and 5 LG patients were randomly selected. Ktrans values after B1Corr corresponding to the chosen ROI was used for simulation as it had the highest AUC. Relative B1(B1rel) was altered from a range of 0.75-1.25 to see how it influences the Ktrans values and hence grading of patients using Ktrans. The C(t) values were kept same for each glioma-patient to study the influence of B1FI exclusively on perfusion-parameters. The cut-off for grading used in this study was same as that obtained from ROC analysis post B1Corr.Results
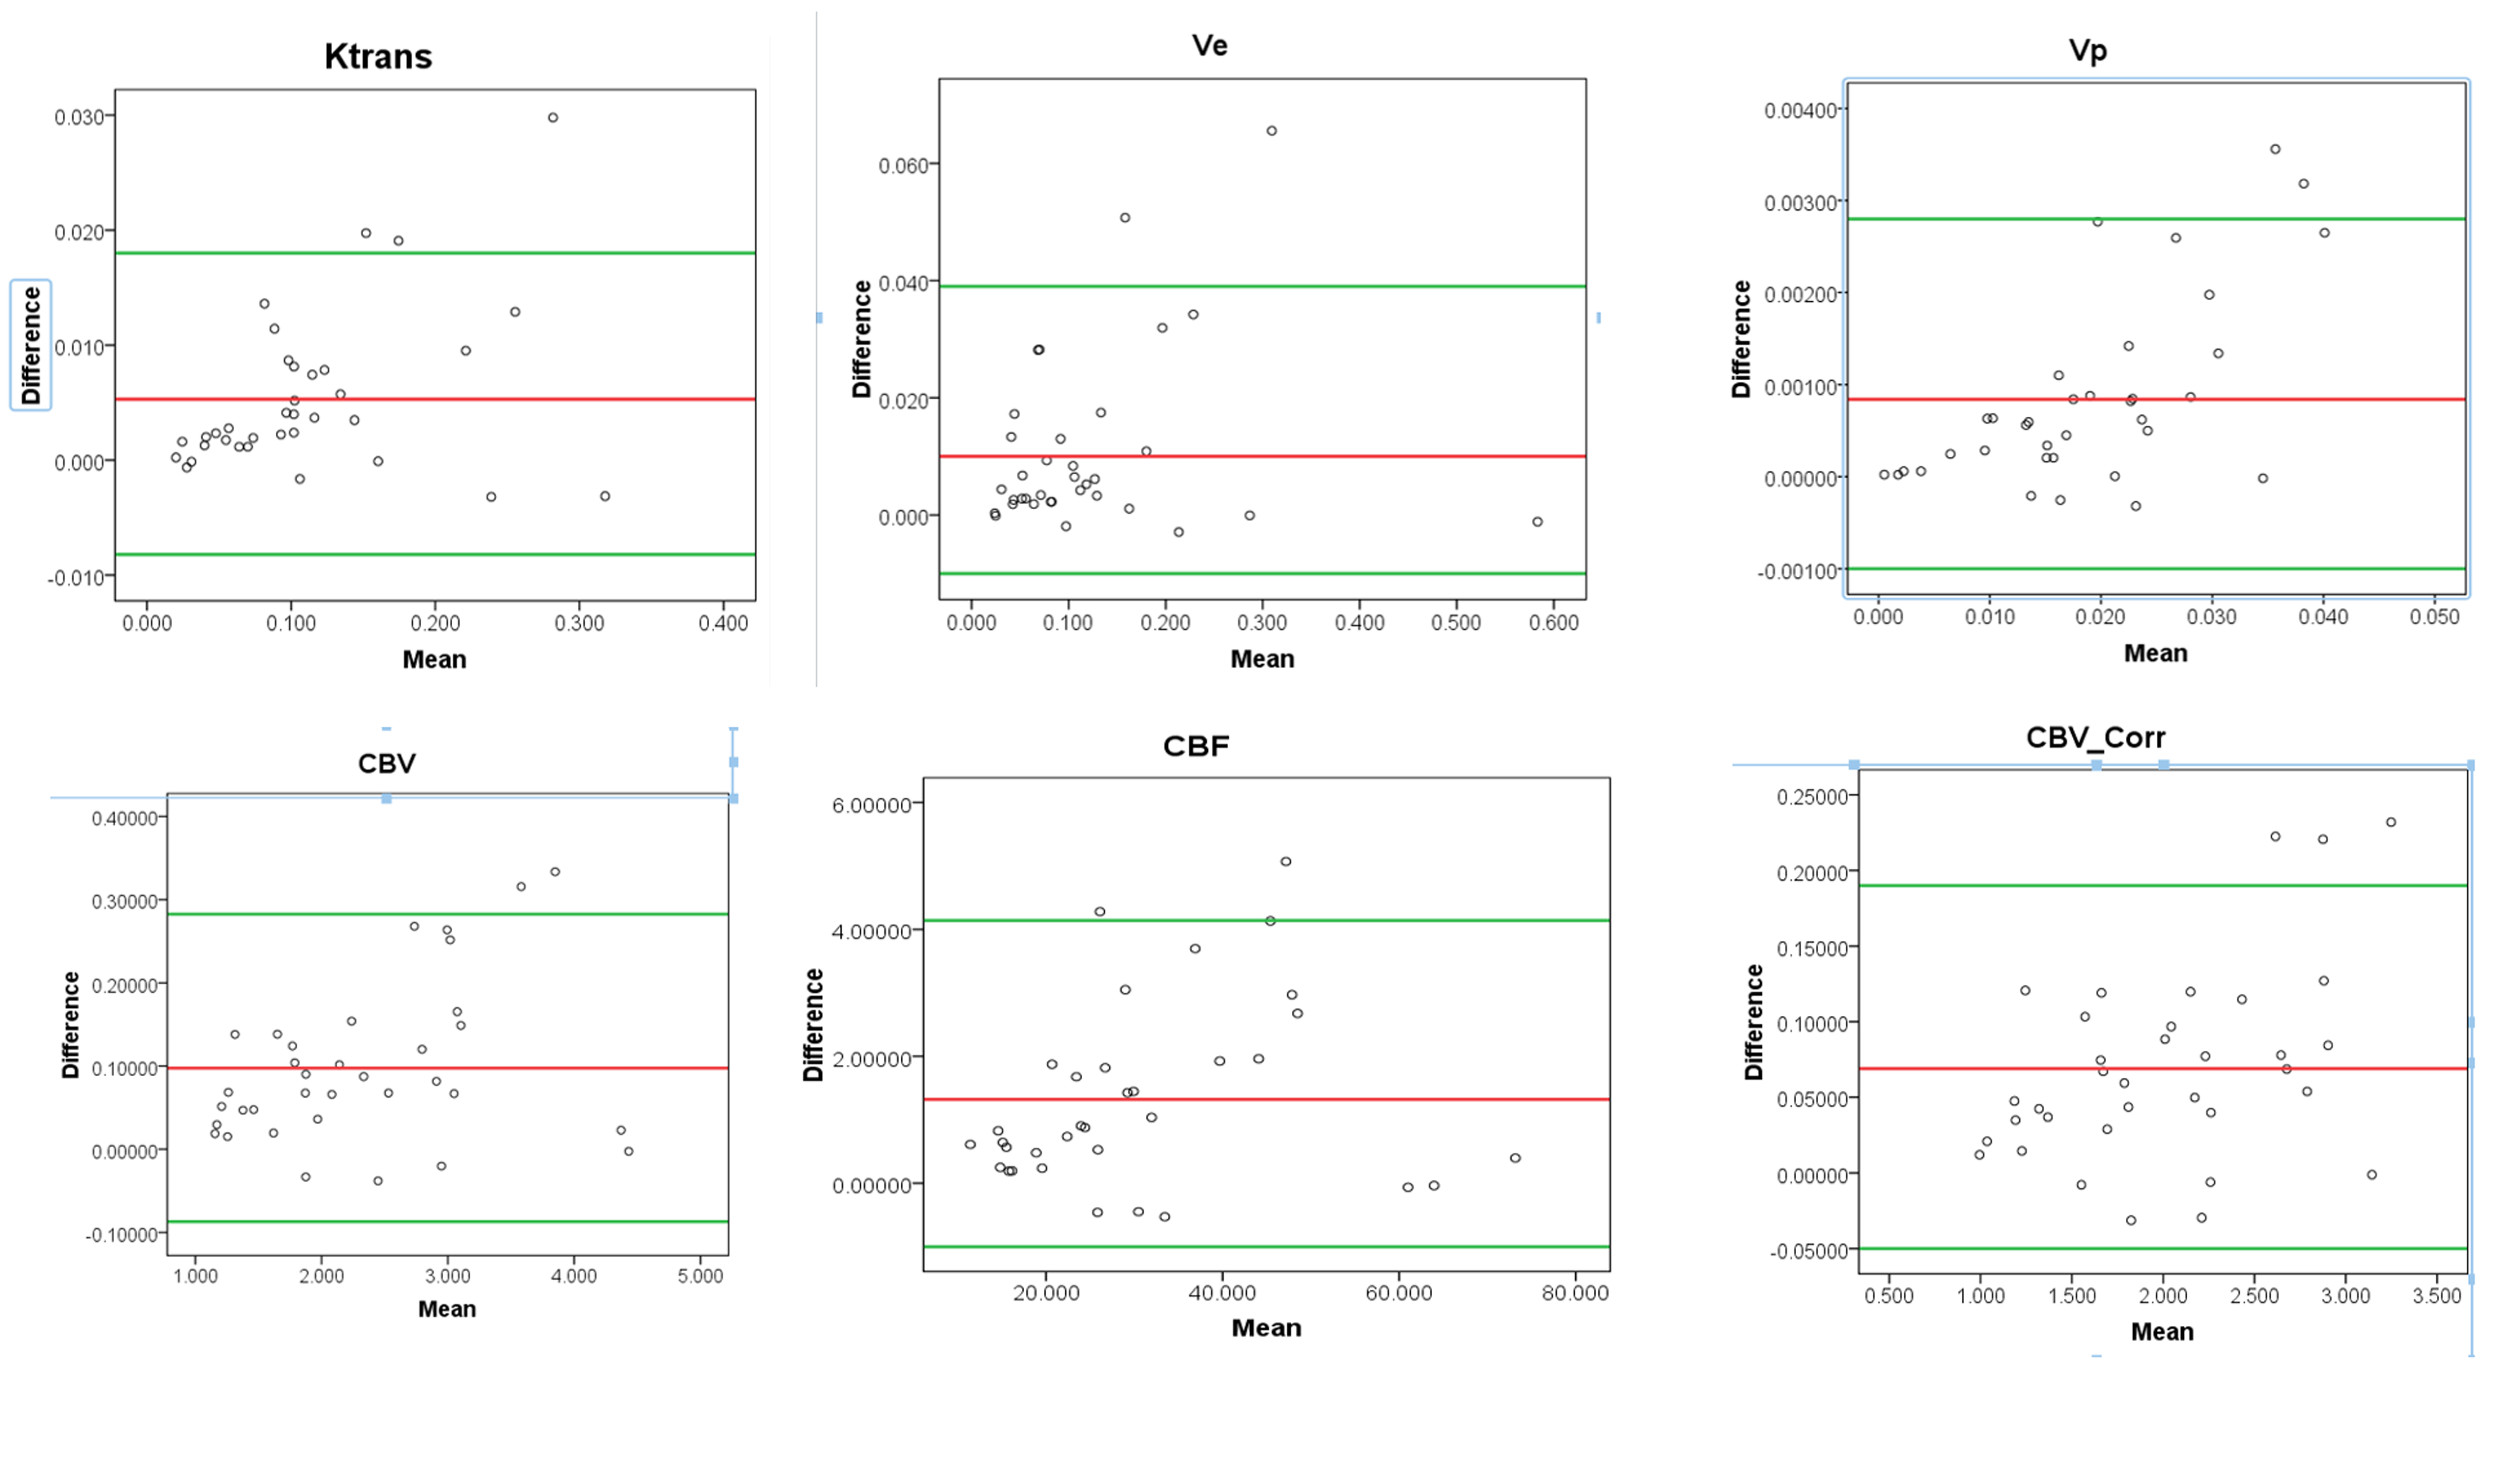
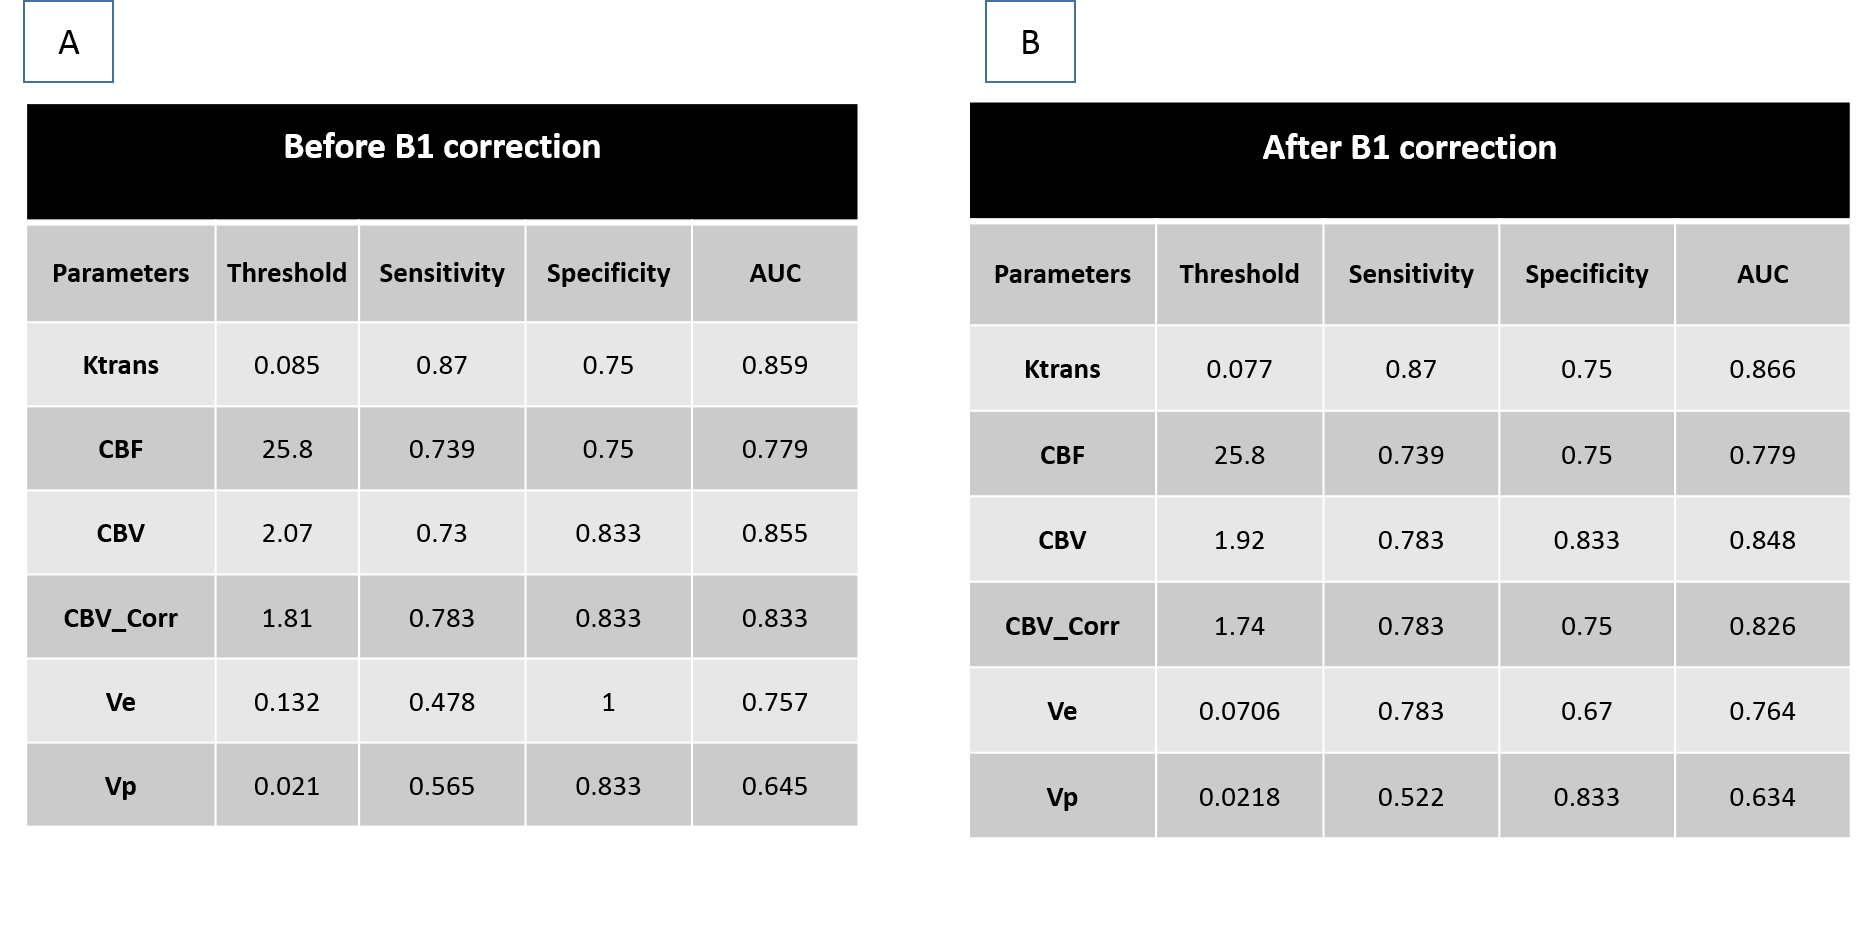
From Table1 it can be seen that RPE of all perfusion parameters shows an increasing trend with increase of B1rel values. For B1rel values less than the nominal value (which is equal to 1), RPE of perfusion-parameters is negative and vice-versa. From Table2 it was seen that variation of perfusion-parameters reduced after B1Corr within both HG and LG patients. Paired t-test result showed that changes for each perfusion-parameter before and after correction is significantly different (p <0.001). Bland-Altman plots in Fig(1) showed that the mean difference between before and after B1 corrected perfusion-parameters were outside the limits of agreement for few subjects, although a number of cases were border zone cases. In the current study, the sensitivity, specificity and AUC of perfusion-parameters from ROC analysis did not show any consistent change between pre and post B1Corr to come to any conclusive decision as shown in Table3 (A) and (B) . It can be seen from simulation studies of Fig3(A) that Patient 4 changed from HG to LG at B1rel ≤0.8, patient 3 changed from HG to LG at a B1 value ≤0.95, patient 6 changed from LG to HG at B1rel ≥ 1.15 whereas patient 9 changed from LG to HG at the B1rel value ≥1.25 . Fig3(B) shows the same graph for borderline patients 3, 4, 6 and 9 for better visualization.Discussion
It can also be intuitively seen that cut-off values for differentiating between grades will be varying as more and more patients are added to the study. It is not always possible to get appropriate cases where B1Corr can be shown to be of clinical significance. Appropriate cases are those where the perfusion-parameter at the ROI has values near the cut-off for grading and the location of ROI coincides with high B1FI. This may not happen in majority of glioma patients and can purely depend on chance. However using simulations over patient data, it was seen that grade changes in those cases where the deviation of the value of the perfusion-parameter from cutoff value is less.Conclusion
B1FI results in erroneous estimates of DCE perfusion-parameters which may influence glioma grading in cases where their values are on the borderline of cut-off value for separating high-grade from low-grade glioma.Acknowledgements
The Authors acknowledge technical support of Philips India Limited in MRI data acquisition. This work was supported by Science and Engineering Research Board (IN) (YSS/2014/000092).References
1. Hayes CE, Edelstein W a, Schenck JF, Mueller OM, Eash M. An Efficient , Highly Hokogeneous Radiofrequency Coil for Whole-Body NMR Imaging at 1 . 5 T. J. Magn. Reson. 1985;63:622–628. doi: 10.1016/0022-2364(85)90257-4.
2. Ibrahim TS, Lee R, Abduljalil AM, Baertlein BA, Robitaille P-ML. Dielectric resonances and B 1 field inhomogeneity in UHFMRI : computational analysis and experimental findings. Magn. Reson. Imaging 2001;19:219–226. doi: Doi 10.1016/S0730-725x(01)00300-9.
3. Ibrahim TS, Lee R, Baertlein BA, Abduljalil AM, Zhu H, Robitaille PML. Effect of RF coil excitation on field inhomogeneity at ultra high fields: A field optimized TEM resonatior. Magn. Reson. Imaging 2001;19:1339–1347. doi: 10.1016/S0730-725X(01)00404-0.
4. Wang J, Mao W, Qiu M, Smith MB, Constable RT. Factors influencing flip angle mapping in MRI: RF pulse shape, slice-select gradients, off-resonance excitation, and B0 inhomogeneities. Magn. Reson. Med. 2006;56:463–468. doi: 10.1002/mrm.20947.
5. Rennings A, Chen L, Otto S, Erni D. B1-Field Inhomogeneity Problem of MRI : Basic Investigations on a Head-Tissue-Simulating Cylinder Phantom Excited by a Birdcage-Mode. 2012:542–545.
6. Schabel MC, Parker DL. Uncertainty and bias in contrast concentration measurements using spoiled gradient echo pulse sequences. Phys. Med. Biol. [Internet] 2008;53:2345–2373. doi: 10.1088/0031-9155/53/9/010.
7. De Naeyer D, Verhulst J, Ceelen W, Segers P, De Deene Y, Verdonck P. Flip angle optimization for dynamic contrast-enhanced MRI-studies with spoiled gradient echo pulse sequences. Phys. Med. Biol. 2011;56:5373–5395. doi: 10.1088/0031-9155/56/16/019.
8. Di Giovanni P, Azlan C, Redpath T, Ahearn T, Semple S, Gilbert F. Breast tumour DCE-MRI in presence of B1 inhomogeneity, effect on Ktrans/ve using T1-weighted FLASH. Proc. 17th Sci. Meet. Int. Soc. Magn. Reson. Med. [Internet] 2009;Honolulu:2227.
9. Gupta SN, Sacolick LI, Hancu I, Tempany-afhdal C, Fennessy FM, Schmidt EJ. Improved T1 mapping and DCE MRI Pharmokinetic Quantification for Prostate at 3T by incorporating B1 Inhomogeneity Correction. 2010;243:151261.
10. Bedair R, Graves MJ, Patterson AJ, McLean MA, Manavaki R, Wallace T, Reid S, Mendichovszky I, Griffiths J, Gilbert FJ. Effect of Radiofrequency Transmit Field Correction on Quantitative Dynamic Contrast-enhanced MR Imaging of the Breast at 3.0 T. Radiology 2015:150920.
11. Yuan J, Chow SKK, Yeung DKW, Ahuja AT, King AD. Quantitative evaluation of dual-flip-angle T1 mapping on DCE-MRI kinetic parameter estimation in head and neck. Quant. Imaging Med. Surg. [Internet] 2012;2:245–53. doi: 10.3978/j.issn.2223-4292.2012.11.04.
12. Roberts C, Little R, Watson Y, Zhao S, Buckley DL, Parker GJM. The effect of blood inflow and B(1)-field inhomogeneity on measurement of the arterial input function in axial 3D spoiled gradient echo dynamic contrast-enhanced MRI. Magn. Reson. Med. [Internet] 2011;65:108–119. doi:10.1002/mrm.22593.
13. Sengupta A, Dadarwal R, Gupta R, Singh A. Evaluating effect of B1 field Inhomogeneity on DCE-MRI Data Analysis of Brain Tumor Patients at 3T. In: Proc. Intl. Soc. Mag. Reson. Med. 25 (2017). ; 2017.
14. Cunningham CH, Pauly JM, Nayak KS. Saturated double-angle method for rapid B1+ mapping. Magn. Reson. Med. 2006;55:1326–1333. doi: 10.1002/mrm.20896.
15. Chang LC, Cheng GK, Basser PJ, Pierpaoli C. Linear least-squares method for unbiased estimation of T1 from SPGR signals. Magn. Reson. Med. 2008;60:496–501. doi: 10.1002/mrm.21669.
16. Fram EK, Herfkens RJ, Johnson GA, Glover GH, Karis JP, Shimakawa A, Perkins TG, Pelc NJ. Rapid calculation of T1 using variable flip angle gradient refocused imaging. Magn. Reson. Imaging 1987;5:201–208.
17. Singh A, Haris M, Rathore D, Purwar A, Sarma M, Bayu G, Husain N, Singh Rathore RK, Gupta RK. Quantification of physiological and hemodynamic indices using T1 dynamic contrast-enhanced MRI in intracranial mass lesions. J. Magn. Reson. Imaging 2007;26:871–880. 18. Tofts PS, Kermode AG. Measurement of the blood-brain barrier permeability and leakage space using dynamic MR imaging. 1. Fundamental concepts. Magn Reson Med 1991;17:357–367.
Figures