5512
Support Vector Machine based Differentiation between Vasogenic Edema and Non-enhancing Tumor in High-Grade Glioma Patients using Pre and Post Surgery MRI Images1Centre for Biomedical Engineering, IIT Delhi, New Delhi, India, 2Electrical Engineering, IIT Delhi, New Delhi, India, 3Radiology, Fortis Memorial Research Institute, New Delhi, India
Synopsis
Differentiation of non-enhancing tumor from surrounding vasogenic edema is critical for planning tumor surgery as well as radiation therapy. Most studies suggested that histology results should be taken as ground truth instead of radiologist’s decision for validating results. This study is an attempt to differentiate vasogenic-edema from non-enhancing tumor based upon pre and post-surgery MRI images using a SVM classifier. DCE-MRI obtained perfusion parameters were used for classification. A misclassification error of 2.4 % was obtained for differentiating between non-enhancing tumor and edema using a SVM classifier followed by smoothing in post-processing step.
Introduction
The current standard for the radiologist’s assessment in patients with high-grade Glioma(HGG) relies on the Response-Assessment-in-Neuro-Oncology(RANO) criteria1 which expands upon the earlier Macdonald-criteria2, to incorporate the non-enhancing component of the tumor, as this component may indicate infiltrative or diffuse tumor growth. Most studies involving differentiation between vasogenic-edema and non-enhancing tumor(NET) takes radiologist based tumor delineation as ground truth3–5. However, analysis by radiologist are found to be subjective and there remains both inter and intra-rater differences6–8. Most studies have concluded that a histological spatial comparison involving samples obtained at surgery is needed to validate the results4,5,9. Post-surgery images provide the most reliable ground truth for validation. This study attempts to differentiate vasogenic-edema and NET of high-grade glioma(HGG) patients using a SVM classifier based upon pre and post-surgery MRI images.Methods
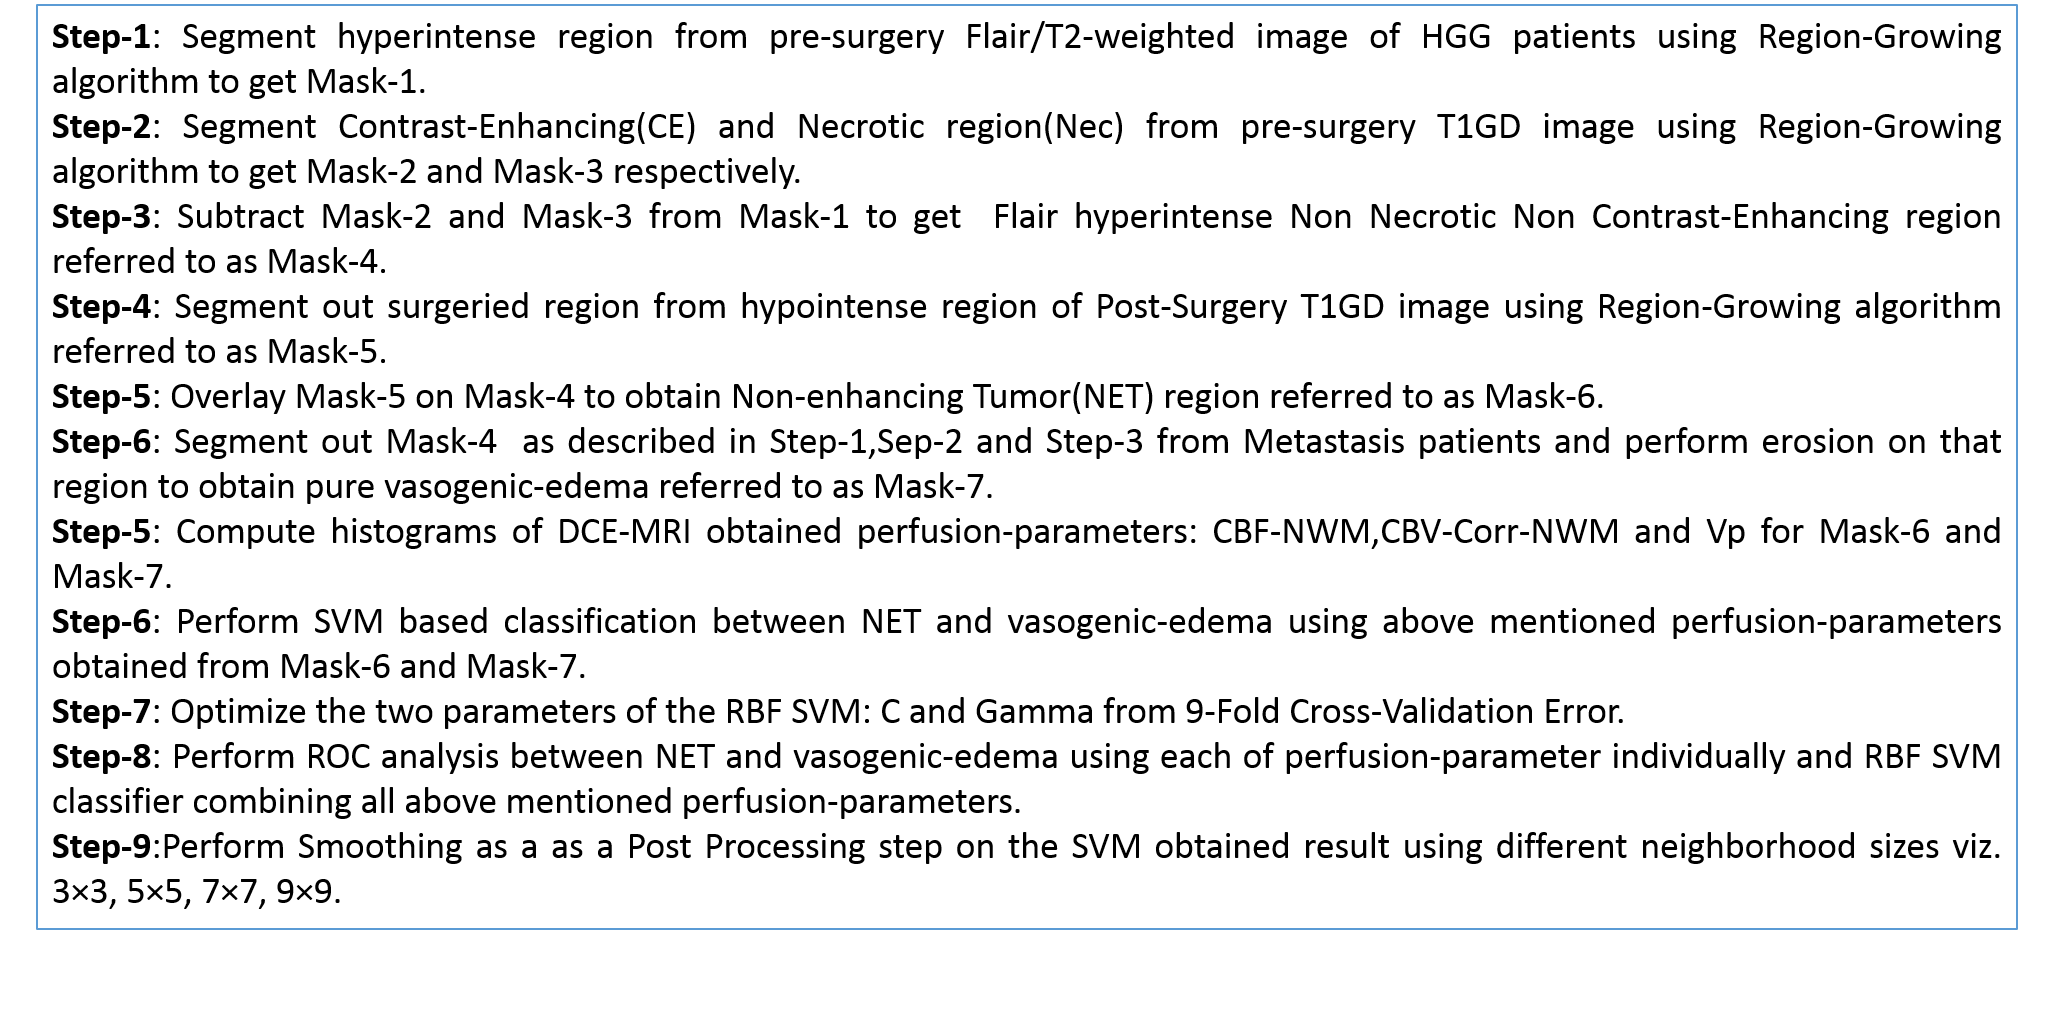
This study included MRI data from nine HGG patients (having pre-surgery and post-surgery MRI) and nine Metastasis-patients acquired at Philips 3T MR scanner. The mean time interval between pre-op and post-op of 9 Glioma patients was 3 months. MRI protocol for this study included conventional images for brain tumor patient, data for pre-contrast T1 maps, and T1-weighted dynamic-contrast-enhanced(DCE) MRI. DCE-MRI data was analysed using first pass analysis (parameters: cerebral-blood-volume(CBV), cerebral-blood-flow(CBF)) and generalized tracer kinetic model (parameters: Ktrans, Ve, Vp, Kep). CBV was also corrected for leakage (CBV-corr). CBV-Corr and CBF maps were normalized with respect to white matter tissue (CBF-NWM, CBV-corr-NWM). Perfusion -parameter maps were obtained using in-house built Matlab based software. Perfusion-parameters CBF-NWM, CBV-Corr-NWM and Vp were used for further analysis as the other parameters did not represent NET and vasogenic edema region entirely. Fig(1) provides a flow chart description of the study. It describes different steps for obtaining NET and vasogenic-edema followed by histogram analysis and SVM based classification. Vasogenic-edema was obtained from Metastasis-patients as there has been literature suggesting edema obtained from Metastasis-patients can be considered as pure edema10.Results
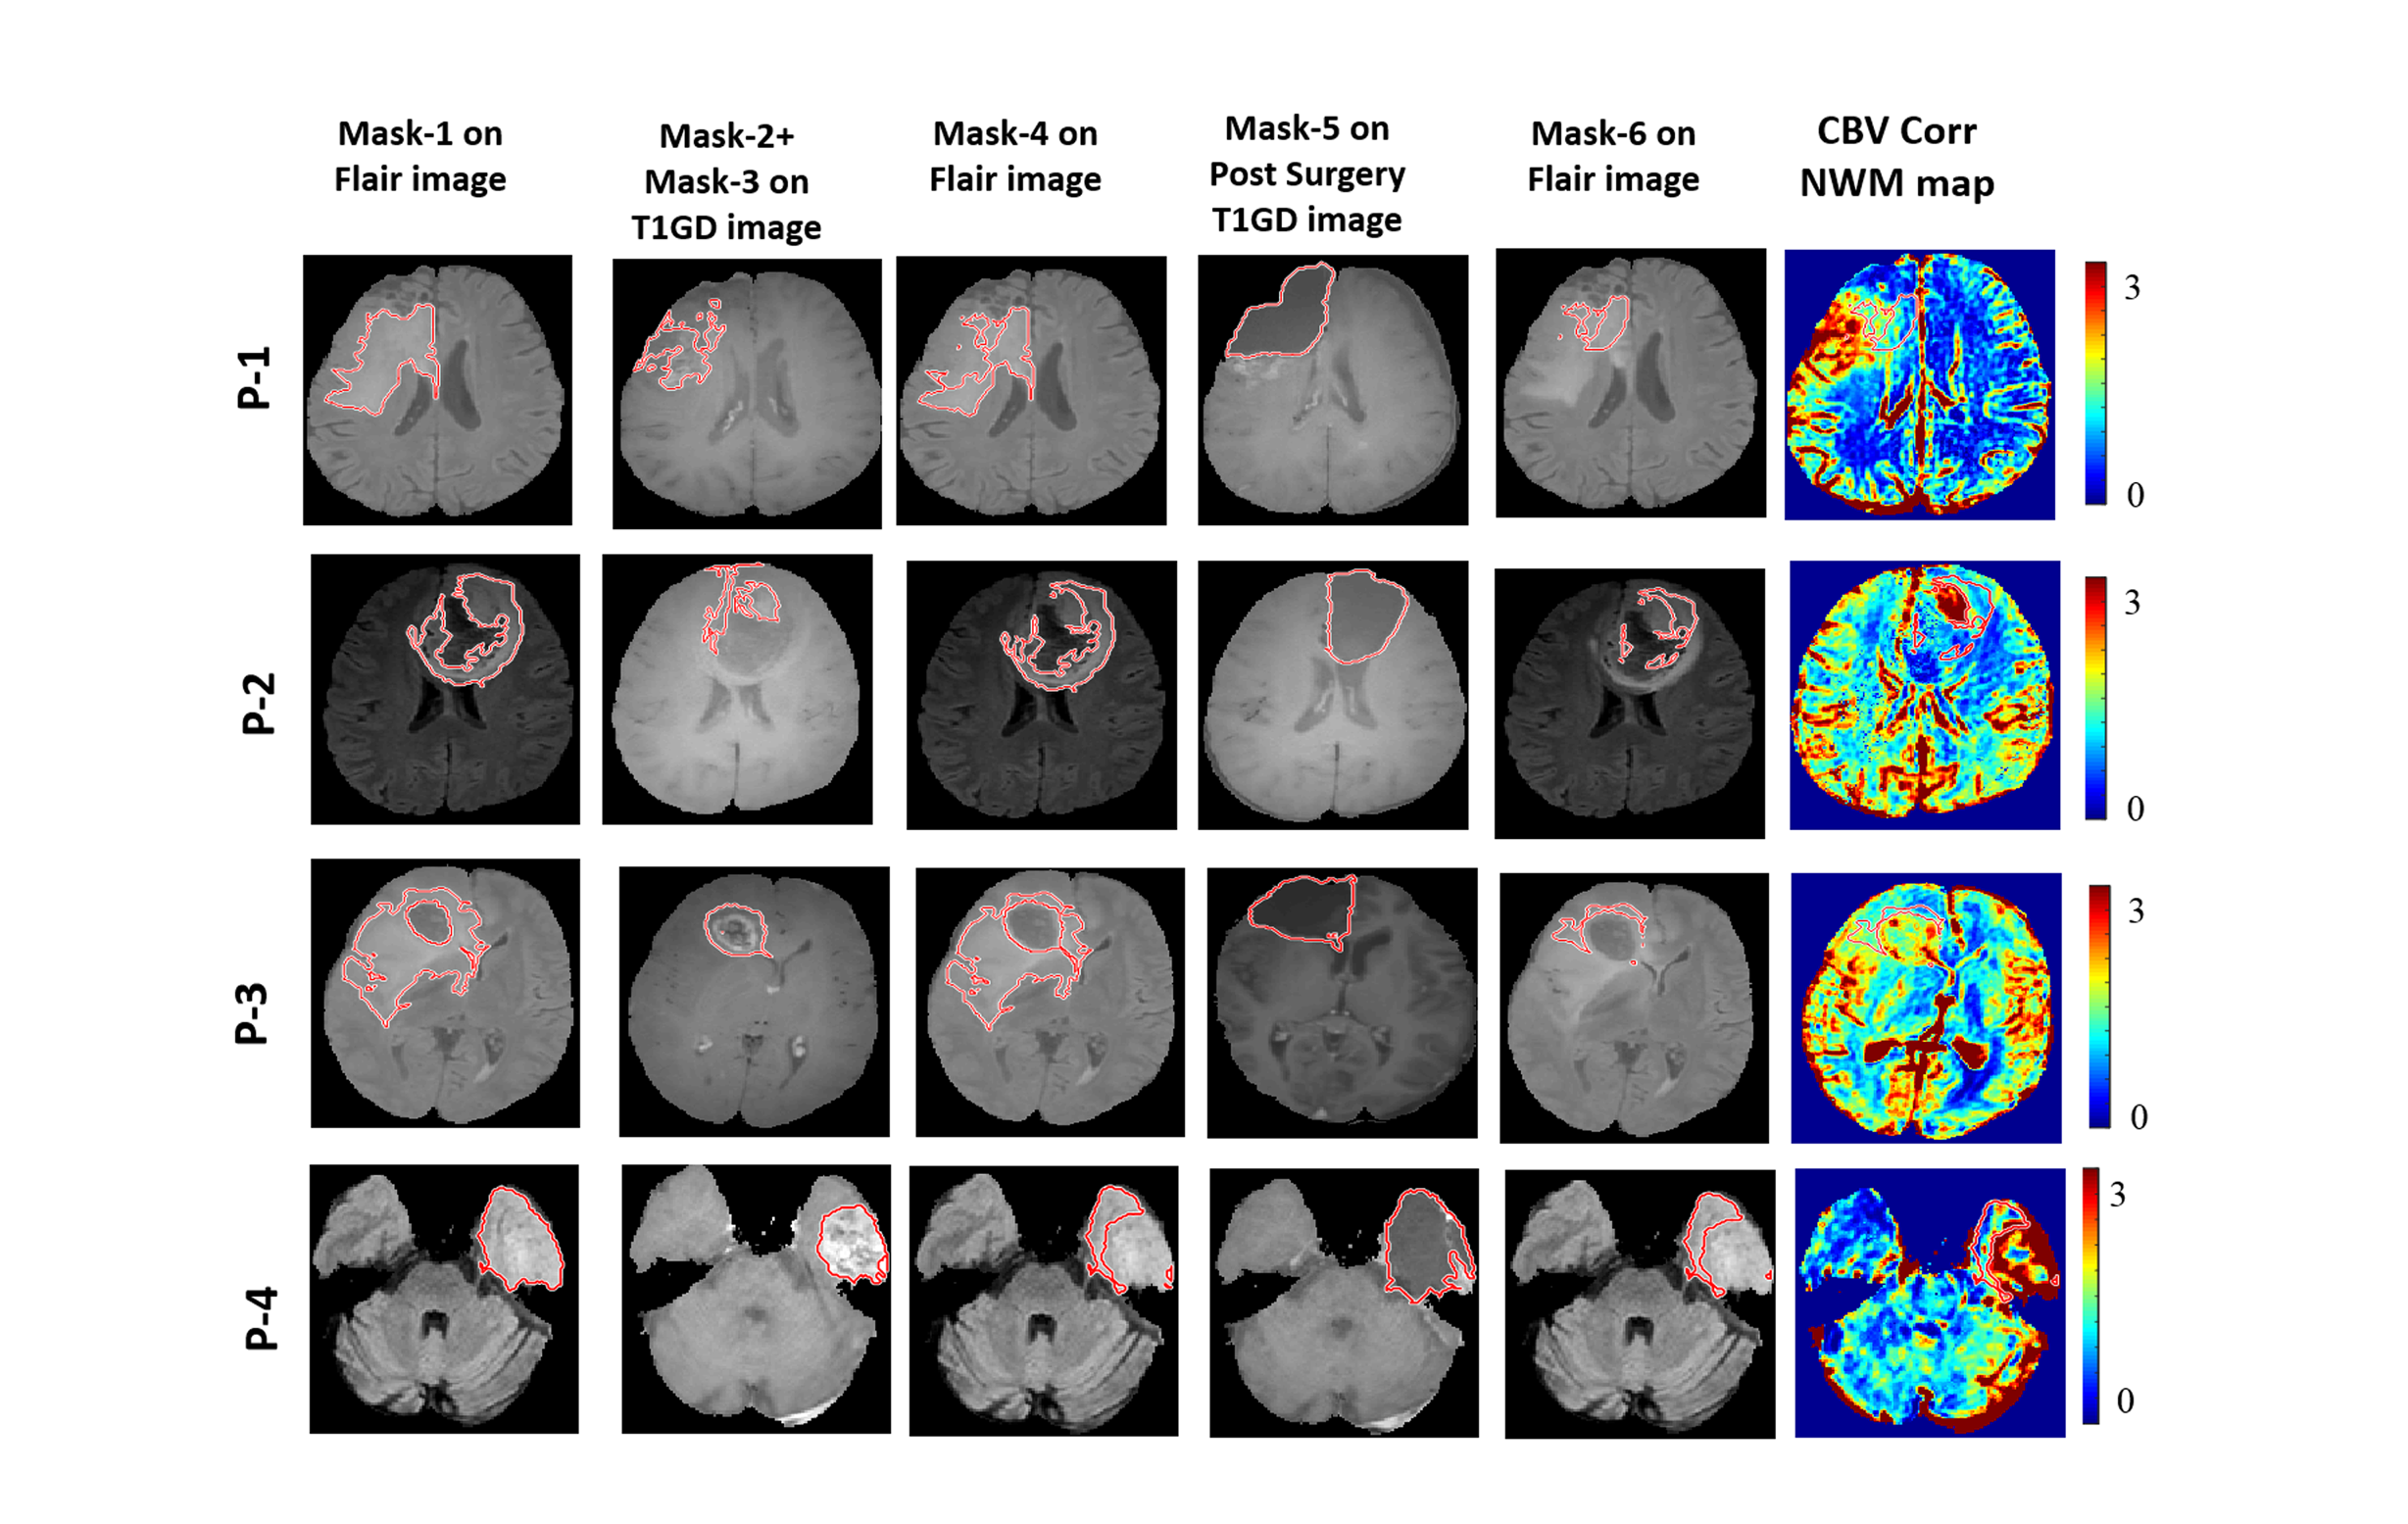
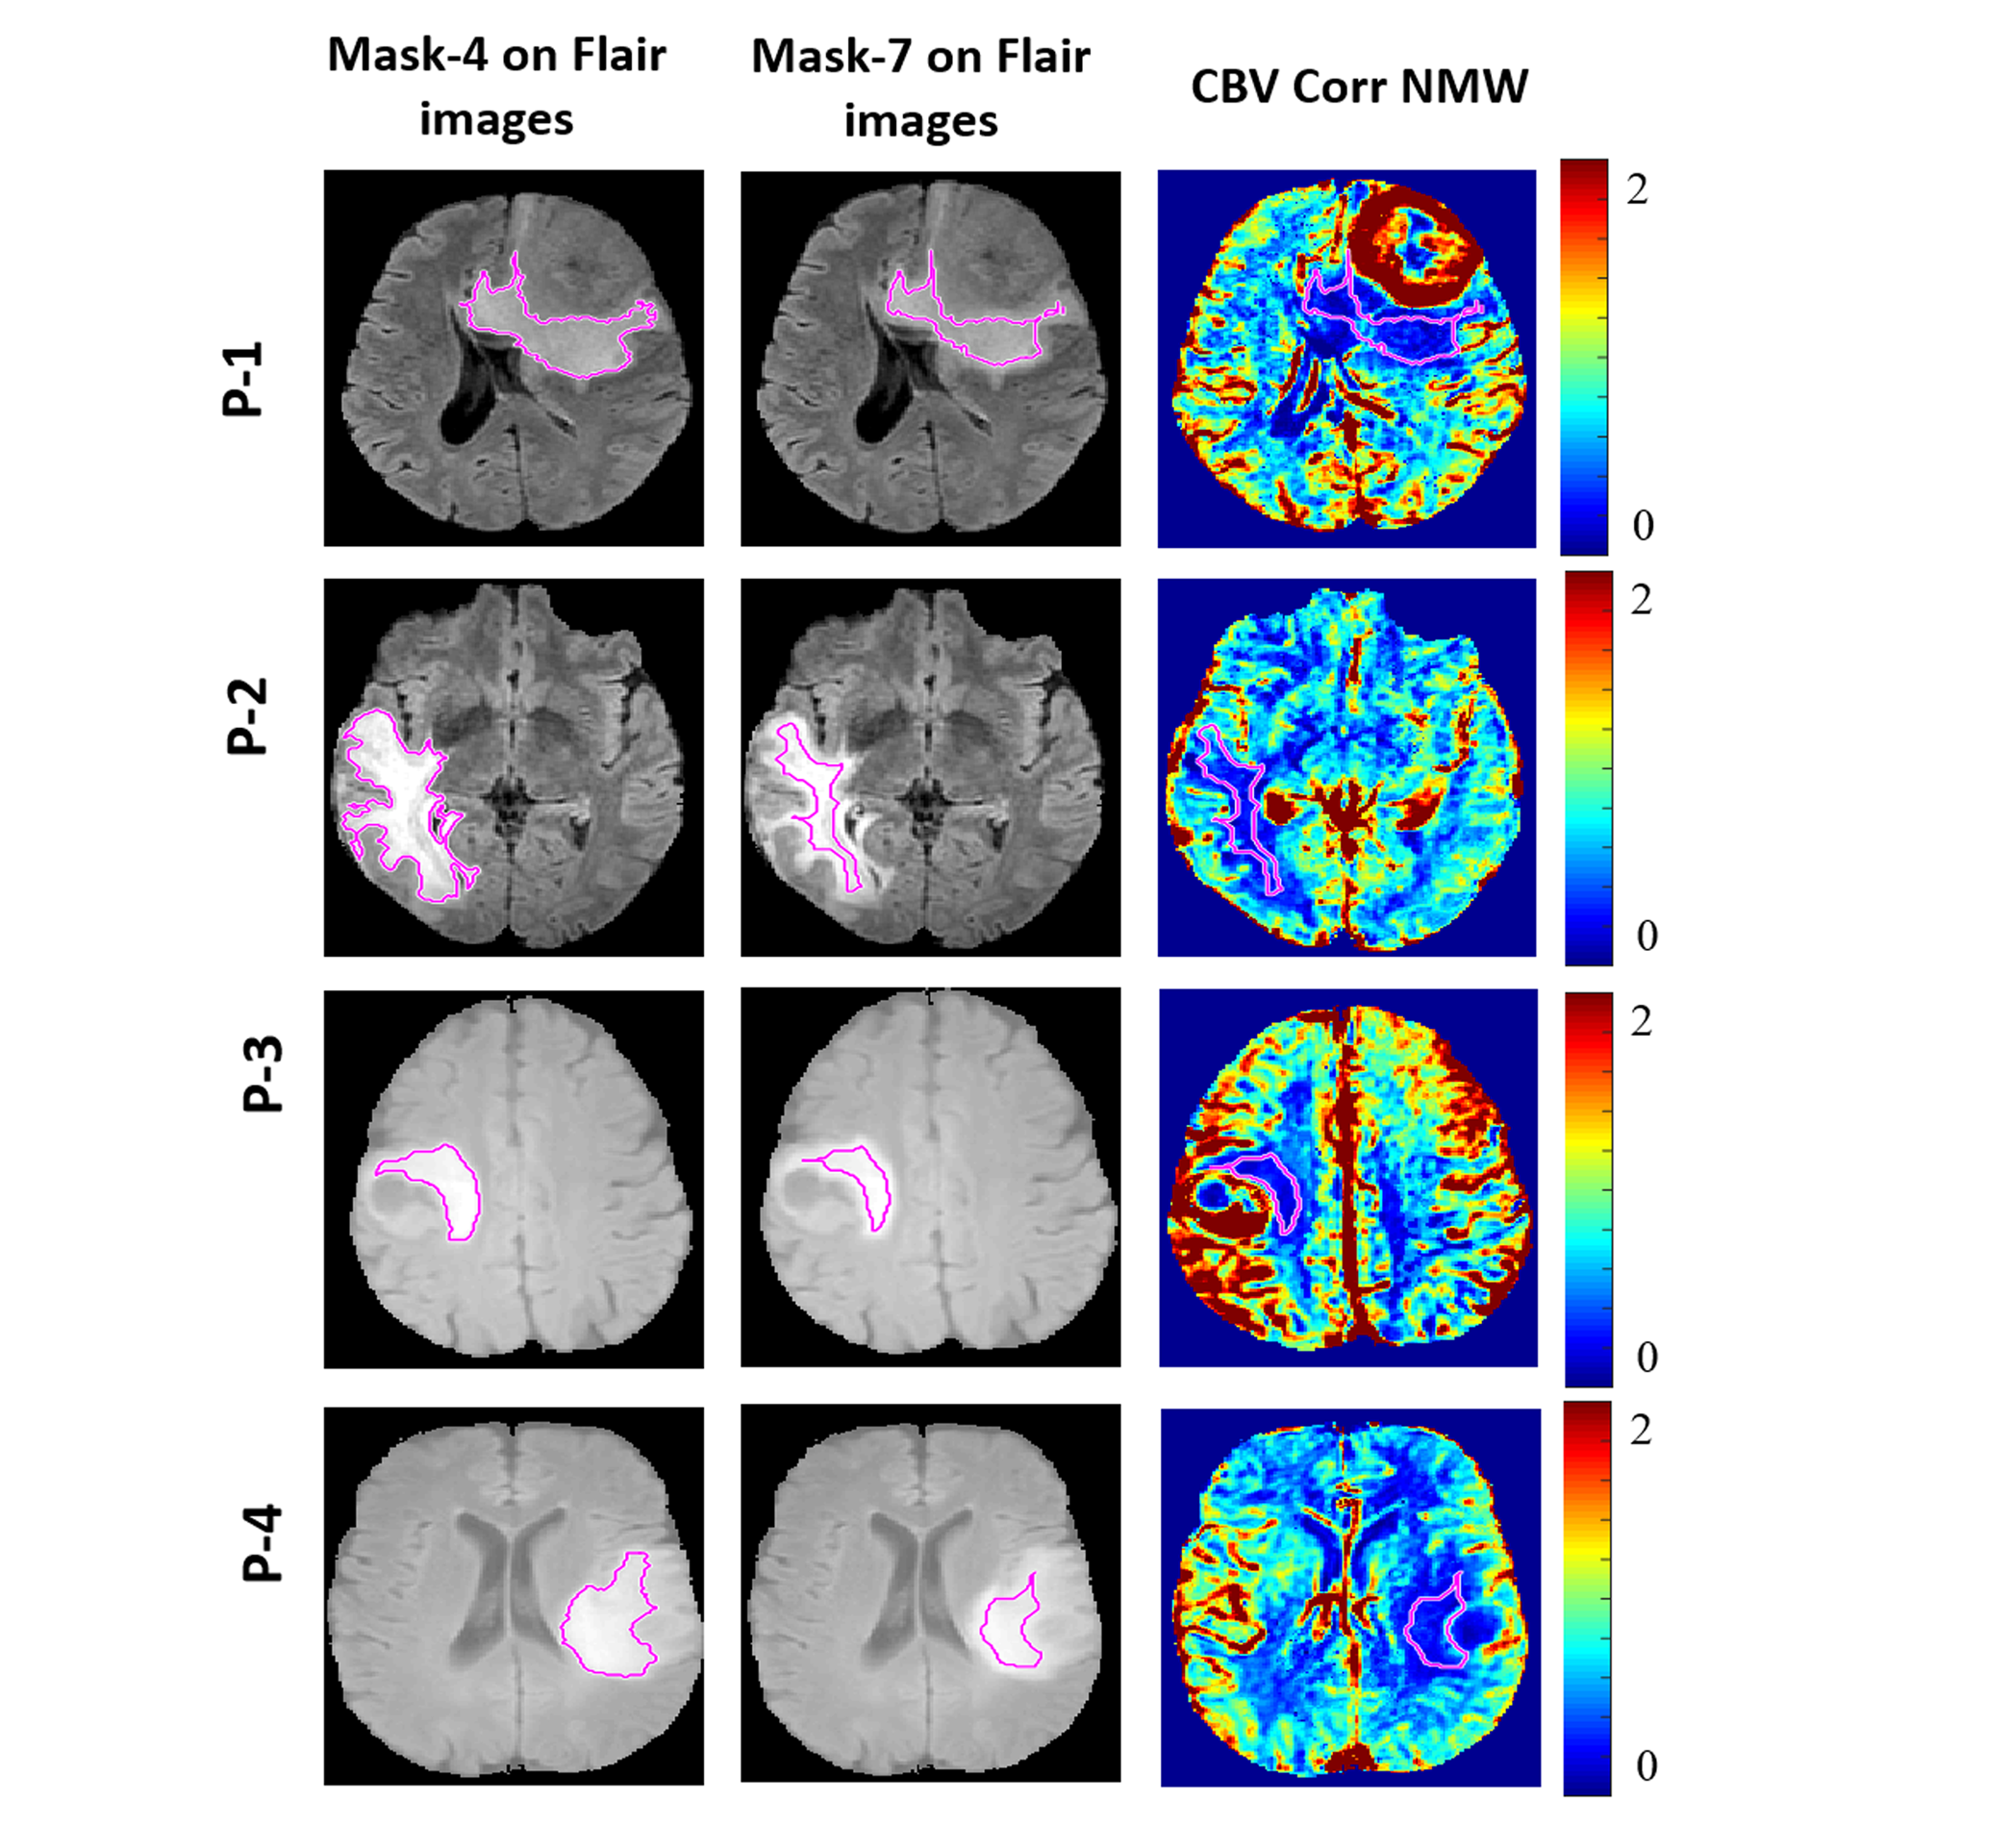
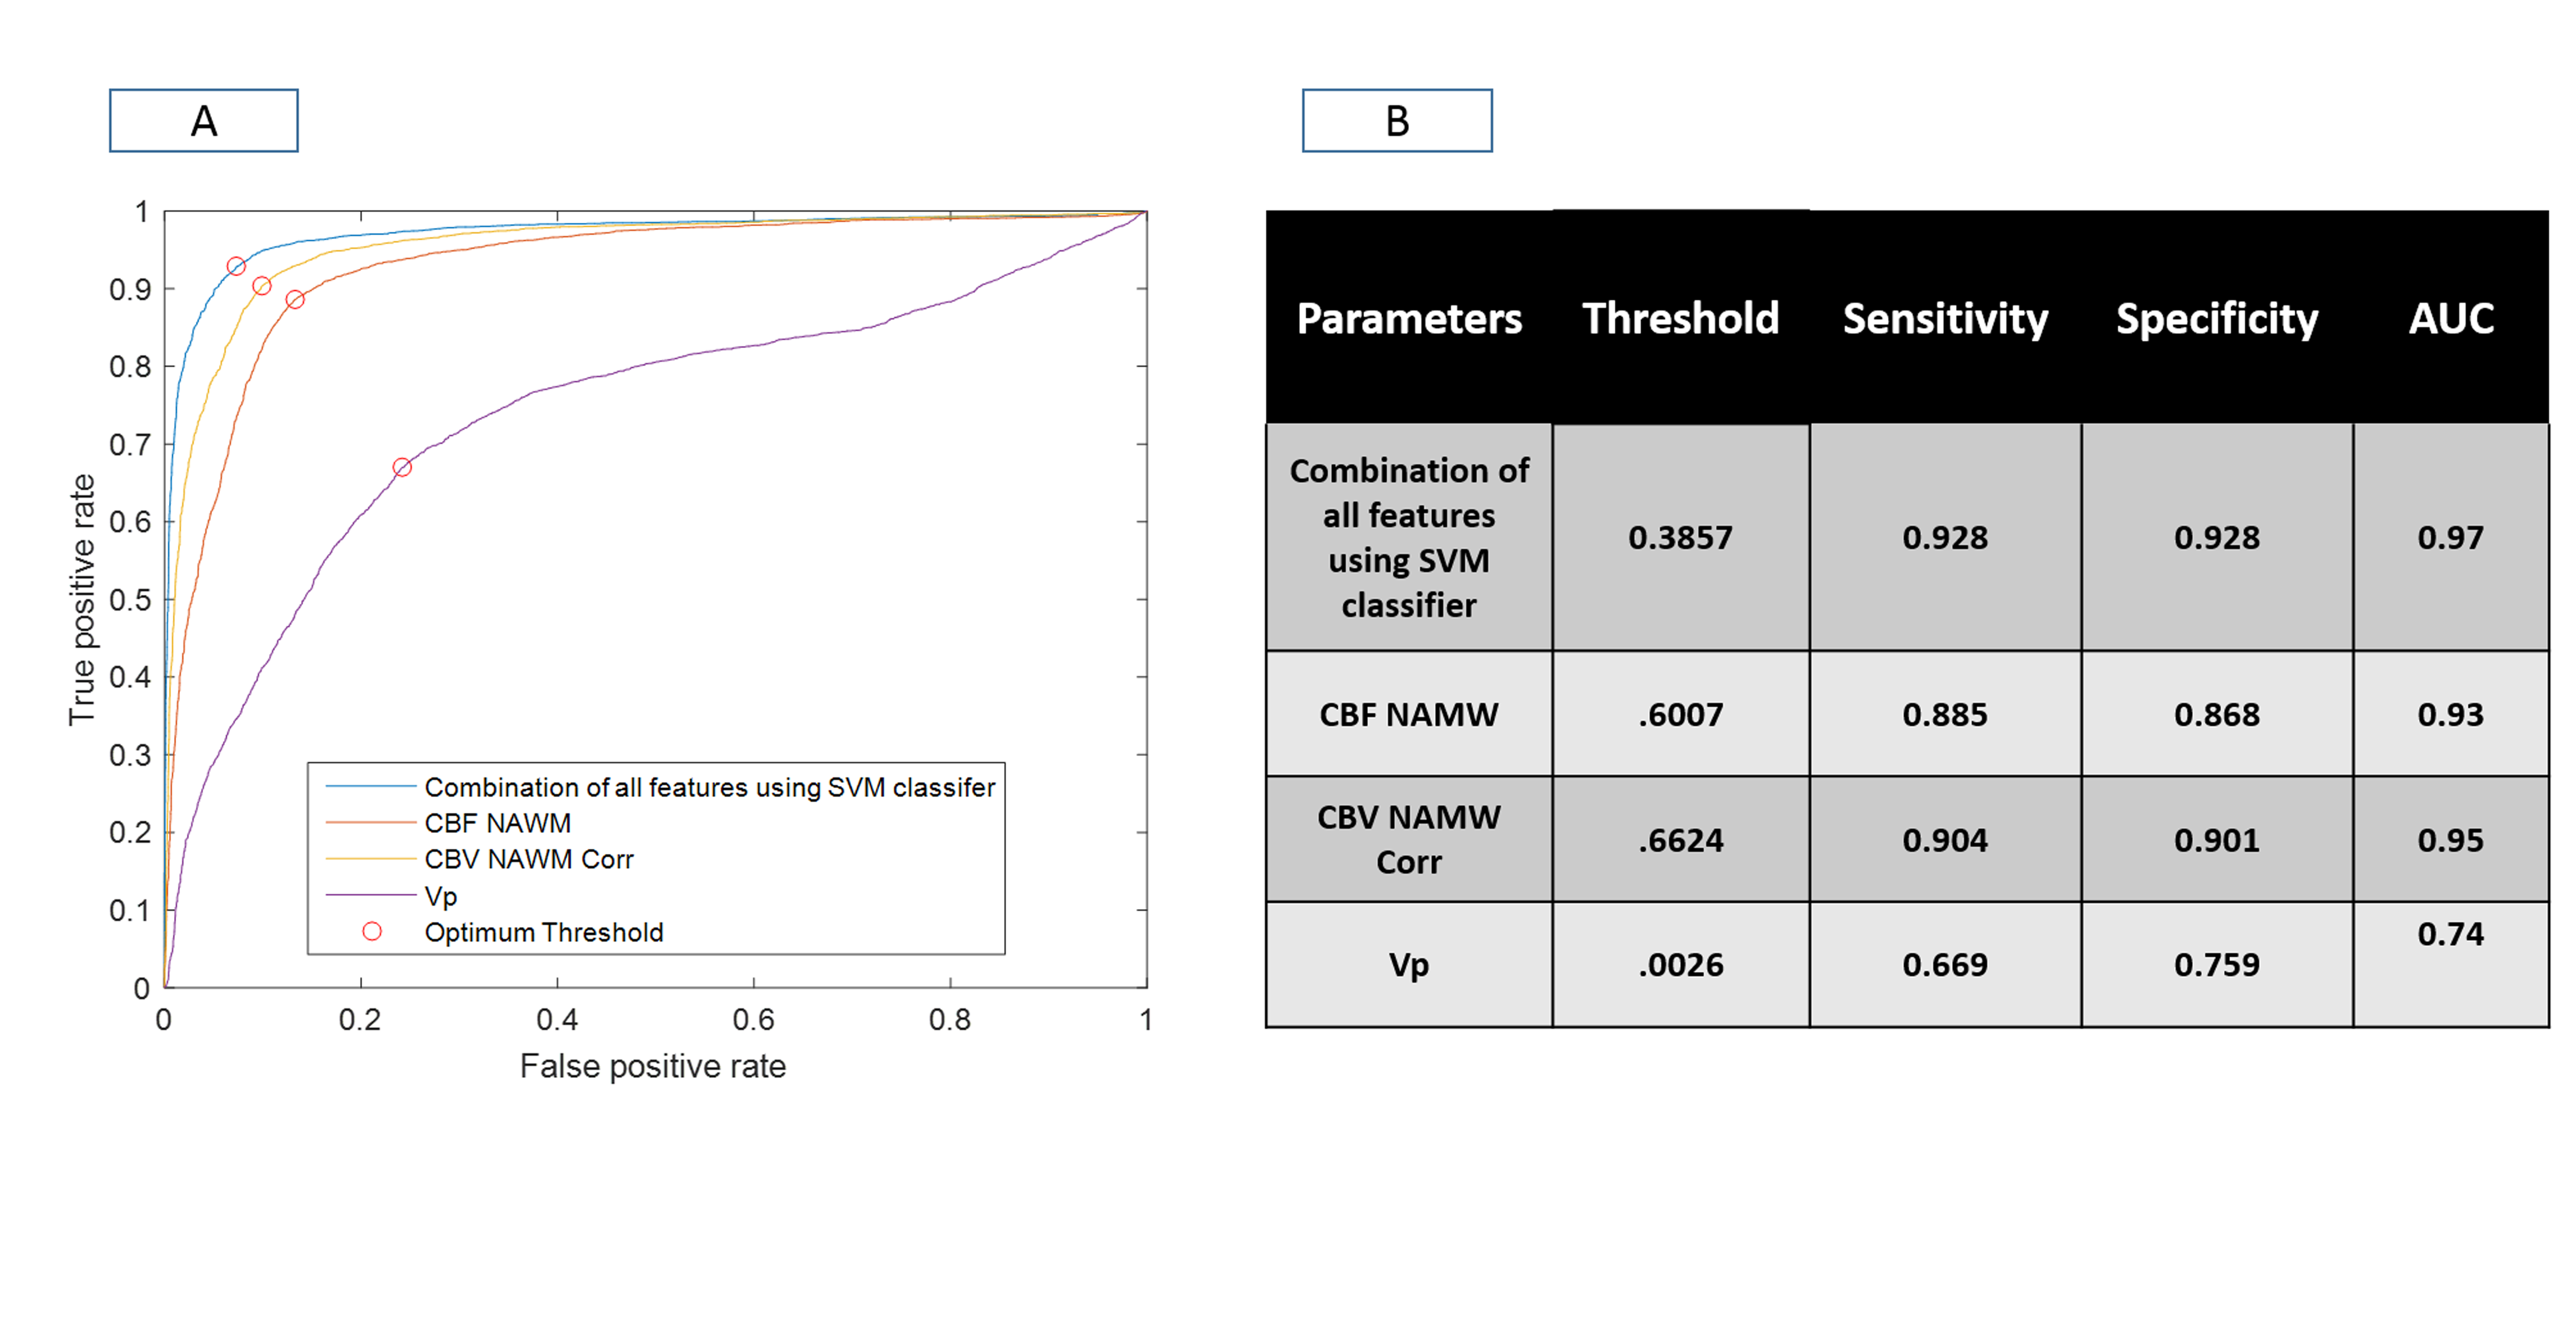
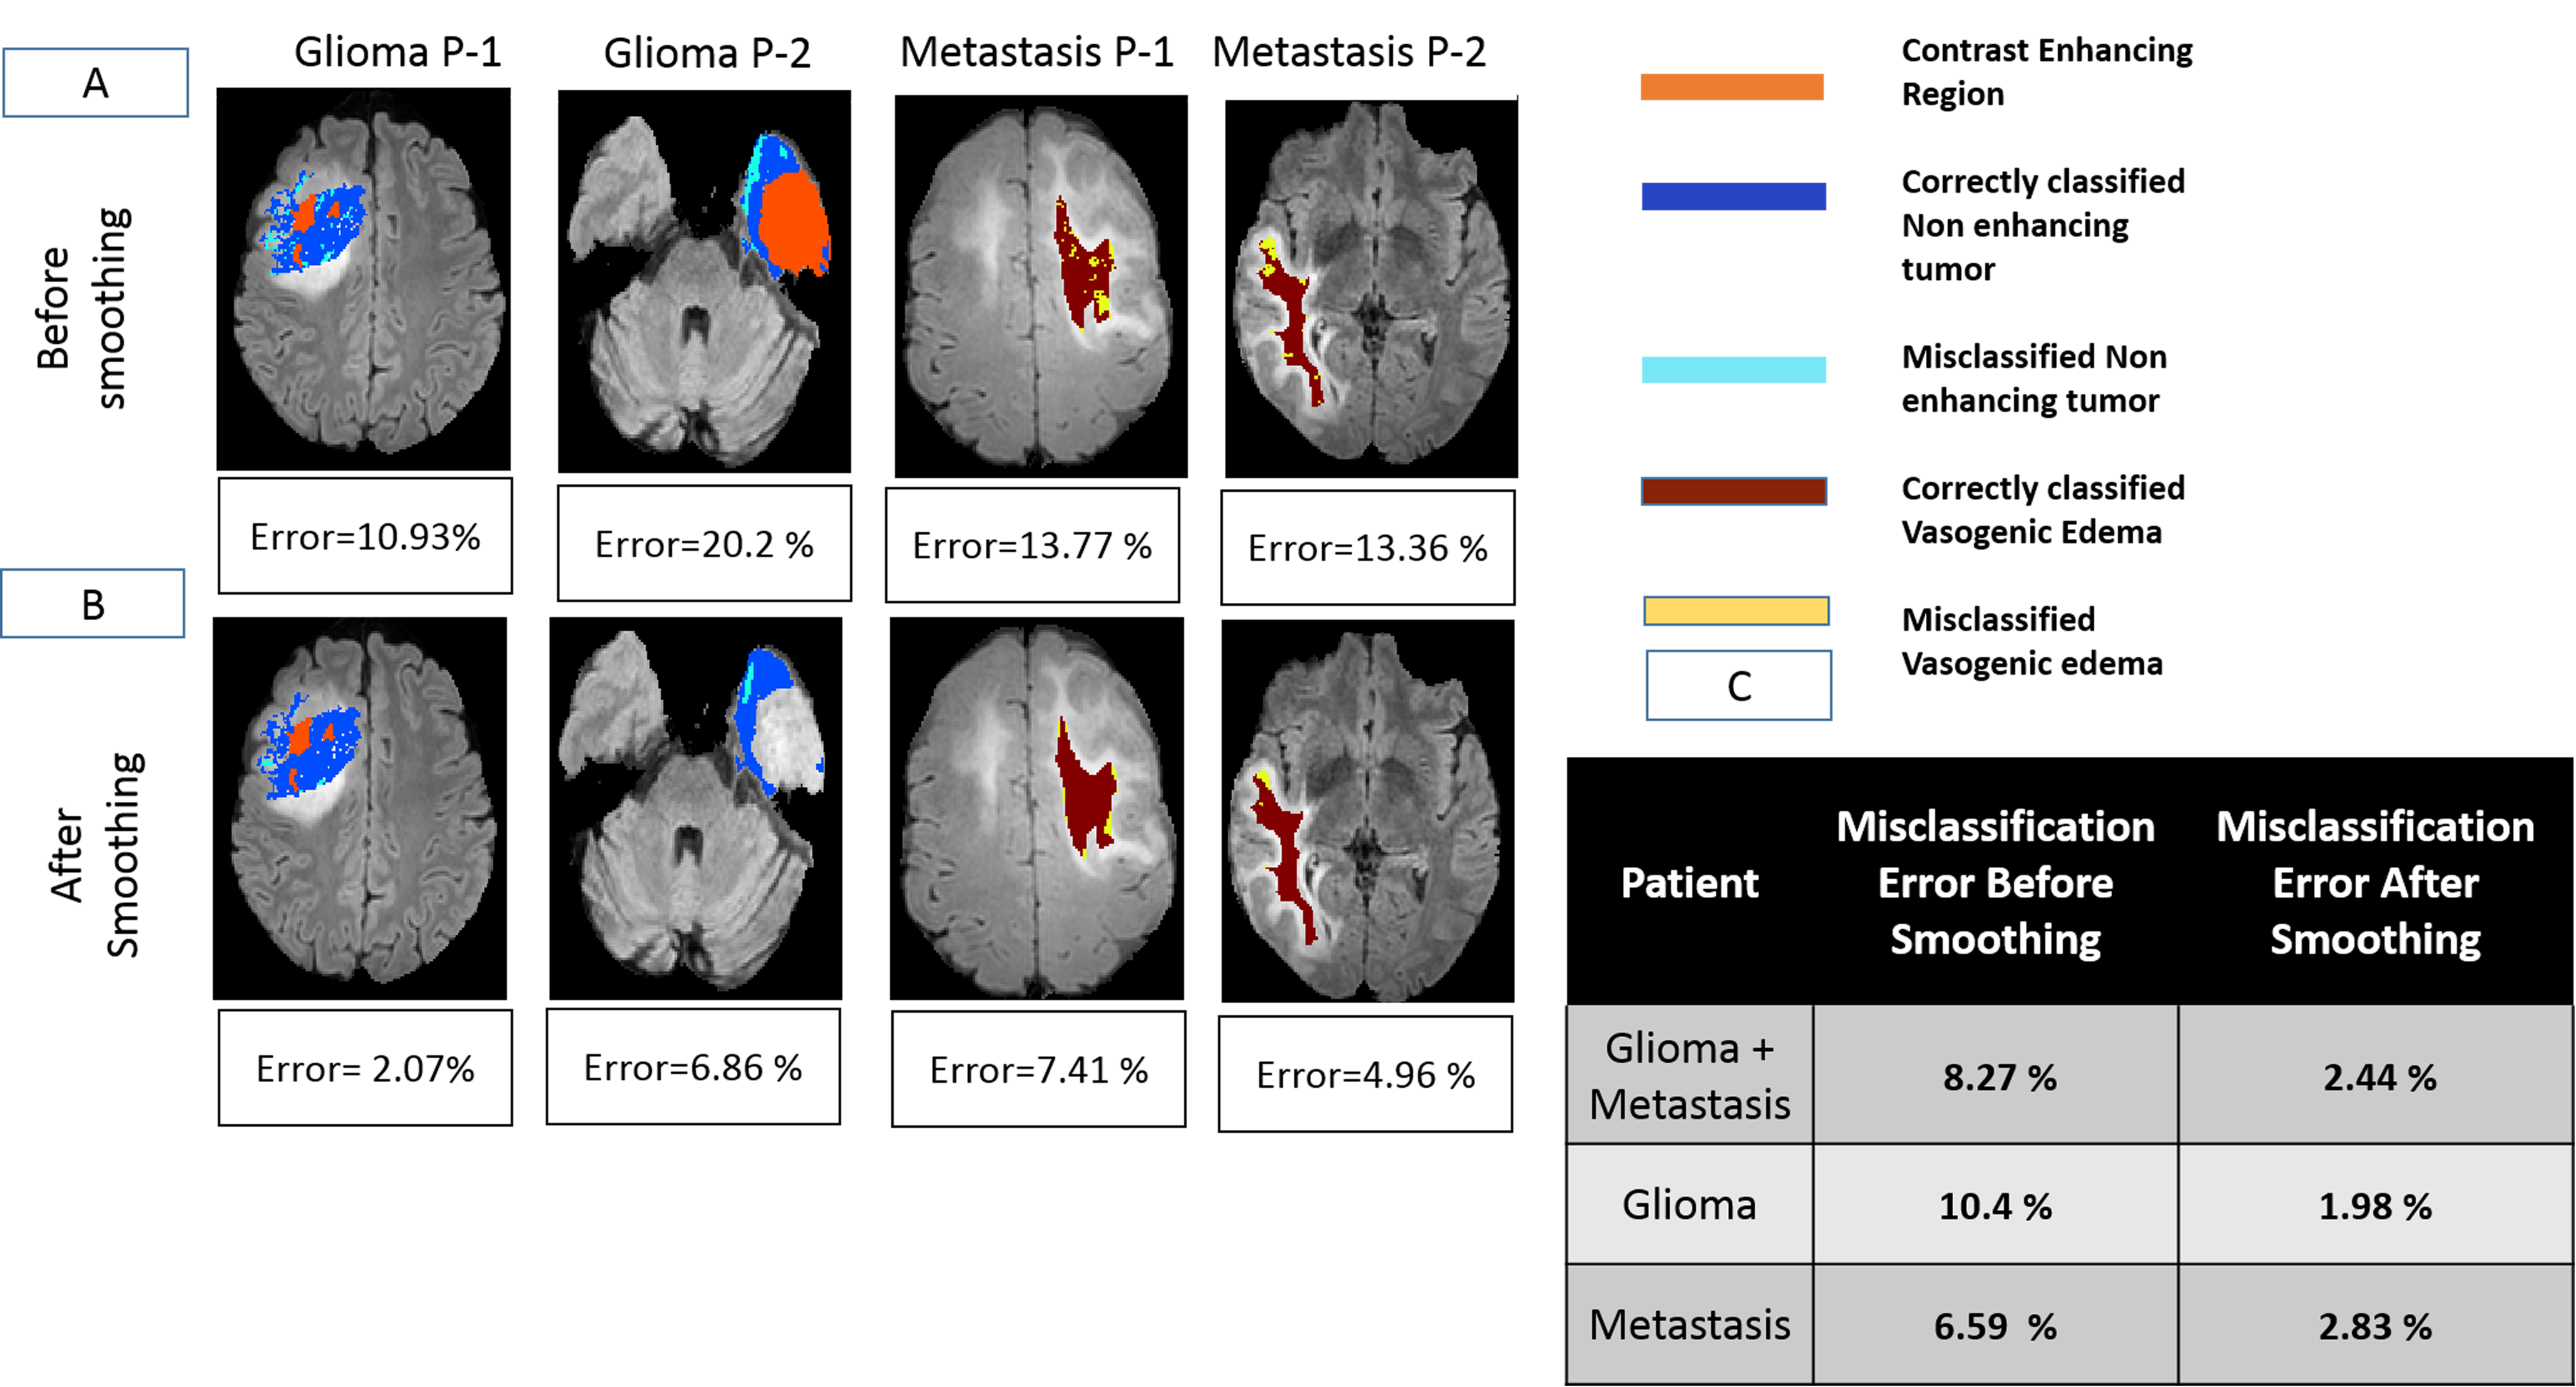
Fig(2) shows the different segmentation steps done for obtaining Mask-6 and the map of CBV-Corr-NWM parameter for that slice. It can be seen that the values of CBV-Corr-NWM are higher than neighborhood region in the NET region. Fig(3) shows segmentation of vasogenic-edema region from flair images of Metastasis-patients and the corresponding CBV-Corr-NWM map for that slice. It can be seen that CBV-Corr-NWM values are lower in the vasogenic-edema region than its neighborhood. The histogram distributions of 3 perfusion-parameters showed that there is some overlap between NET and vasogenic-edema region. CBF-NMW and CBV-Corr-NWM parameter have a much lesser overlap among the three regions than Vp (result not shown). The optimal value of C and Gamma for which 9-Fold CV error was minimised was found to be C=1000 and Gamma=10 (results not shown). ROC curve shown in Fig(4) shows that SVM classifier with all the perfusion-parameters combined, provides highest area under curve(AUC) as well as maximum sensitivity and specificity for classification between NET and vasogenic-edema region. After optimising the SVM classifier with respect to C and Gamma, combined error on classifying NET and vasogenic-edema came to ~ 8.3%. It was found that on applying a mean filter on a neighborhood size of 5×5 voxels, misclassification error for combined HGG patients and Metastasis-patients came down to a minimum of 2.43 % from 8.3% as shown in Fig(5).Discussion
One limitation of this study was that the pre-surgery MRI scans were not obtained exactly before the surgery. In order to overcome this problem, the study was designed such that only that much of surgeried region was considered which belonged to Mask-4 in pre-surgery flair images. It should be noted that subtracted T1GD image has been used for segmentation of Mask-2 and Mask-3 in this study, as that gives better contrast than post-contrast T1GD image. Another important point to mention is during pre-surgery, the entire Mask-1, Mask-2 and Mask-3 is our region of interest (ROI) in this study. Hence, the mean filter has been applied to the entire ROI and not only on NET region and vasogenic-edema. Thus it can be seen, from Fig(5) that misclassified labels occurring near the boundary of the labeled NET has been less rectified less by smoothing as they also had influence from pixels outside the labeled region. However, misclassification was significantly reduced post-processing (smoothing) in those areas where surrounding pixels are majorly of opposite class.Conclusion
This study proposes an automatic SVM based method for segmenting NET and vasogenic-edema using post-surgery images as the ground truth. This study would help doctors to delineate tumor area for planning surgery or radiation-therapy of tumor in HGG patients in a more reliable way.Acknowledgements
The Authors acknowledge technical support of Philips India Limited in MRI data acquisition. This work was supported by Science and Engineering Research Board (IN) (YSS/2014/000092).References
1. Wen PY, Macdonald DR, Reardon DA, et al. Updated response assessment criteria for high-grade gliomas: Response assessment in neuro-oncology working group. J. Clin. Oncol. 2010;28:1963–1972. doi: 10.1200/JCO.2009.26.3541.
2. Macdonald DR, Cascino TL, Schold SC, Cairncross JG. Response criteria for phase II studies of supratentorial malignant glioma. J. Clin. Oncol. [Internet] 1990;8:1277–1280. doi: 10.1200/JCO.1990.8.7.1277.
3. Blumenthal DT, Artzi M, Liberman G, Bokstein F, Aizenstein O, Ben Bashat D. Classification of High-Grade Glioma into Tumor and Nontumor Components Using Support Vector Machine. Am. J. Neuroradiol. [Internet] 2017;38:908–914. doi: 10.3174/ajnr.A5127.
4. Jensen TR, Schmainda KM. Computer-aided detection of brain tumor invasion using multiparametric MRI. J. Magn. Reson. Imaging 2009;30:481–489. doi: 10.1002/jmri.21878.
5. Artzi M, Bokstein F, Blumenthal DT, Aizenstein O, Liberman G, Corn BW, Ben Bashat D. Differentiation between vasogenic-edema versus tumor-infiltrative area in patients with glioblastoma during bevacizumab therapy: A longitudinal MRI study. Eur. J. Radiol. [Internet] 2014;83:1250–1256. doi: 10.1016/j.ejrad.2014.03.026.
6. Gordillo N, Montseny E, Sobrevilla P. State of the art survey on MRI brain tumor segmentation. Magn. Reson. Imaging [Internet] 2013;31:1426–1438. doi: 10.1016/j.mri.2013.05.002.
7. Mazzara GP, Velthuizen RP, Pearlman JL, Greenberg HM, Wagner H. Brain tumor target volume determination for radiation treatment planning through automated MRI segmentation. Int. J. Radiat. Oncol. Biol. Phys. [Internet] 2004;59:300–312. doi: 10.1016/j.ijrobp.2004.01.026.
8. Luo S, Li R, Orselin S. A new deformable model using dynamic gradient vector flow and adaptive balloon forces. APRS Work. Digit. Image Comput. [Internet] 2003:489–490.
9. Artzi M, Blumenthal DT, Bokstein F, Nadav G, Liberman G, Aizenstein O, Ben Bashat D. Classification of tumor area using combined DCE and DSC MRI in patients with glioblastoma. J. Neurooncol. 2015;121:349–357. doi: 10.1007/s11060-014-1639-3. 10. Fink KR, Fink JR. Imaging of brain metastases. Surg Neurol Int [Internet] 2013;4:S209-19. doi: 10.4103/2152-7806.111298
Figures