5511
A reference region version of the two-compartment exchange model for DCE-MRI1Medical Physics Unit, McGill University, Montreal, QC, Canada, 2Research Institute of the McGill University Health Centre, Montreal, QC, Canada
Synopsis
This work proposes a version of the two-compartment exchange model (2CXM) for dynamic contrast enhanced MRI that does not require an arterial input function (AIF). Instead, the proposed model uses the tracer-concentration from a reference region, with the assumption that the AIF is shared between the reference region and tissue of interest. The proposed model was evaluated in simulation and in-vivo where it had comparable performance to the conventional 2CXM with temporal sampling faster than 10 s. With slower temporal sampling, the reference region version had better accuracy and precision than the conventional 2CXM.
Introduction
Quantitative analysis of dynamic contrast enhanced (DCE) MRI fits a tracer-kinetic model to the acquired data. The two-compartment exchange model (2CXM) is a generally applicable model subject to fewer limitations than the common Tofts model.1
A major challenge with using either of these models is the required knowledge of the arterial input function (AIF). The reference region model (RRM) uses a reference tissue as a substitute for the AIF, and this approach has been used with the Tofts model.2 This work introduces the reference region approach to the 2CXM, leading to a modified 2CXM that does not require an AIF.
Theory
The linearized 2CXM has the form3:
$$C(t) = -\alpha \overline{\overline{C(t)}} - \beta \overline{C(t)} + \gamma \overline{\overline{c_a(t)}} + F_p \overline{c_a(t)}$$
where $$$C$$$ is the tracer concentration in the voxel, $$$c_a$$$ is the input function, and a single (double) overline denotes a single (double) integral over time. The fitting parameters are $$$\alpha = 1/T_e T_p$$$, $$$\beta = T_e+T_p / T_e T_p$$$, $$$\gamma = F_p T / T_e T_p$$$, and $$$F_p$$$. These fitting parameters can be further manipulated to obtain $$$PS$$$, $$$v_e$$$ and $$$v_p$$$.
The proposed reference region version of the 2CXM (RR2CXM) has the form:
$$C(t) = x_1 \overline{\overline{C(t)}} + x_2 \overline{C(t)} + x_3 C_{RR}(t) + x_4 \overline{C_{RR}(t)} + x_5 \overline{\overline{C_{RR}(t)}} $$
where $$$C_{RR}$$$ is the tracer concentration in a reference tissue that can be modelled by the Tofts model, i.e. it can be described by $$$K_{RR}^{trans}$$$ and $$$v_{e,RR}$$$, with $$$v_{p,RR}=0$$$. The fitting parameters are $$$x_1=-α$$$, $$$x_2=-β$$$, $$$x_3=F_p/K_{RR}^{trans}$$$, $$$x_4=γ/K_{RR}^{trans}+F_p/v_{e,RR}$$$, and $$$x_5=γ/v_{e,RR}$$$. Further manipulation of these parameters provides relative values for $$$PS$$$, $$$v_e$$$ and $$$v_p$$$.
Methods
The proposed model was evaluated in simulation using publicly-available code from a previous study which includes an implementation of the linear 2CXM.4 Concentration-time curves were generated for tissues with $$$F_p \in [0.08,0.33]$$$ min-1, $$$PS \in [0.003,0.14]$$$ min-1, $$$v_e \in [0.06,0.43]$$$, and $$$v_p \in [0.05,0.11]$$$ for a duration of 300 s. Gaussian noise was added, with SNR defined as the peak tissue concentration divided by the standard deviation of noise, and 10,000 replications were used for each SNR.
In-vivo evaluation was performed on publicly-available DCE-MRI data from a single mouse with an inoculated tumour in the hind leg.5 The data was acquired at 7 T with a temporal resolution of 3.5 s for a duration of 15 minutes. A reference tissue curve was produced through an automated clustering approach developed in our group, and this curve was used with the RR2CXM. For comparison purposes, the 2CXM was fitted to the same data using an AIF defined by the bi-exponential model and literature-based parameters.6 This AIF was also used to obtain absolute parameters with the RR2CXM using the RRIFT approach.7
Results and Discussion
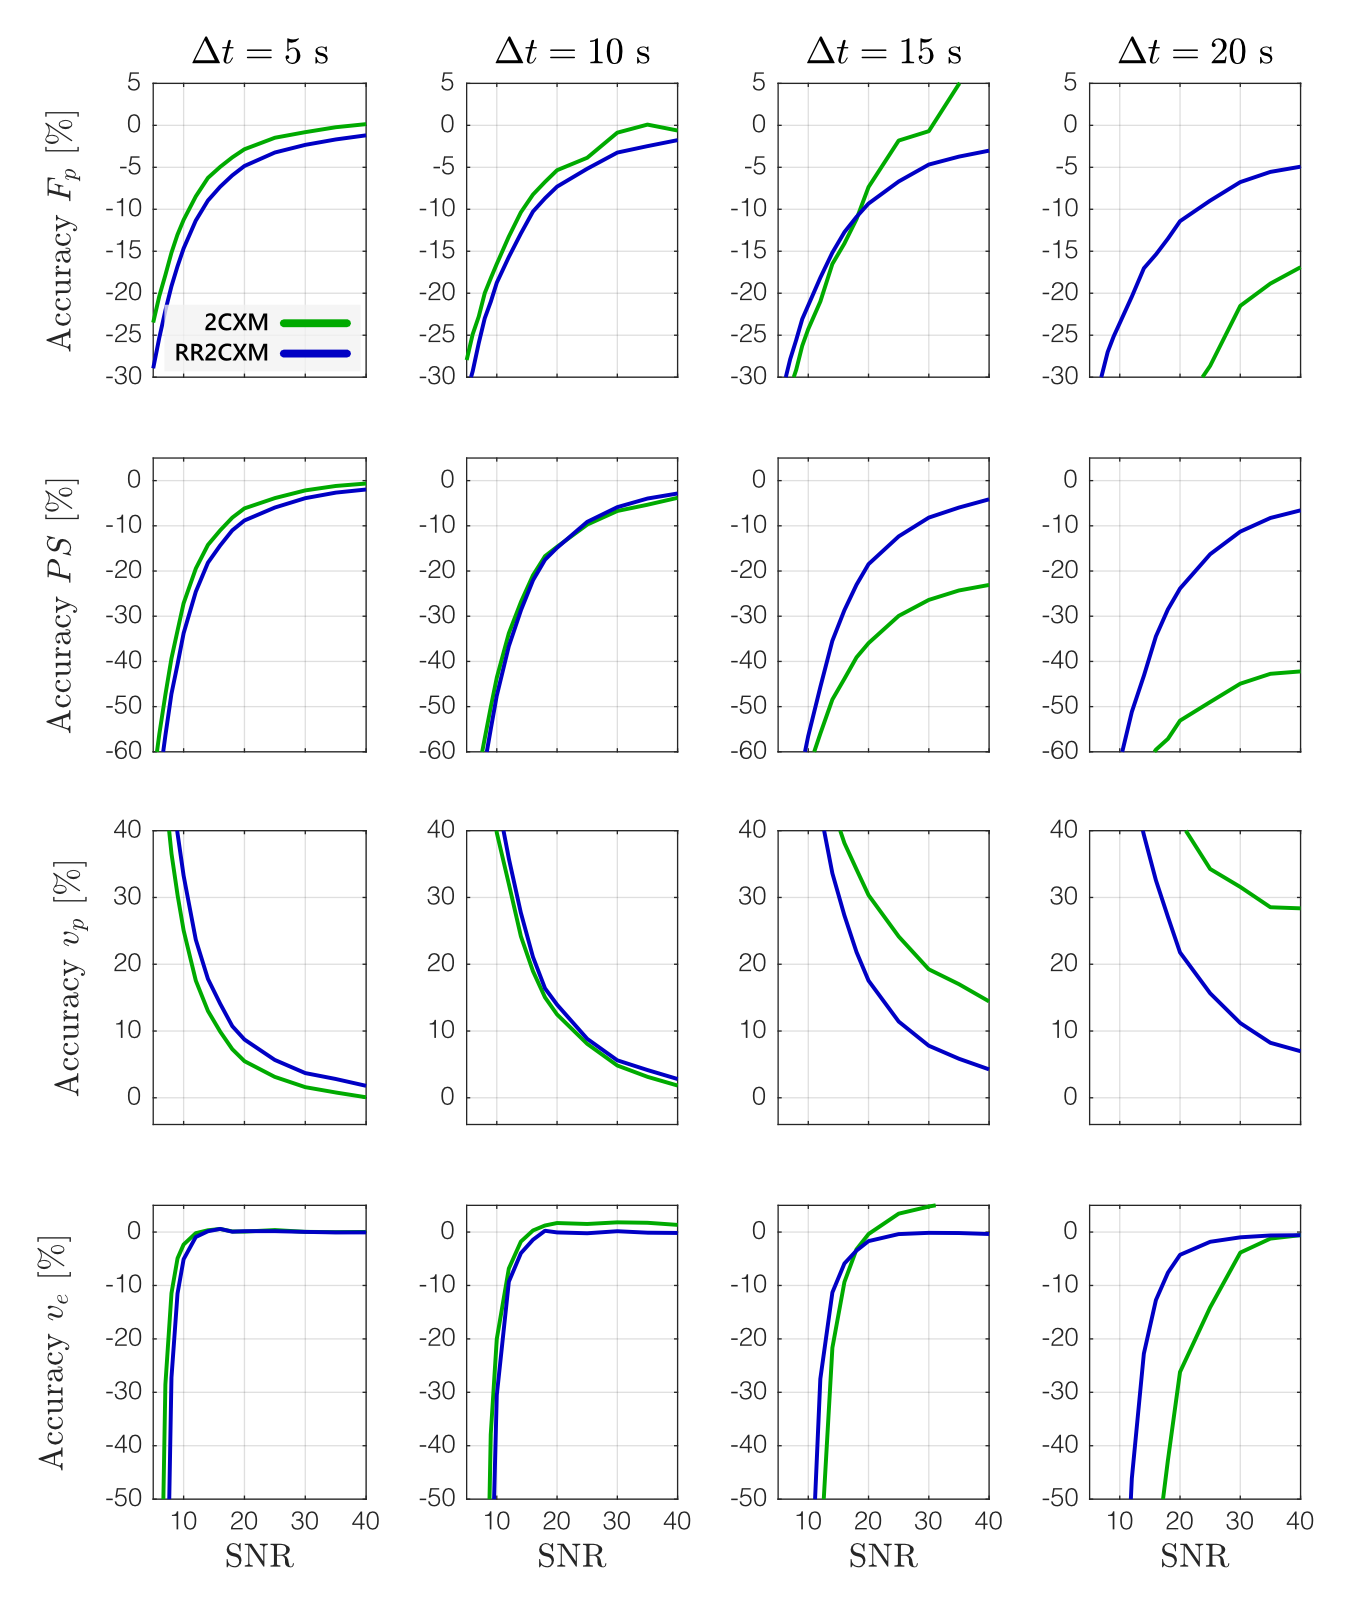
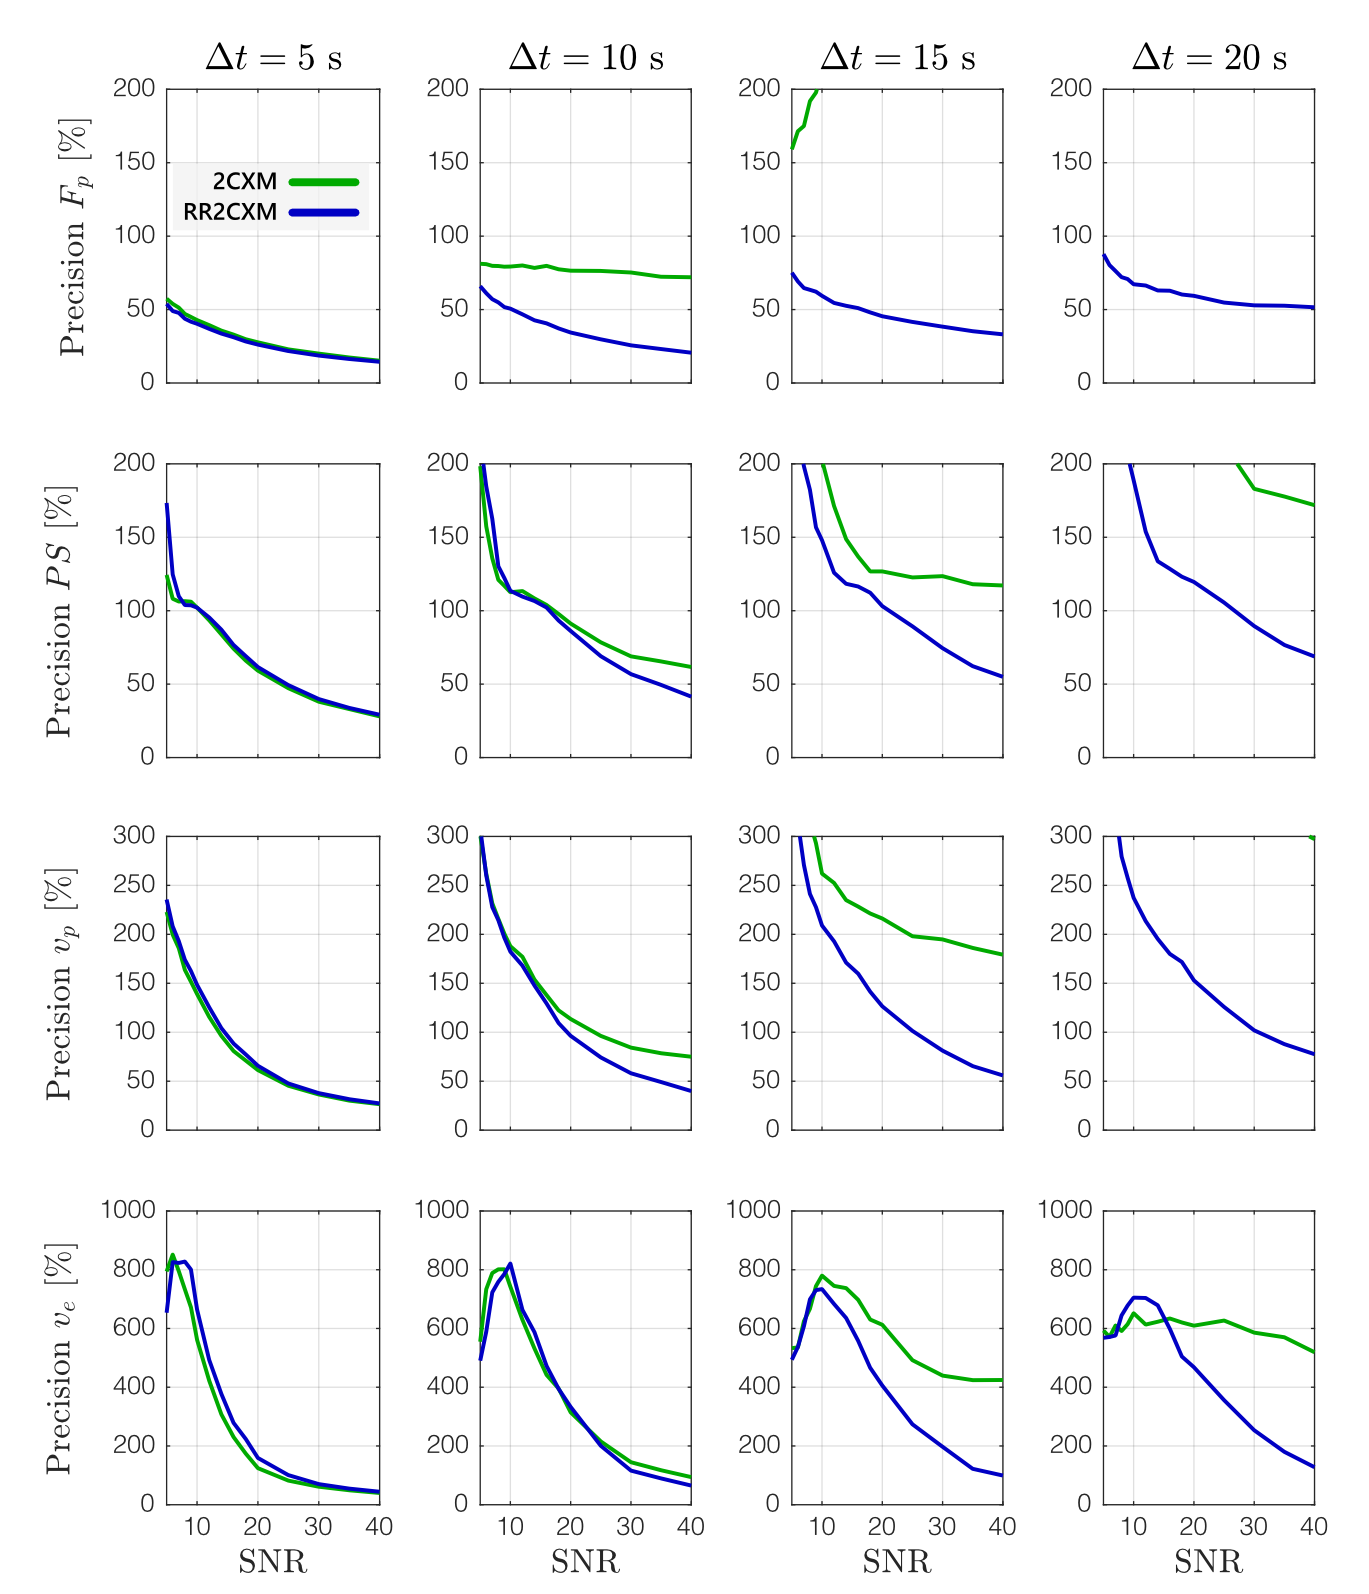
In simulation, the RR2CXM had comparable accuracy and precision to the 2CXM with temporal sampling faster than 10 s (Figures 1 and 2). At temporal sampling slower than 10 s, the RR2CXM had better accuracy and precision than the 2CXM.
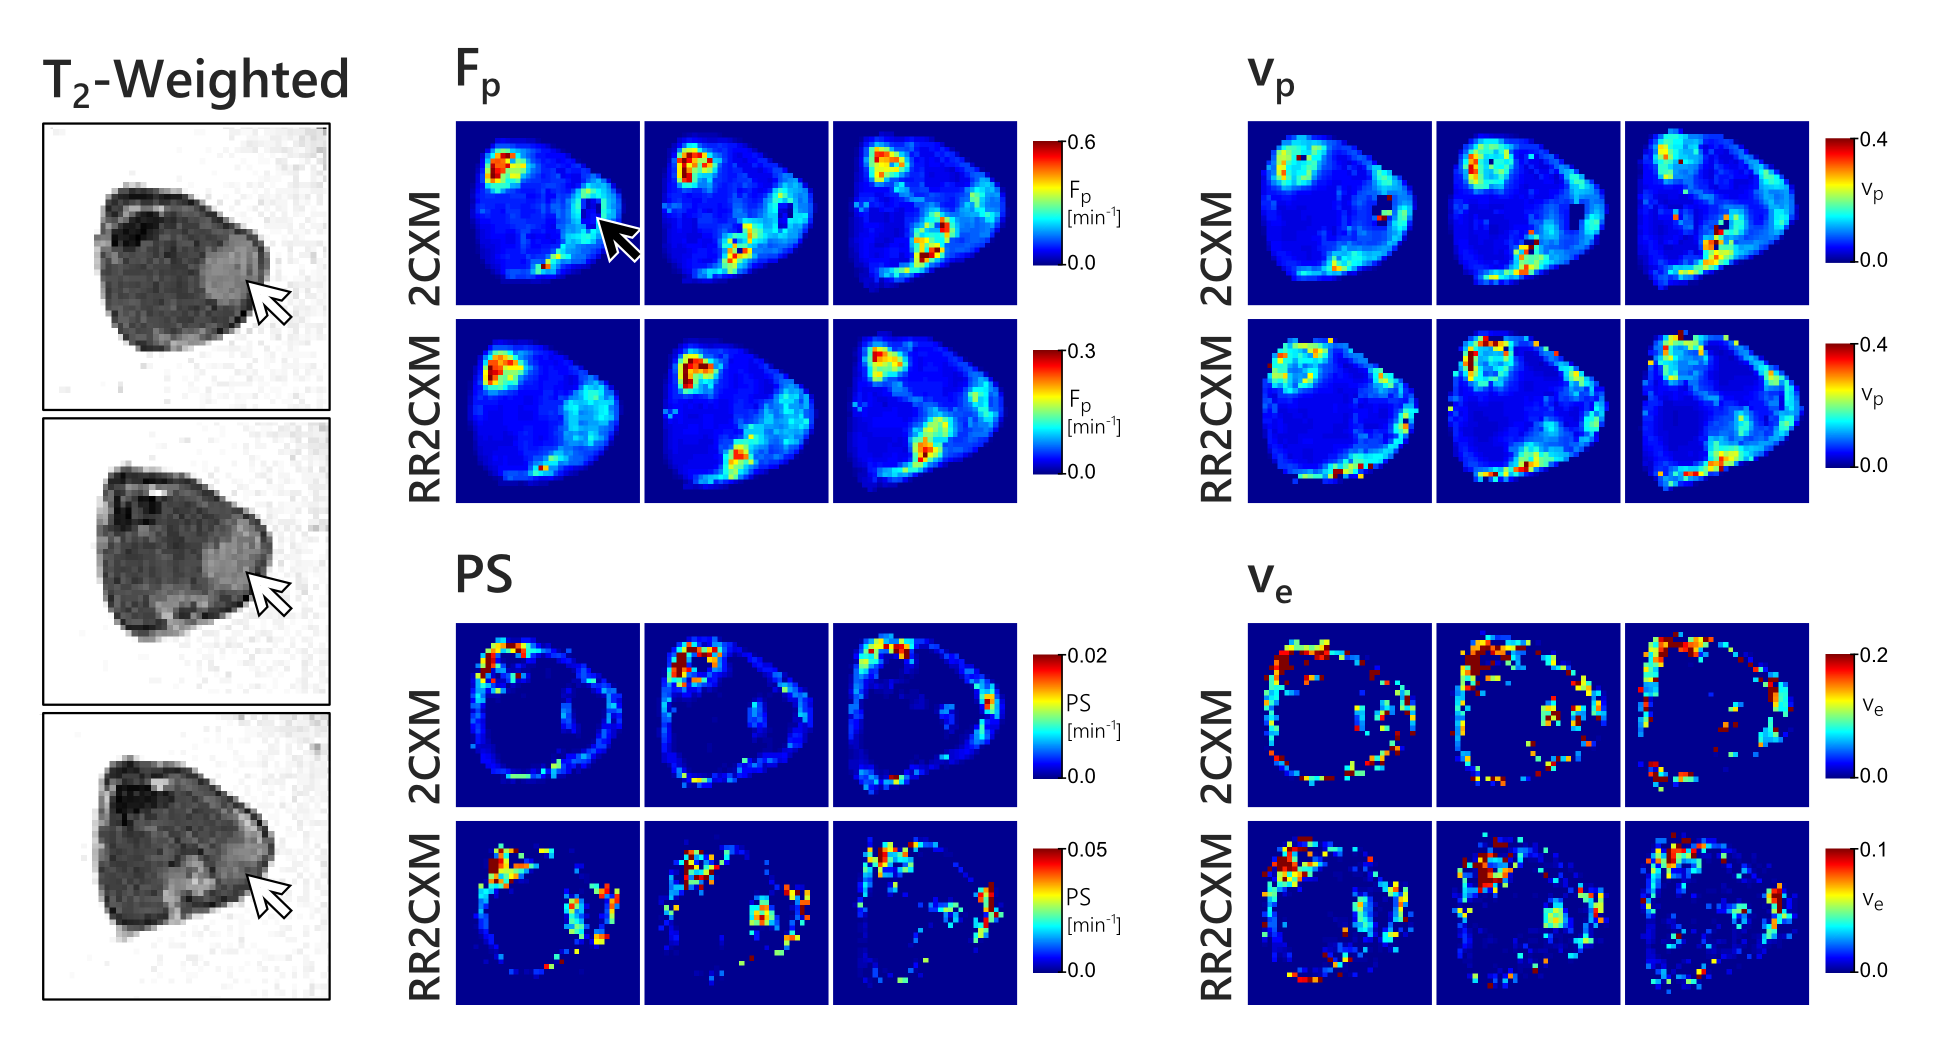
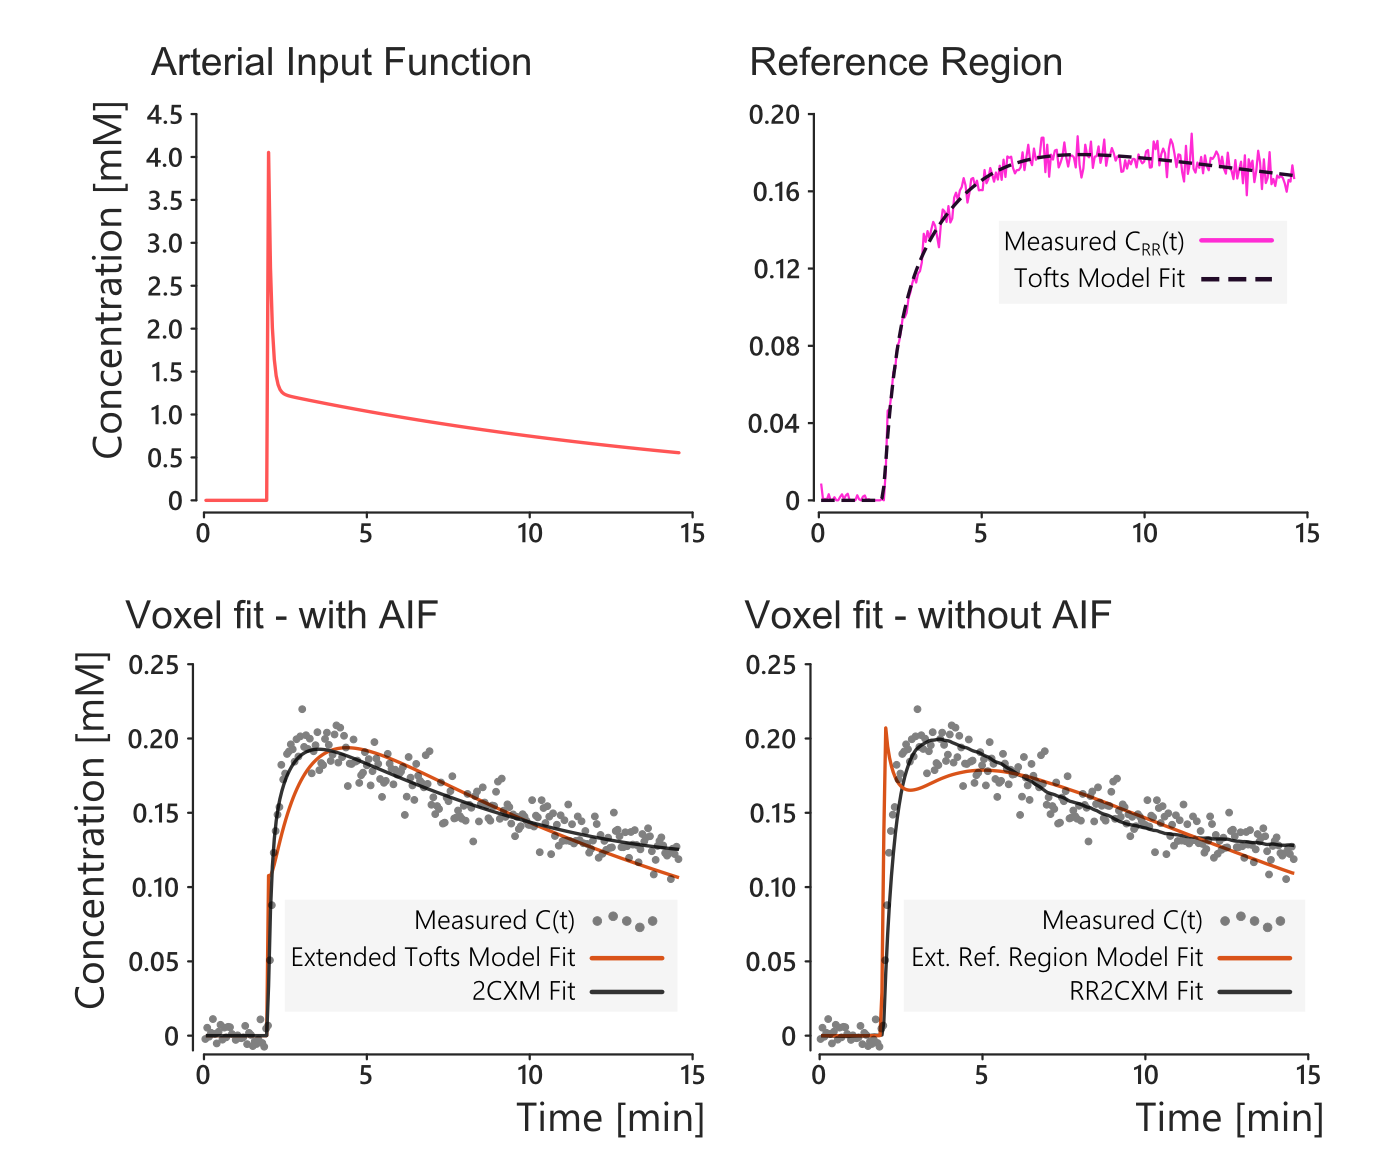
In-vivo, the RR2CXM provided maps that were qualitatively similar to the 2CXM (Figure 3). The colour scales differ because the 2CXM assumes a model-based AIF while the RR2CXM only assumes that the AIF is shared between the reference region and the tissue of interest. The AIF and reference tissue curve are shown in Figure 4, along with an example fit on one of the voxels. These fits show that the extended Tofts model and extended reference region model8 do not accurately fit the data, while the 2CXM and RR2CXM provide better fits.
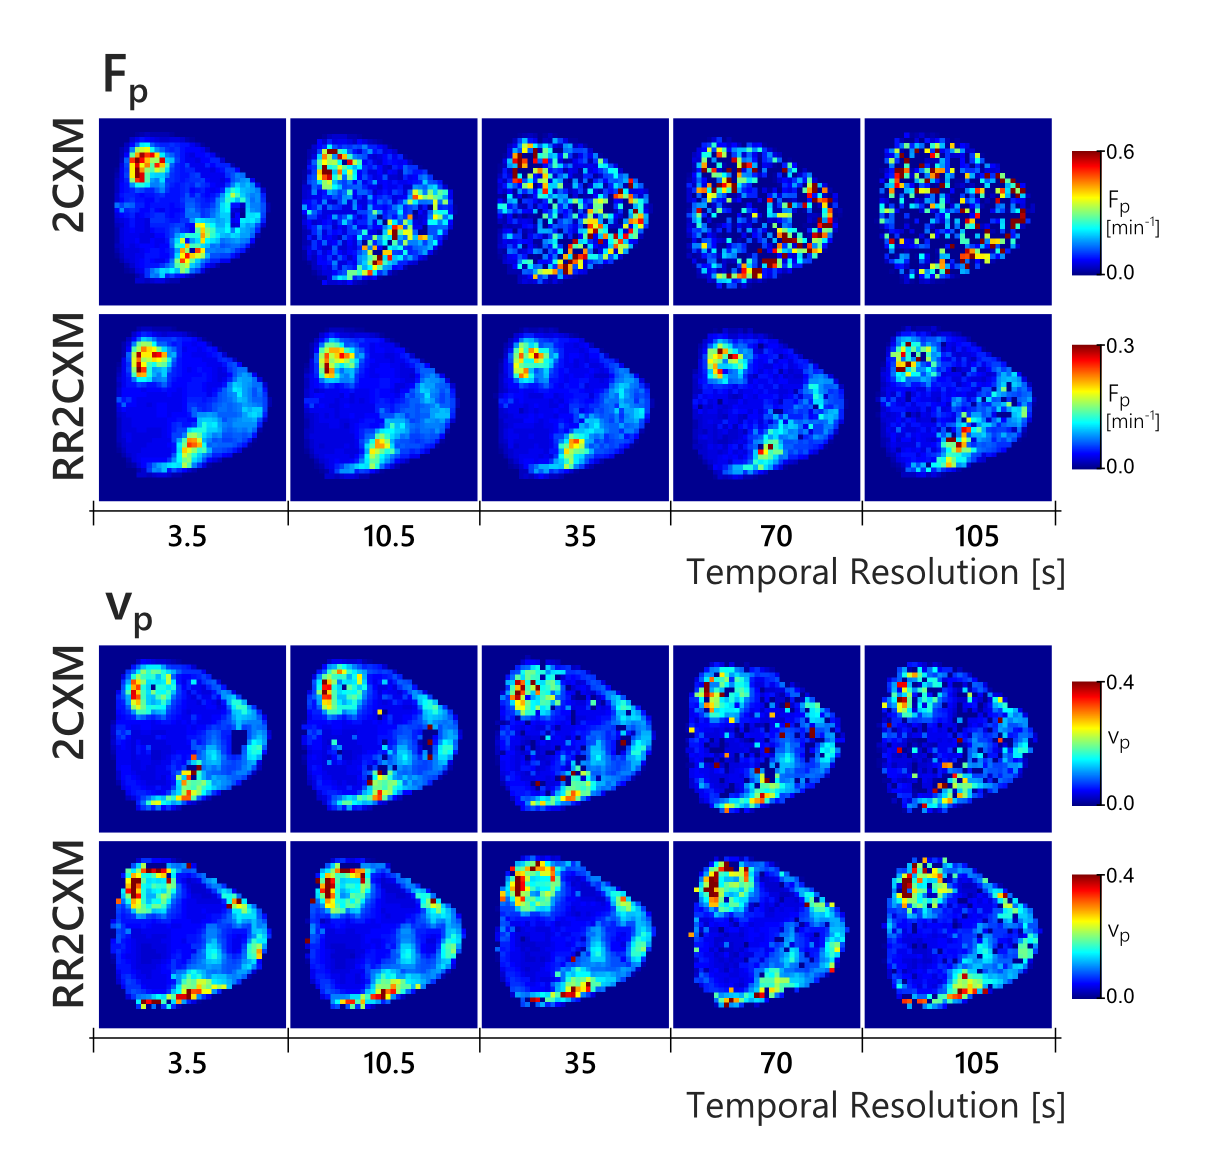
Figure 5 shows maps obtained after temporally downsampling of the in-vivo data by discarding frames. The RR2CXM was robust with slow temporal sampling, notably the $$$F_p$$$ map which remained stable down to 35 s. The 2CXM maps was noisy beyond 10 second sampling. $$$PS$$$ and $$$v_e$$$ maps were already noisy even at the fastest temporal sampling and are not shown.
Conclusion
A reference-region based version of the 2CXM, or RR2CXM, was proposed and evaluated in simulation and in-vivo. The proposed model has comparable performance to the 2CXM with temporal sampling faster than 10 s, is robust to slower temporal sampling, and does not require an arterial input function.Acknowledgements
Funding for this work was provided by the RI-MUHC (Montreal General Hospital Foundation), a NSERC Discovery Grant, and the NSERC CREATE Medical Physics Regional Training Network (Grant no. 432290).References
1. Sourbron & Buckley. MRM 2011; 66(3), 735–745. http://doi.org/10.1002/mrm.22861
2. Yankeelov et al. MRI 2005; 23:519–29. doi: 10.1016/j.mri.2005.02.013.
3. Flouri, Lesnic & Sourbron. MRM 2016; 76:998–1006. doi: 10.1002/mrm.25991.
4. Garpebring & Löfstedt. MRM 2017; 00:1–7. doi: 10.1002/mrm.26677.
5. Schreurs et al. PLoS ONE 2016; 11:1–16. doi: 10.1371/journal.pone.0165759.
6. Jacobs et al. NMR in Biomedicine 2015; 28:1443–1454. doi: 10.1002/nbm.3406.
7. Ahmed & Levesque, Proc. Intl. Soc. Mag. Reson. Med. 25 (2017), 1907
8. Ahmed & Levesque, Proc. Intl. Soc. Mag. Reson. Med. 25 (2017), 1906
Figures