5509
Quantifying the Effect of Lipids’ Composition on Water Proton Relaxation1Edmond and Lily Safra Center for Brain Sciences, The Hebrew University,Edmond J. Safra Campus at Givat Ram, Jerusalem, Israel
Synopsis
It’s a major challenge to localize and quantify molecular content in the human brain for in-vivo MRI clinical use. Here, we formulated liposomes to model the environment of abundant lipids in the brain. To investigate the influence of those lipids on relaxation we estimated multiple quantitative MRI (qMRI) parameters. Moreover, we assess the relationship between the lipids’ qMRI parameters and the water fraction (WF). Our findings show that joining multiple qMRI parameters with the WF introduces a novel possibility to separate between different lipids' mixtures. Extending this approach can potentially be used to identify molecular signatures of human tissue in-vivo.
Introduction
The human brain is comprised mainly of 70-80% water, 10-11% proteins and 5-15% lipids. The distribution of these and other molecules, changes both between different brain regions and across age, as well as in various pathological states1–4. Currently, it remains a major challenge to localize and quantify these molecules in vivo, using noninvasive methods. It has been shown that quantitative MRI (qMRI) relaxation parameters are sensitive to specific brain tissue such as myelin5,6. Furthermore, previous NMR studies indicate that relaxation constants are influenced by the molecular environment and can reflect lipid content7. However, most current studies of water relaxation in the human brain neglect the quantification of molecular composition contributions to the MRI signal.
In this work we focused on the most common lipids that are found in human brain cell membranes, and provided a novel approach to quantifying lipids' composition. First, we tested how qMRI parameters reflect the underlying molecular composition. Second, we assess the relationship between the qMRI parameters and the water fraction (WF).
Methods
We
manufactured phantoms containing the most abundant lipids in the human brain: Phosphatidylcholine(PC),
Phosphatidylethanolamine(PE), Phosphatidylserine(PS),
Phosphatidylinositol(PI), Sphingomyelin(Spg) and Cholesterol8–13.
Using the thin layer evaporation-hydration technique14,15
we prepared liposomes in order to model cellular lipids' membranes.
Cuvettes with liposomes samples were placed in a polystyrene
container filled with Agarose+Gd (Gadopentetic) solution (Figure 1).
To investigate the influence
of those liposomes on relaxation, we scanned the container in a 3T
field, and estimated the following qMRI parameters: PD &
T116–18,T219 ,T2*,MT20 and qMT21.
For simplicity we defined MTnorm=MTon/MToff,
(offset=700 Hz; flip-angle=220°, where the direct effect
is minimal). Similar results were obtained for both MT and qMT
approaches.
Results
In this work, we introduced a new protocol to evaluate the effect of biologically relevant lipids on qMRI measurements.
First, we tested the accuracy and reliability of our system. We validated the accuracy of PD in estimating WF (Figure 2), and found an excellent agreement. Furthermore, we tested the protocol’s reliability using multiple scans (from different days) of the same liposome samples, and found a remarkable consistency for T1, T2, MTnorm and PD estimations (Figure 3).
Second, we tested the dependency of qMRI parameters on WF.
For each lipid, we found a linear relationship between each qMRI parameter and the WF. Moreover, we showed that the coefficients of the linear models differ between lipid types. For example, the MTnorm linear dependency on WF can clearly separate between PS and PC but less so for R1 (1/T1) dependency (Figure 4a-b).
We used a bootstrap approach in order to fit a representative linear slope and intercept between the WF and the qMRI parameters across our multiple experimental replications. A summary of the comparison between lipids and across qMRI parameters is shown in Figure 4c.
We find that when accounting for WF, we can identify the different contributions of each lipid to each qMRI parameter, and characterize a lipid’s qMRI signature.
Last, we asked if the observed linear relationships of pure lipids could predict the result of a mixture of lipids. Is a mixture a linear sum of its components’? Figure 5 shows an example comparison between a mixture of lipids and its components. In some cases, we found that the relaxation does appear to be a sum of its components lipids. In other cases, we identified lipids that dominate the relaxation estimations, causing the qMRI parameters to appear similar for both a pure lipid and for a mixture of lipids.
Discussion
We successfully created a biologically relevant liposome phantom system that enabled us to control its content. This experimental protocol allowed us to accurately measure the lipids’ effect on the qMRI parameters.
We show that a linear relationship exists between qMRI parameters and the WF of lipids, within a biologically relevant range. The coefficients of each linear model differ between lipid types. Furthermore, we identified cases where a mixture of lipids can be separated to its components lipids. Nevertheless, further biophysical models are needed to better characterize mixture summation.
We propose that our analysis approach may serve also to identify and to separate between molecular compounds in vivo. Additional experiments are required to address other biological sources that can influence qMRI parameters, such as proteins and sugar groups.
Conclusions
We show that joining multiple qMRI parameters with comparison to the WF introduces a novel possibility to measure the molecular signatures of different mixtures of lipids. We propose that this approach can be extended to assess the molecular signatures of human tissue in vivo.Acknowledgements
References
1. Bozek, K. et al. Organization and Evolution of Brain Lipidome Revealed by Large-Scale Analysis of Human, Chimpanzee, Macaque, and Mouse Tissues. Neuron 85, 695–702 (2015).
2. Markesbery, W. R., Ehmann, W. D., Alauddin, M. & Hossain, T. I. M. Brain trace element concentrations in aging. Neurobiol. Aging 5, 19–28 (1984).
3. Svennerholm, L., Boström, K., Jungbjer, B. & Olsson, L. Membrane lipids of adult human brain: lipid composition of frontal and temporal lobe in subjects of age 20 to 100 years. J. Neurochem. 63, 1802–1811 (1994).
4. Chan, R. B. et al. Comparative lipidomic analysis of mouse and human brain with Alzheimer disease. J. Biol. Chem. 287, 2678–2688 (2012).
5. Rooney, W. D. et al. Magnetic field and tissue dependencies of human brain longitudinal1H2O relaxation in vivo. Magn. Reson. Med. 57, 308–318 (2007).
6. Stüber, C. et al. Myelin and iron concentration in the human brain: A quantitative study of MRI contrast. Neuroimage 93, 95–106 (2014).
7. Henkelman, R. M. & Macdonald, M. Relaxivity at MR Imaging : ofCerebrosides and pH ’. Radiology 521–529 (1994).
8. Veloso, A. et al. Distribution of lipids in human brain. Anal. Bioanal. Chem. 401, 89–101 (2011).
9. Krafft, C., Neudert, L., Simat, T. & Salzer, R. Near infrared Raman spectra of human brain lipids. Spectrochim. Acta - Part A Mol. Biomol. Spectrosc. 61, 1529–1535 (2005).
10. Abbott, S. K. et al. An improved high-throughput lipid extraction method for the analysis of human brain lipids. Lipids 48, 307–318 (2013).
11. Myelin, B., Norton, T. & Autilio, A. THE LIPID COMPOSITION OF PURIFIED BOVINE EFtz. 13, (1966).
12. CUZNER, M. L., DAVISON, A. N. & GREGSON, N. A. the Chemical Composition of Vertebrate Myelin and Microsomes. J. Neurochem.12, 469–481 (1965).
13. Brien, J. S. O. & Sampson, E. L. Lipid composition of the normal human brain : 6, (1965).
14. Monteiro, N., Martins, A., Reis, R. L. & Neves, N. M. Liposomes in tissue engineering and regenerative medicine. J. R. Soc. Interface 11, 20140459–20140459 (2014).
15. Akbarzadeh, A. et al. Review Article LIPOSOME : METHODS OF PREPARATION AND APPLICATIONS. Liposome Technol. 6, 102 (2013).
16. Mezer, A. et al. Quantifying the local tissue volume and composition in individual brains with magnetic resonance imaging. Nat. Med. 19, 1667–72 (2013).
17. Chang, L.-C., Koay, C. G., Basser, P. J. & Pierpaoli, C. A Linear Least Squares Method for Unbiased Estimation of T1 from SPGR Signals. doi:10.1002/mrm.21669
18. Barral, J. K. et al. A robust methodology for in vivo T1 mapping. Magn. Reson. Med. 64, 1057–1067 (2010).
19. Ben-Eliezer, N., Sodickson, D. K. & Block, K. T. Rapid and accurate T2 mapping from multi-spin-echo data using bloch-simulation-based reconstruction. Magn. Reson. Med. 73, 809–817 (2015).20. Henkelman, R. M. et al. Quantitative interpretation of magnetization transfer. Magn Reson Med 29, 759–766 (1993).
21. Cabana, J.-F. et al. Quantitative magnetization transfer imaging made easy with q MTL ab : Software for data simulation, analysis, and visualization. Concepts Magn. Reson. Part A 44A, 263–277 (2015).
Figures
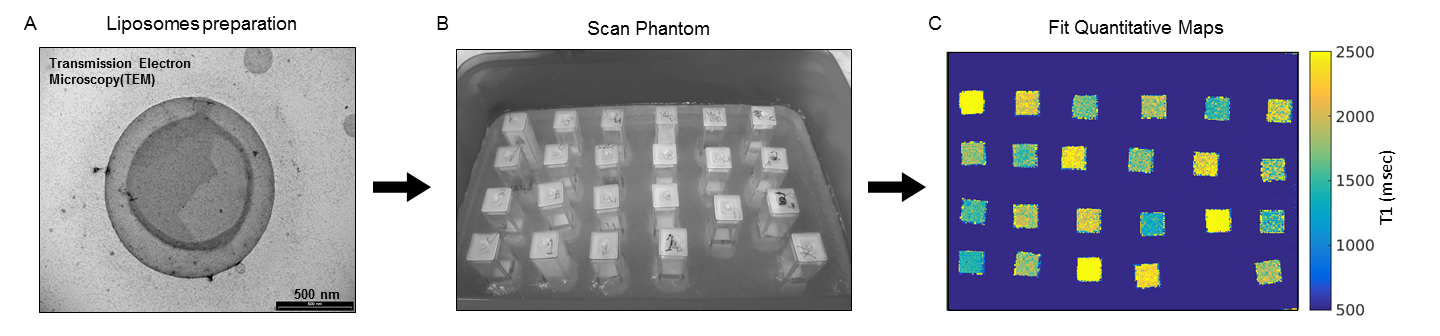
Establishing A Phantom System
A diagram showing the general pipeline of our protocol.
(A) An example for a liposome we created via evaporation-hydration technique. Liposome is imaged by transmission electron microscopy.
(B) A phantom box filled with solid agar (mixed with Gd) surrounding the liposome samples inside the cuvettes. The samples differ in their lipid type and in their WF.
(C) An example T1 map (msec) for a selected slice of the phantom. A clear contrast between the lipid samples and the smooth agar area is seen.
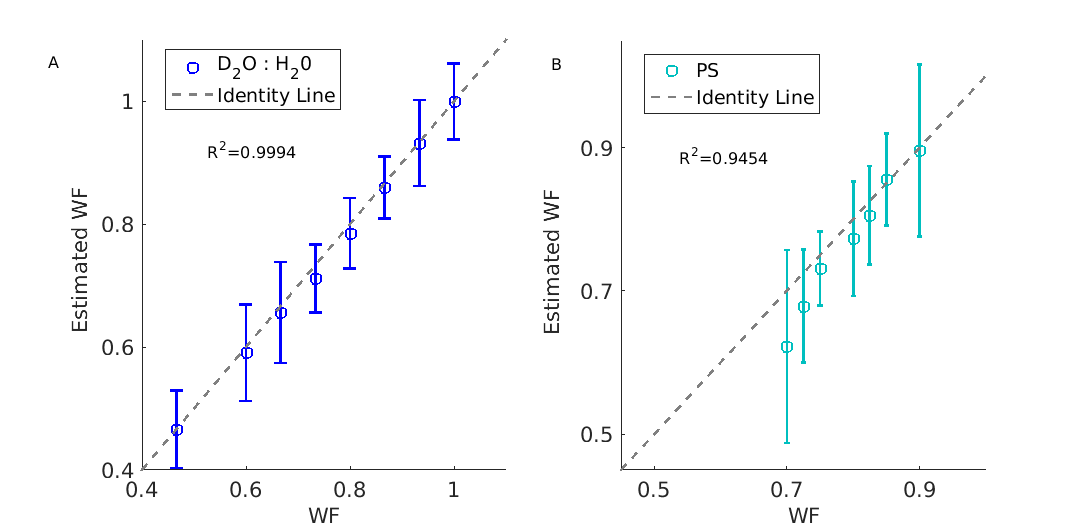
Accurate water content estimation.
(A) The proton density (PD)-based MRI estimation of water fraction (Estimated WF ,y-axis) agrees well with the true water fraction (WF,x-axis). Each point represents the mean and STD of a different sample. Each sample comprises of H2O (H-MRI visible) and D2O (H-MRI invisible) in varying volume ratios.
(B) WF estimations of a phophtydelserine (PS) liposome in different volume fractions .The calculated WF (x-axis) was determined using the theoretical volume of PS molecule taken from literature, agrees well with MR-estimated WF (y-axis).The theoretical estimation does not account for water loss in the manufacturing process .
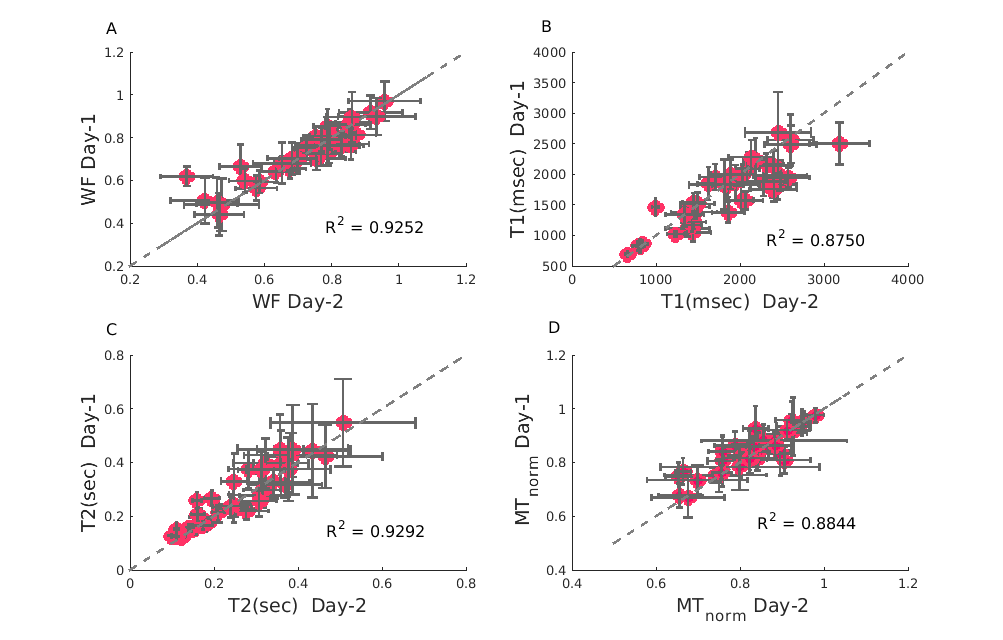
Reliability of relaxation constants across days for lipids samples
(A:D) Relaxation constants were fitted for two scans of the same lipid sample in different days. Panels A:D represent: Water Fraction (WF), T1, T2 and MTnorm accordingly. MTnorm is the MT offset at 700 Hz, flip angle of 220 degrees (where the direct effect is minimized) normalized by the same scan without MT. High reliability is observed for all quantitative values estimated across different days.
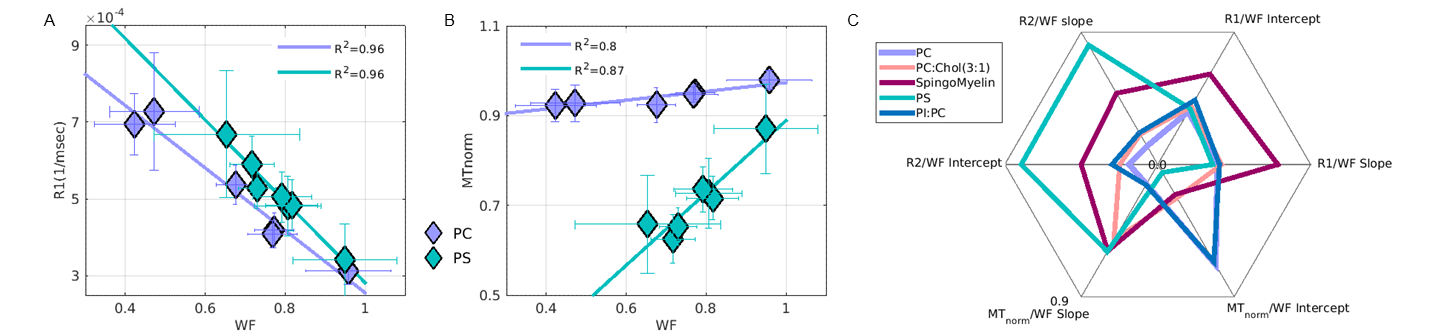
The relaxation dependency on water fraction differs across lipids.
(A) R1 vs. WF and (B) MTnorm vs WF, for an example comparison between two phospholipids (PC and PS). Each point represents a cuvette with different lipid volume fraction. A linear model (solid line) is fit to show the relaxation dependency for each lipid on WF.
(C) Different phospholipids have different linear model coefficients (slopes and Intercepts). A spider plot shows the WF dependency of three qMRI parameters (R1, R2 and MTnorm) for five different lipids. Values are normalized such that their Euclidean norm will equal 1.
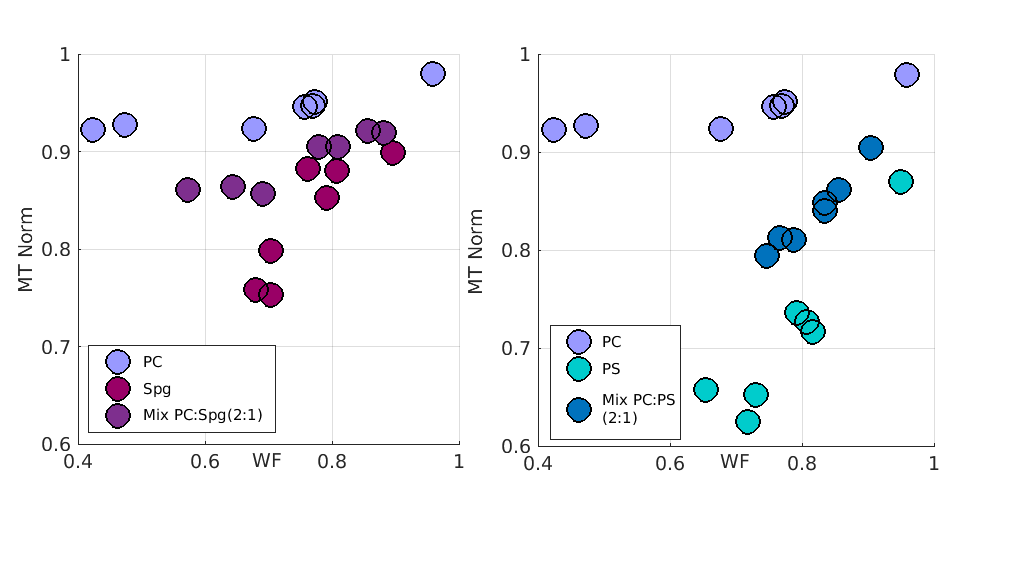
The contribution of lipid mixtures to relaxation.
The MT relaxation dependency of pure PC on WF is different than those of pure PS and pure Spg. Mixtures of PC with either Spg or PS yield different results. While the MT effect of the PC:Spg mixture seems to be contributed from the two pure lipids, the MT effect of the PC:PS mixture is much more similar to the pure PS. This suggests that in some cases, the effect of lipids' mixtures is the sum of its components. STD are not shown for clarity, but are similar in size to the those shown in Figure 4.