5508
Evaluating the use of Oxygen-Enhanced MRI with ICA to assess the tumour oxygenation status in murine tumour models1Physics & Astronomy, University of British Columbia, Vancouver, BC, Canada, 2Department of Integrative Oncology, BC Cancer Research Centre, Vancouver, BC, Canada, 3UBC 7T MRI Research Centre, University of British Columbia, Vancouver, BC, Canada
Synopsis
Want to assess the oxygenation status of tumours using non-invasive, contrast-agent free MRI? In this work we explore how OE-MRI can be used to extract and amplify signal from oxygen gas challenges in mouse tumours. With only dynamic T1-weighted images we can create rich oxygenation status maps that show high correlation with pimonidazole staining.
Introduction
Aberrant angiogenesis, poor blood perfusion, a chaotic vascular network all limit oxygen delivery to cells and contribute to formation of hypoxic regions in tumours. Tumour hypoxia has been widely regarded as the prognostic biomarker of tumour aggressiveness and malignant phenotype[1,2]. In particular, hypoxia induces adaptive and genetic changes that allow tumour cells to survive and proliferate after both chemo and radiotherapy, ultimately leading to treatment resistance and failure. Oxygen-enhanced magnetic resonance imaging (OE-MRI) is one of the imaging techniques that potentially facilitate a fast, valid, non-invasive, widely available and repeatable assessment of tumour hypoxia, which also avoids the use of exogenous contrast agents [3]. We have recently developed an OE-MRI technique to extract very small T1-weighted signal changes in the presence of much larger confounding factors after administering a gas challenge[4]. The technique utilizes the intrinsic paramagnetic property of molecular oxygen (O2) and is sensitive to changes of dissolved O2-gas concentration in blood plasma and interstitial fluid. During O2 challenge, additional oxygen (O2) predominantly dissolves in blood plasma and tissue fluid since further saturation of deoxyhaemoglobin does not occur in areas with near 100% saturation. In this work, we demonstrate our efforts to apply this OE-MRI technique in two animal models with different tumour microenvironments. Oxygenation status parameter maps are compared with histological sections of the same tumours stained with hypoxia marker pimonidazole.
Methods
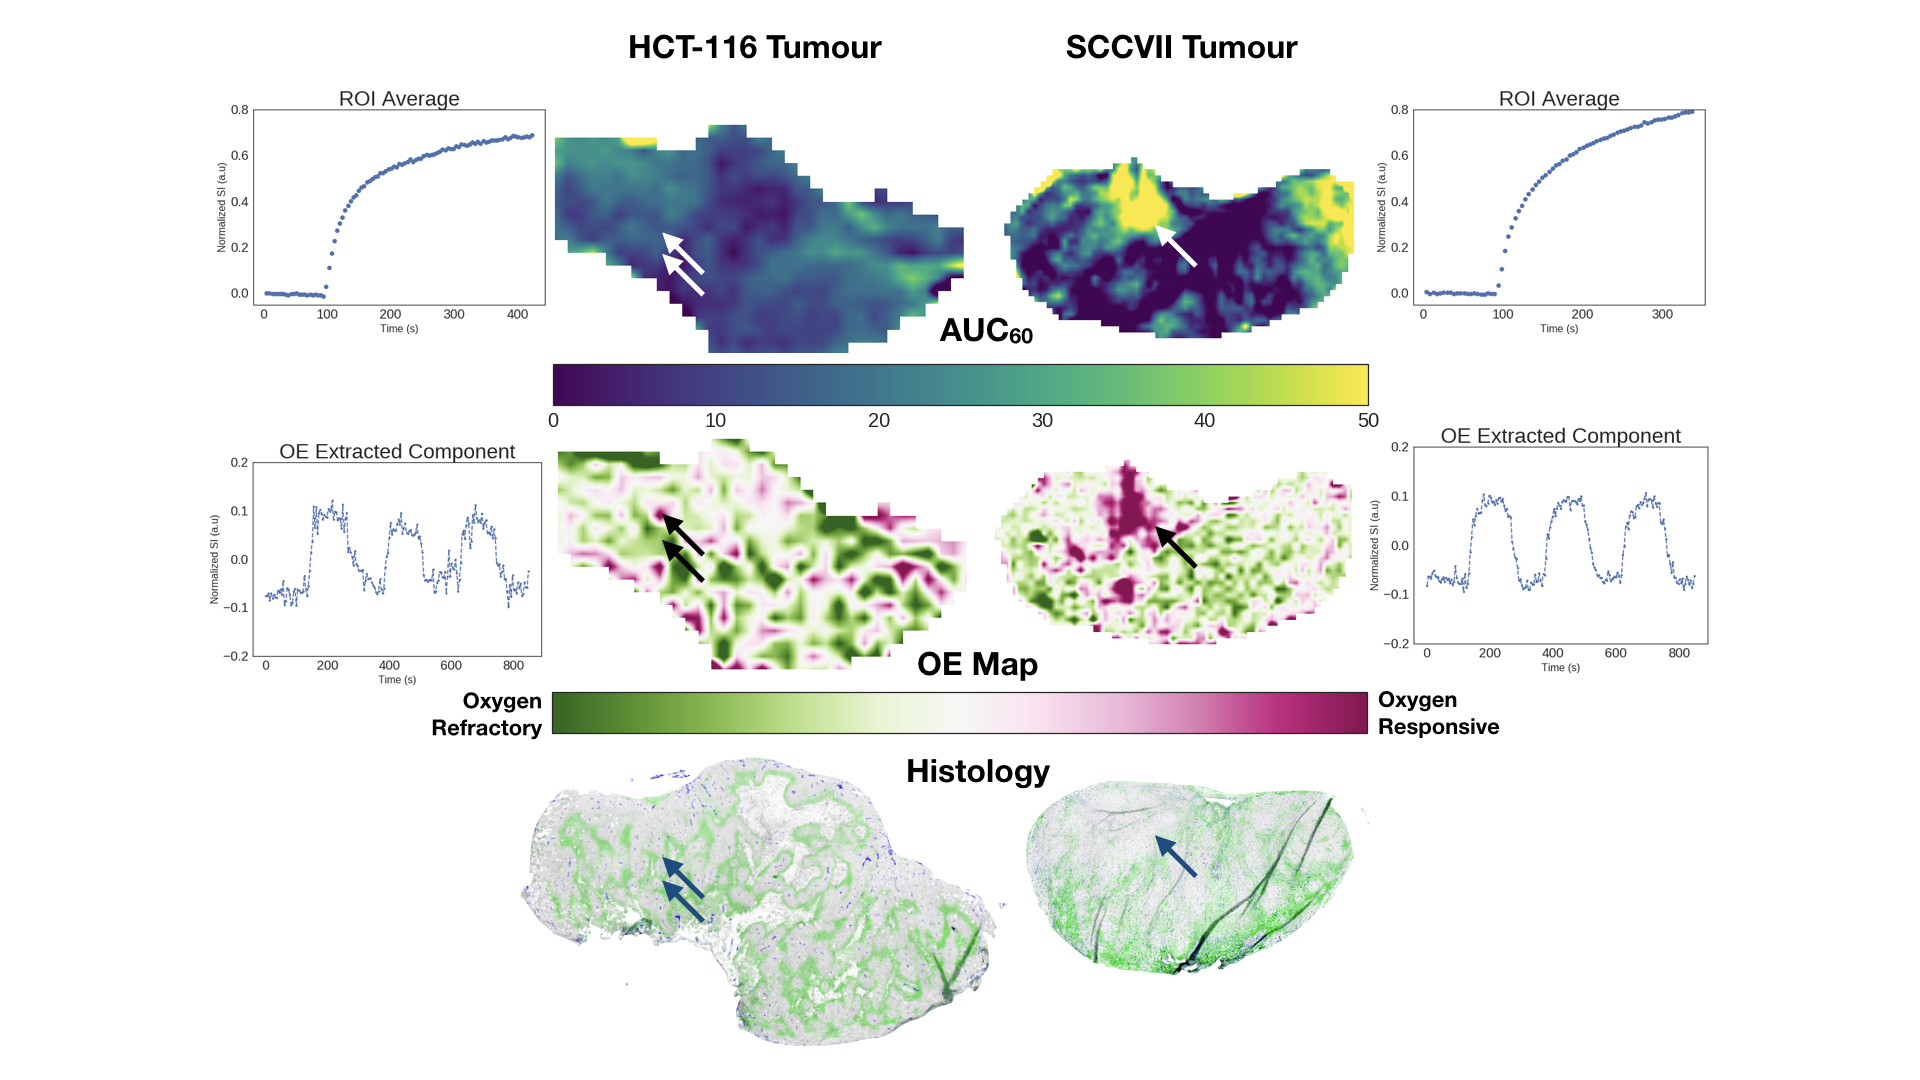
Animals & Histology: Twelve NRG mice were implanted with two tumour cell lines in the dorsal subcutaneous region and tumours were allowed to grow until they reached at least 500mm3. Six mice were implanted with a murine squamous cell carcinoma (SCCVII) and six were implanted with a human colorectal carcinoma (HCT-116). Upon completion of imaging, tumours were excised and frozen to be processed for histology. Carbocyanine dye and pimonidazole was injected i.v. prior to sacrifice to stain for perfusion and hypoxia. Sections were also stained for CD31 (vessels) and H&E stains (nuclei).
MRI: Imaging was performed using a 7T scanner (Bruker Biospec 70/30 USR, Germany) with a transmit quadrature volume coil and a custom built surface receive coil. Following standard pilot scans and field map-based shimming, a T1 map was acquired using the Look-Locker method. OE-MRI scans were acquired with 250 repetitions using a 2D FLASH based sequence with TE/TR = 2.67/66.7, flip angle α = 40, 8 slices each 1mm thick, FOV of 3.84 cm x 1.92 cm, encoding matrix of 128 x 64, and a temporal resolution of 4.3s with 200 repetitions for a total scan time of about 14 minutes. Oxygen Challenge: Mice were anaesthetized using 1.5 – 2.0 % isofluorane delivered via medical air (78% Nitrogen, 21% oxygen). Breathing gas was alternated between medical air and 100% oxygen every 2 minutes for a total of 3 cycles during the OE-MRI scan. For a subset of mice, an extra gadolinium contrast agent scan was conducted to assess the perfusion characteristics. An area-under-the-curve for 60s (AUC60) was calculated.
Analysis: ROIs were drawn around the tumour region using a RARE image prior to ICA. The deflation-based FastICA provided by the python package scikit (sklearn v0.17.1) was used to analyze the data; no additional pre-processing was employed. All extracted components were tested for correlation with the O2-challenge paradigm (a square wave switching between O2 and medical air every 2 minutes). In all cases, only one component correlated with the O2-challenge paradigm.
Results & Discussion
The extraction of components by the FastICA algorithm was robust and largely independent of the chosen numbers of components. Even though ICA does not provide a unique ordering of components, the component corresponding to the oxygen challenge could be straightforwardly identified by its rectangular shape.
The figure illustrates the tumour microenvironments in HCT116 vs SCCVII tumours. HCT116 exhibits a mottled pattern of pimonidazole with a close proximity of hypoxic and viable tumour areas. Correspondingly, the OE map show closely intermingled areas that are oxygen responsive and refractory. The two adjacent arrows in the figure point to such closely adjacent areas of hypoxia and normoxia.Conversely, our SCCVII tumours showed areas of intense oxygen response that correspond to well perfused areas that are simultaneously free of pimonidazole.
Areas of intense pimonidazole correspond to regions of oxygen refraction in the OE-map. Unsurprisingly, the areas of high contrast uptake on the AUC correspond to oxygen responsive regions for SCCVII tumours.While the different hypoxia patterns in these two tumour lines are well depicted on the OE-map, the AUC maps from the contrast-enhanced scan does not allow an easy distinction of these tumours.
Conclusion
Oxygen-enhanced MRI with ICA allows the characterization of tumour tissue oxygen status. OEMRI reflects observed features of pimonidazole staining for hypoxia better than area-under-the-curve from contrast-enhanced MRI.Acknowledgements
NSERC DiscoveryReferences
[1] Harris, A. L. et al. (2002). Nature Reviews Cancer, 2(1), 38–47. http://doi.org/10.1038/nrc704
[2] Tatum, J. L. et al. (2006). International Journal of Radiation Biology, 82(10), 699–757. http://doi.org/10.1080/09553000601002324
[3] O'Connor, J. P. B. et al. (2009). International Journal of Radiation Oncology, Biology, Physics, 75(4), 1209–1215. http://doi.org/10.1016/j.ijrobp.2008.12.040
[4] Moosvi, F.M et al (2017). In Proceedings of International Society for Magnetic Resonance in Medicine (#4501), Hawaii, USA.
Figures