5507
Imaging white matter damage after traumatic brain injury: a high-field multimodal approach in a rat model1Department of Medicine, Imperial College London, London, United Kingdom, 2Biological Imaging Centre, Imperial College London, London, United Kingdom, 3Department of Bioengineering, Imperial College London, London, United Kingdom, 4Dyson School of Design Engineering, Imperial College London, London, United Kingdom
Synopsis
The aim of this work was to study white matter microstructural and molecular changes in a rat model of TBI using CEST and multi-shell diffusion NODDI techniques. Our results suggest that the FA decrease after injury is mainly caused by an increase in fiber dispersion in the white matter, as seen with OD NODDI. MT decrease in the CC suggests an insult to the lipids in the myelin sheath and the NOE signal displays contributions from haemorrhage in the injury time point. Histology work will allow for a more accurate interpretation of the imaging results.
Introduction
Traumatic brain injury (TBI) is the leading cause of death and disability for people under 45 years old. TBI is a heterogeneous disorder and it commonly involves white matter damage resulting from various pathophysiological mechanisms, such as diffuse axonal injury and inflammation. Animal models such as the control cortical impact (CCI) model1 can help with our understanding of white matter damage after TBI.
Neurite orientation dispersion and density imaging (NODDI2) is a novel diffusion MRI technique. NODDI has increased specificity over traditional fractional anisotropy (FA) DTI to evaluate the microstructure of white matter, including neurite density and neurite orientation dispersion. Magnetization transfer (MT) and nuclear overhauser enhancement (NOE, -3.5ppm), observed in the chemical exchange saturation transfer (CEST) spectrum, have been linked to lipids3 and myelination4 and can potentially provide molecular information about white matter.
Aim
To study white matter microstructural and molecular changes in a rat model of TBI with CEST and multi-shell diffusion NODDI techniques.Methods
Animals and preparation N=9 male Sprague Dawley rats (~9 weeks of age, ~270g) were anaesthetized, craniotomy performed and injury was induced with a flat rigid impactor (2mm depth, 4m/s speed, 100ms dwell time).
Imaging MRI
was acquired at two time points, pre and 14 days post-surgery, in a 9.4T Bruker
BioSpec scanner, equipped with a 4-channel phase array receiver coil. Single slice CEST: 3s hard
pulse (1μT)
applied at 55 offsets between ±5ppm
was followed by a RARE readout with centric encoding (TR/TE = 4s/6 ms, RARE
factor 23, 0.172x0.344x1mm resolution, acquisition time 7:28min).
For multi-shell diffusion (11min acquisition time), 2 b-values (2000, 1000 s/mm2)
were acquired with 40 directions each, plus 4b0, using an EPI readout (TE/TR/slices/resolution = 21
ms/4 s/34/0.25x0.25x0.65mm). Susceptibility weighted imaging (SWI) was also acquired with the following parameters:
TE=15ms, TR=650ms, 3 averages, 50° FA, 0.09x0.09x0.4mm
resolution, 20 slices
.
Immunostaining Brains were collected for histology after the final MRI. Ongoing histology includes Luxol Fast Blue (LFB), degenerating myelin basic protein.
Analysis CEST: Z-spectra were fitted by a multi-Lorentzian fit, and spillover and MT corrected inverse difference MTRRex maps were calculated for NOE and MT pools using customised freely available Matlab scripts5. B0 and B1 corrections were performed using WASABI6. Eight different ROIs were drawn (see figure 4). Multi-shell diffusion: FA and NODDI maps (ND, OD, water) were derived using FSL dtifit and AMICO7, and four ROIs were drawn (see figure 1). Results are presented as average ROI values ± standard error of the mean. Student's t-test was used to compare injury side versus contralateral for both CEST and diffusion. FA signal was correlated against NODDI metrics for the individual regions, and MT was correlated to NOE.
Results
Figure 1 shows a decrease in FA after injury in the ipsilateral corpus callosum and posterior white matter ROIs, accompanied by an increase in OD in the same regions. FA and OD are correlated in the contralateral side (R2=0.64) and in the injury side (R2=0.40).
Figure 2 shows a decrease in MT after the injury in the ipsilateral cortex and corpus callosum, while the NOE signal decreased in the cortex and increased in the thalamus relative to baseline. MT and NOE are mildly correlated in the posterior WM region (R2=0.21).
Discussion
Our results suggest that the FA decrease after injury is mainly caused by an increase in fiber dispersion in the white matter, as seen with OD NODDI. ND was not significantly different with these numbers, but the MT decrease in the CC suggests an insult to the lipids in the myelin sheath.
Previous work has shown that MT and NOE are tightly coupled in the human brain8, however in this rat study they were only mildly correlated in the posterior WM. The smaller NOE signal observed in the CC might be not sensitive enough to detect the lower concentration of lipids suggested by the local MT decrease. The increased NOE signal in the thalamus may indicate increased metabolic turnover in the area, but blood contributions to the signal may also be a factor. Compared to MT, NOE incorporates higher contributions from the cortical haemorrhage present in a few animals (see figure 3).
Conclusion
Our initial results demonstrate that distinct pathophysiological changes associated with CCI can be measured at high-field, with NODDI providing microstructural detail and CEST molecular information. Ongoing histology work will allow for a more accurate interpretation of the imaging results.Acknowledgements
No acknowledgement found.References
1. Dixon CE, Clifton GL, Lighthall JW et al. A controlled cortical impact model of traumatic brain injury in the rat. J Neurosci Methods. 1991;39(3):253‐62.
2. Zhang H, Schneider T, Wheeler-Kingshott CA et al. NODDI: practical in vivo neurite orientation dispersion and density imaging of the human brain. Neuroimage. 2012;61(4):1000‐16.
3. Goerke S, Zaiss M, Longo D et al. CEST signals of lipids. In Proceedings of the ISMRM. 2017;201.
4. Schmierer K, Scaravilli F, Altmann DR et al. Magnetization transfer ratio and myelin in post-mortem multiple sclerosis brain. Annals of Neurology. 2004;56(3):407‐415.
5. Zaiss M. http://www.cest-sources.org/doku.php.
6. Schuenke P, Windschuh J, Roeloffs V et al. Simultaneous mapping of water shift and B1 (WASABI)- Application to field-inhomogeneity correction of CEST MRI data. Magn Reson Med. 2017;77(2):571‐580.
7. Daducci A, Canales-Rodriguez E, Zhang H et al. Accelerated microstructure imaging via convex optimization (AMICO) from diffusion MRI data. Neuroimage. 2005;105(15):32‐44.
8. Geades N, Mougin OE, Shah S et al. Are MT and NOE (at -3.5ppm) in z-spectroscopy coupled in the brain? In Proceedings of the ISMRM. 2017;3748.
Figures
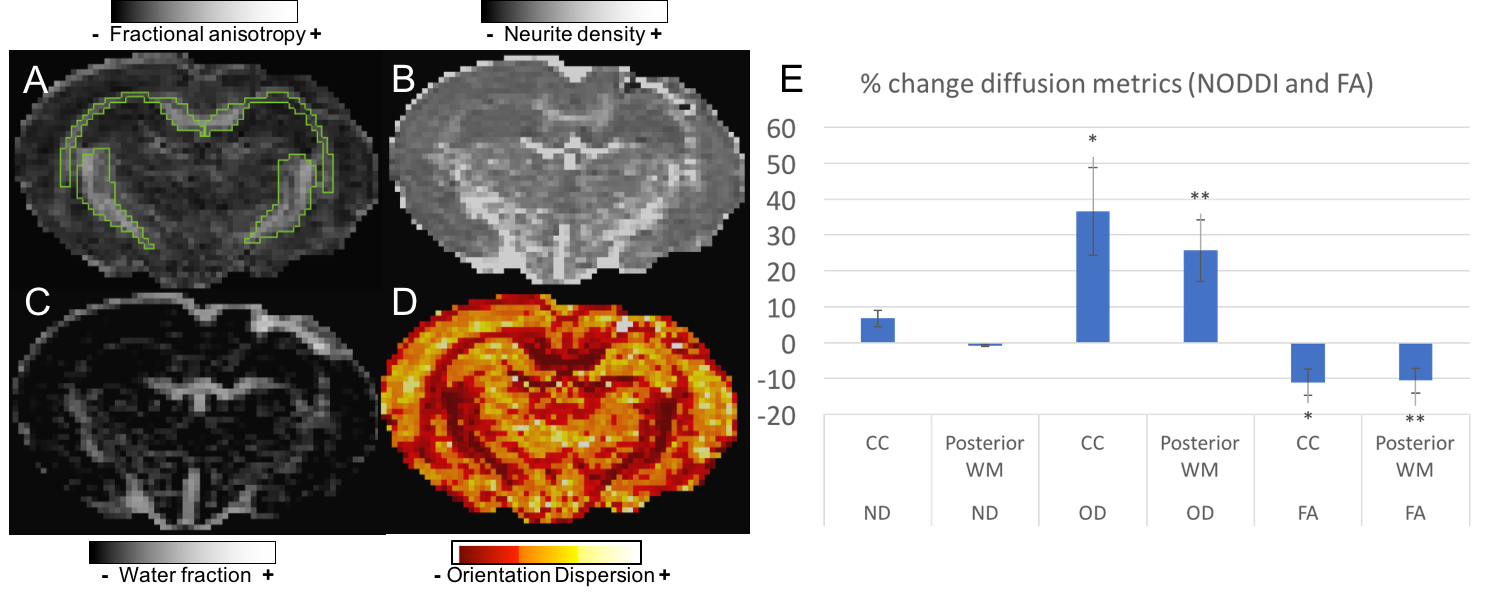
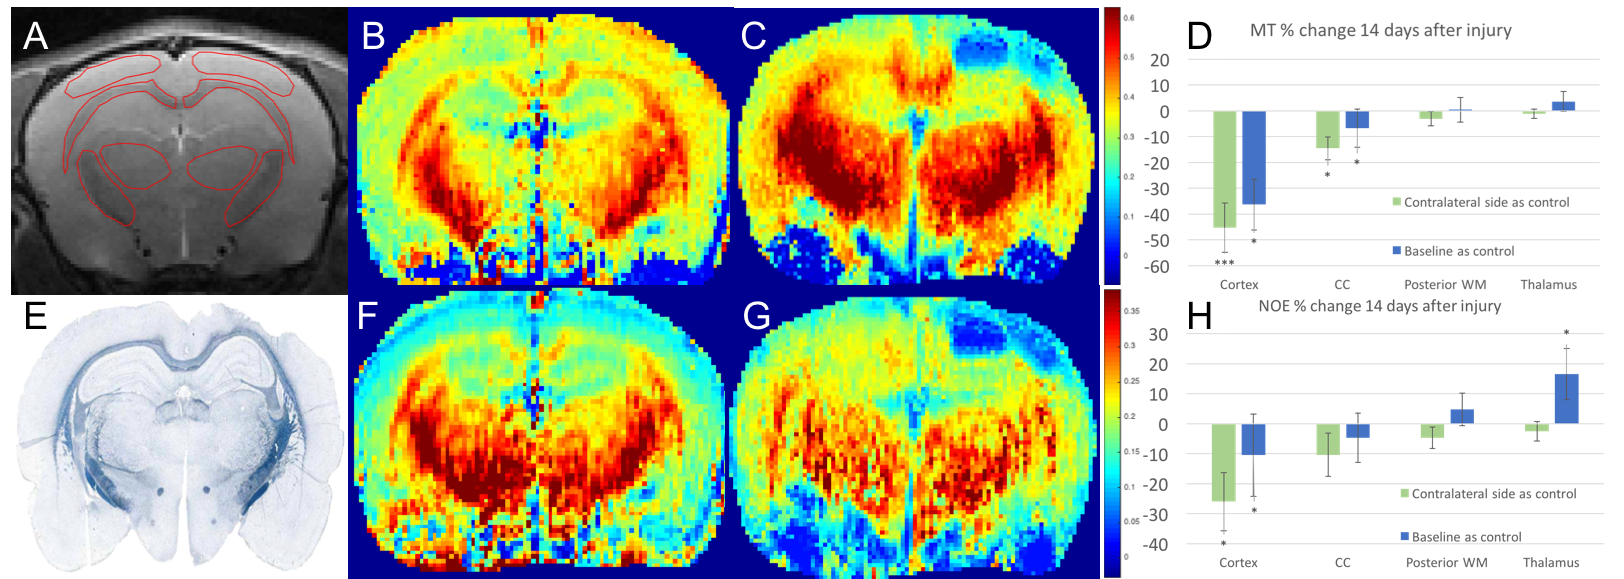
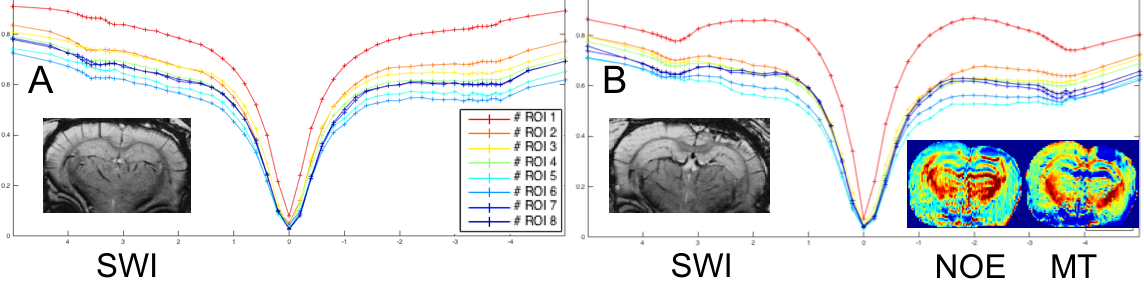
Fig 3. A: CEST spectra averaged per ROI in a rat with an absence of haemorrhage in the contusion area and susceptibility weighted image (SWI) associated. B: The NOE signal at -3.5ppm is increased in the cortex, ventricle and neighbouring areas in this other animal, due to the blood in the contusion area, visible in SWI. MT is less affected.
ROI 1/2: Ipsilateral/contralateral cortex; ROI 3/4: Ipsilateral/contralateral CC; ROI 5/6: Ipsilateral/contralateral posterior WM; ROI 7/8: Ipsilateral/contralateral thalamus.