5505
Quantifying the Myelin and Iron Contents of the Brain in vivo using a Linear Model of Relaxation1NMR Unit, Max Planck Institute for Human Cognitive and Brain Sciences, Leipzig, Germany
Synopsis
Quantitative MRI maps are believed to strongly correlate with myelin and iron contents. Recently, a linear model combining prior information from non-MRI techniques was proposed for quantifying myelin and iron based on relaxometry (R1 and R2*) in post-mortem human brain samples. Here, we propose an adaptation of the linear relaxation model that is capable of predicting (with some limitations) the myelin and iron contents of the brain under in vivo conditions. It uses prior knowledge from the literature to calibrate the linear coefficients and was validated in a cohort of 10 subjects.
Purpose
The analysis of the composition of biological tissues through quantitative MRI is a promising technique towards in vivo histology1. A semi-empirical linear model relating the iron and sulfur/phosphorus concentrations (as markers for myelin) to the MRI relaxation rates $$$R_1$$$ and $$$R_2^*$$$ was proposed and validated in human post-mortem brain samples2. However, those results are difficult to reproduce both ex vivo (because of the strong dependence of the parameters on the experimental conditions3) and in vivo, as a result of the different relaxation regimes4. The difficulty in obtaining similar non-MRI data under in vivo conditions has prevented the application of this model to the living brain. In this work, we propose an extension of the linear model to predict the myelin and iron content of brain tissue under in vivo conditions using relaxation information. This is achieved by estimating the model coefficients using simultaneously acquired $$$R_1$$$ and $$$R_2^*$$$ data5 combined with information of tissue composition from the literature6,7,8,9. The results are then validated (or, more precisely, checked for self-consistency) using the newly obtained myelin $$$X_\mathrm{My}$$$ and iron $$$X_\mathrm{Fe}$$$ content (group averaged) maps.
Methods
The semi-empirical linear model of relaxation is given by2,10:
$$\vec{P}=\boldsymbol{A}\vec{X} + \vec{P}_0$$
with $$$\vec{P}\equiv(R_1,R_2^*)$$$ and $$$\vec{X}\equiv(X_\mathrm{My},X_\mathrm{Fe})$$$. $$$A\equiv[[\mathcal{r}_{1,\mathrm{My}},\mathcal{r}_{1,\mathrm{Fe}}], [\mathcal{r}^*_{2,\mathrm{My}},\mathcal{r}^*_{2,\mathrm{Fe}}]]$$$ is defined in terms of the relaxivities $$$\mathcal{r}$$$ and $$$\vec{P}_0\equiv(R_1[\mathrm{bl}],R_2^*[\mathrm{bl}])$$$ are the baseline relaxations.
This can be rewritten as:$$\vec{X}=\boldsymbol{A}^{-1}(\vec{P}-\vec{P}_0)=\boldsymbol{A}^{-1}\vec{P}-\boldsymbol{A}^{-1}\vec{P}_0\equiv\boldsymbol{A}^{-1}\vec{P}+\vec{P}_{A,0}$$With sufficient knowledge of $$$\vec{X}$$$ and $$$\vec{P}$$$ in some Regions-Of-Interest (ROIs), it is possible to estimate $$$\boldsymbol{A}$$$ and $$$\vec{P}_0$$$, which can then be used to determine $$$\vec{X}$$$ in the brain.
Quantitative $$$R_1$$$, $$$R_2^*$$$ maps ($$$0.6\;\mathrm{mm}$$$ isotropic nominal resolution) of the full brain were simultaneously acquired using ME-MP2RAGE5 in 10 healthy volunteers (5 males, 5 females, age: $$$20-29\;\mathrm{yr}$$$), with a MAGNETOM 7T (Siemens, Erlangen, Germany) and a circularly-polarized Tx / 32-channel Rx Nova coil. The MRI maps were skull-stripped, co-registered to MNI space (using FSL11 and ANTs12) and group averaged together. We extracted ROIs probabilistic masks from the Oxford-Harvard Cortical and Subcortical Atlases for which corresponding information on myelin (assumed to be equal to lipid) and/or iron contents are available. In such ROIs, the average (weighted for the inverse of the variance) $$$R_1$$$ and $$$R_2^*$$$ were calculated. These values, tabulated in Fig.[1], were used to determine optimal values for the coefficients $$$\boldsymbol{A}^{-1}$$$ and $$$\vec{P}_{A,0}$$$ using an Orthogonal Distance Regression (ODR) fit (separately for $$$X_\mathrm{My}$$$ and $$$X_\mathrm{Fe}$$$).
Then, the values of the coefficients are used to compute myelin and iron maps, whose values on the ROIs of Fig.[1] are validated (checked for self-consistency) with the literature.
Results
The group average and standard deviation of the measured relaxation maps are shown in Fig.[2]. Note the overestimation of the $$$R_2^*$$$ values near the nasal cavity, which appears as a darkening in the bottom part of the coronal view of the group average $$$R_2^*$$$ map. A graphical representation of the fits is show in Fig.[3]. The corresponding parameter values are:
$$\boldsymbol{A}^{-1}=\left[\begin{array}{cc}47.2\pm{}4.6&-0.50\pm{}0.10\\-205\pm{}58&5.48\pm{}0.84\\\end{array}\right]$$
$$\vec{P}_{A,0} = \left[\begin{array}{c}-7.8\pm{}1.6\\16\pm{}31\\\end{array}\right]$$
These were used to compute myelin and iron content maps as presented in Fig.[4]. The error caused by $$$R_2^*$$$ overestimation propagated to both myelin and iron maps. The myelin and iron content estimated from the newly calculated maps is compared with the literature values on the selected ROIs in Fig.[5].
Discussion
The determination of the model coefficients enables the computation of $$$X_\mathrm{My}$$$ and $$$X_\mathrm{Fe}$$$ maps with realistic values matching relatively well the literature data.
The $$$X_\mathrm{My}$$$ estimations are more consistent than those for $$$X_\mathrm{Fe}$$$ as indicated by the values of the residual variance. However, further conclusions cannot be drawn, given the reduced number of points available for fitting.
The $$$R_2^\prime$$$ component in $$$R_2^*$$$ maps is likely to be responsible for the overestimations near the nasal cavity, and future models should consider refining/replacing this parameter, or developing correction schemes, although this may require new ex vivo validations and more complex acquisition and/or post-processing techniques.
Of note, the myelin estimates are inaccurate in the Globus Pallidus (the negative values obtained there are meaningless!). This might be an indication that a purely linear model is inappropriate for such estimations over the whole range of brain tissues, as previously suggested for $$$R_1$$$10,13,14. We suggest that myelin estimates co-localized with high iron content are less reliable.
Conclusion
In this work we quantified for the first time in vivo the myelin and iron content in brain tissues, using a linear model of relaxation on quantitative MRI maps, obtaining values in general agreement with the literature. Future developments of this technique may increase the accuracy of the estimations, with important applications in clinical as well as research settings.Acknowledgements
We would like to thank the following people for insightful discussions: Carsten Stüber, Laurentius Huber, Henrik Marschner, Robert Trampel, Evgeniya Kirilina and Nikolaus Weiskopf.
Funded by: EU through the 'HiMR' Marie Curie ITN (FP7-PEOPLE-2012-ITN-316716), the Max Planck Society through IMPRS NeuroCom, and the Helmholtz Alliance 'ICEMED - Imaging and Curing Environmental Metabolic Diseases'.
References
- Weiskopf, N., Mohammadi, S., Lutti, A., Callaghan, M.F., 2015. Advances in MRI-based computational neuroanatomy: from morphometry to in-vivo histology. Curr. Opin. Neurol. 28, 313–322. doi:10.1097/WCO.0000000000000222
- Stüber, C., Morawski, M., Schäfer, A., Labadie, C., Wähnert, M., Leuze, C., Streicher, M., Barapatre, N., Reimann, K., Geyer, S., Spemann, D., Turner, R., 2014. Myelin and iron concentration in the human brain: A quantitative study of MRI contrast. NeuroImage 93, Part 1, 95–106. doi:10.1016/j.neuroimage.2014.02.026
- Shepherd, T.M., Thelwall, P.E., Stanisz, G.J., Blackband, S.J., 2009. Aldehyde fixative solutions alter the water relaxation and diffusion properties of nervous tissue. Magn. Reson. Med. 62, 26–34. doi:10.1002/mrm.21977
- Shepherd, T.M., Flint, J.J., Thelwall, P.E., Stanisz, G.J., Mareci, T.H., Yachnis, A.T., Blackband, S.J., 2009. Postmortem interval alters the water relaxation and diffusion properties of rat nervous tissue — Implications for MRI studies of human autopsy samples. NeuroImage 44, 820–826. doi:10.1016/j.neuroimage.2008.09.054
- Metere, R., Kober, T., Möller, H.E., Schäfer, A., 2017. Simultaneous Quantitative MRI Mapping of T1, T2* and Magnetic Susceptibility with Multi-Echo MP2RAGE. PLOS ONE 12, e0169265. doi:10.1371/journal.pone.0169265
- Hallgren, B., Sourander, P., 1958. The Effect of Age on the Non-Haemin Iron in the Human Brain. Journal of Neurochemistry 3, 41–51. doi:10.1111/j.1471-4159.1958.tb12607.x
- Randall, L.O., 1938. Chemical Topography of the Brain. J. Biol. Chem. 124, 481–488.
- LeVine, S.M., Wulser, M.J., Lynch, S.G., 1998. Iron Quantification in Cerebrospinal Fluid. Analytical Biochemistry 265, 74–78. doi:10.1006/abio.1998.2903
- Nagai, Y., Kanfers, J.N., 1971. Composition of human cerebrospinal fluid cerebroside. J. Lipid Res. 12, 143–148.
- Rooney, W.D., Johnson, G., Li, X., Cohen, E.R., Kim, S.-G., Ugurbil, K., Springer, C.S., 2007. Magnetic field and tissue dependencies of human brain longitudinal 1H2O relaxation in vivo. Magn. Reson. Med. 57, 308–318. doi:10.1002/mrm.21122
- Jenkinson, M., Beckmann, C.F., Behrens, T.E.J., Woolrich, M.W., Smith, S.M., 2012. FSL. NeuroImage, 20 YEARS OF fMRI 62, 782–790. doi:10.1016/j.neuroimage.2011.09.015
- Avants, B.B., Tustison, N.J., Song, G., Cook, P.A., Klein, A., Gee, J.C., 2011. A reproducible evaluation of ANTs similarity metric performance in brain image registration. NeuroImage 54, 2033–2044. doi:10.1016/j.neuroimage.2010.09.025
- Callaghan, M.F., Helms, G., Lutti, A., Mohammadi, S., Weiskopf, N., 2015. A general linear relaxometry model of R1 using imaging data. Magn. Reson. Med. 73, 1309–1314. doi:10.1002/mrm.25210
- Metere, R., Möller, H.E., 2016. Linear Models for Estimating Myelin and Iron Content in the Brain, in: Proceedings of the ISMRM 24th Annual Meeting & Exhibition. Presented at the 24th Annual Meeting & Exhibition of the International Society for Magnetic Resonance in Medicine, Singapore.
- Hopkins, A.L., Yeung, H.N., Bratton, C.B., 1986. Multiple field
strength in vivo T1 and T2 for cerebrospinal fluid protons. Magn. Reson.
Med. 3, 303–311. doi:10.1002/mrm.1910030214
Figures
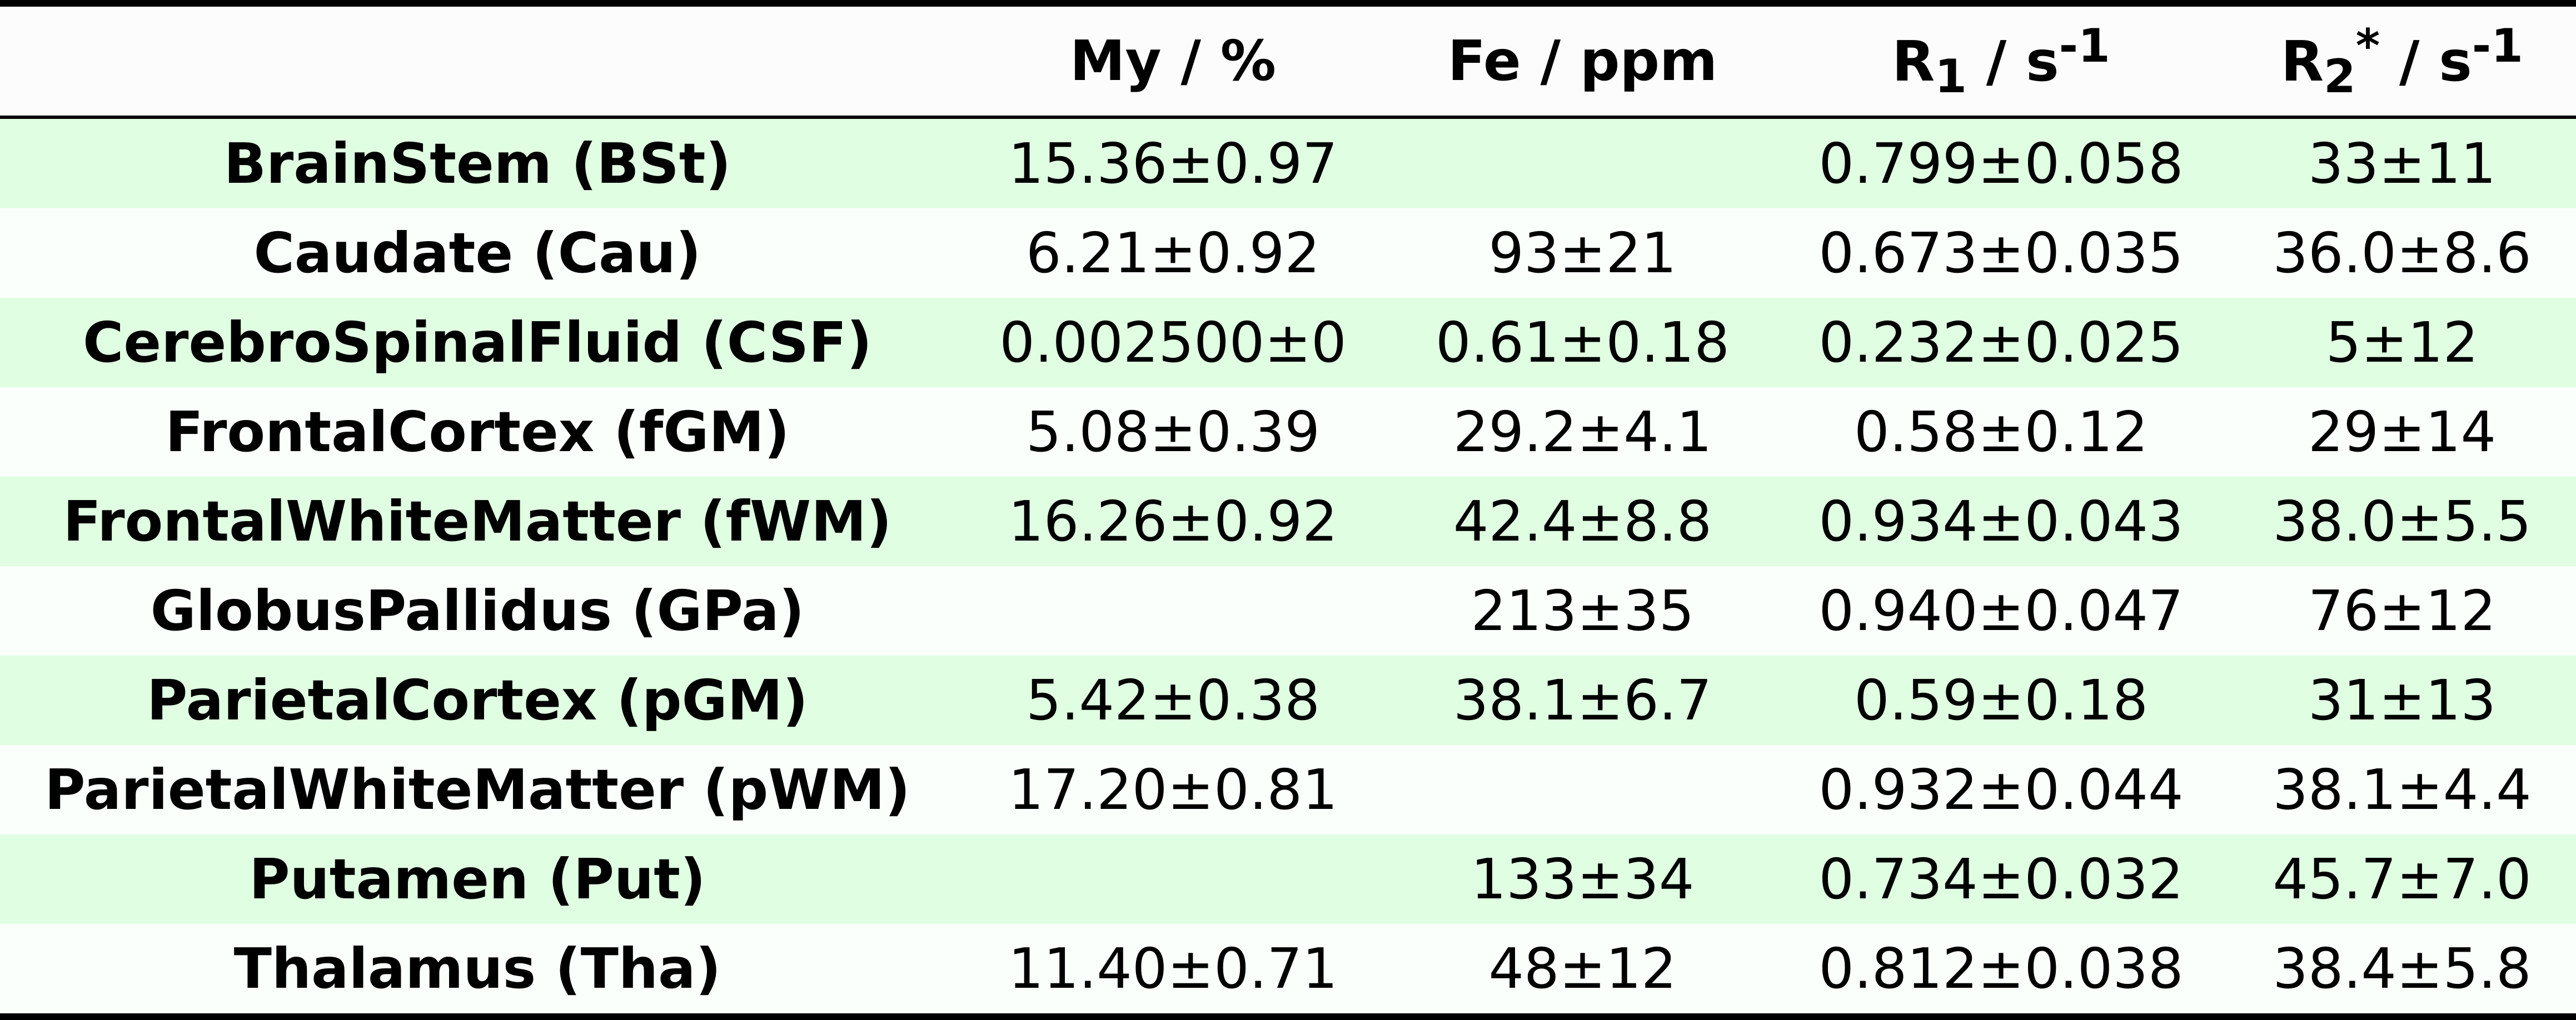
Fig.1: Regions-Of-Interest (ROIs) used for determining model parameters.
The myelin $$$X_\mathrm{My}$$$ content (assumed to be identical to the lipid content) was obtained from [7,9] while the iron content $$$X_\mathrm{Fe}$$$ was obtained from [6,8]. Units are % for myelin and ppm for iron, both measured as mass to wet mass ratio. The $$$R_1$$$ and $$$R_2^*$$$ values were obtained from ME-MP2RAGE acquisitions5, with the exception of $$$R_1$$$ for cerebrospinal fluid (CSF), which (ME-)MP2RAGE typically estimates incorrectly, and whose value is determined from literature15. Blank cells indicates that the data is not available in the sources.
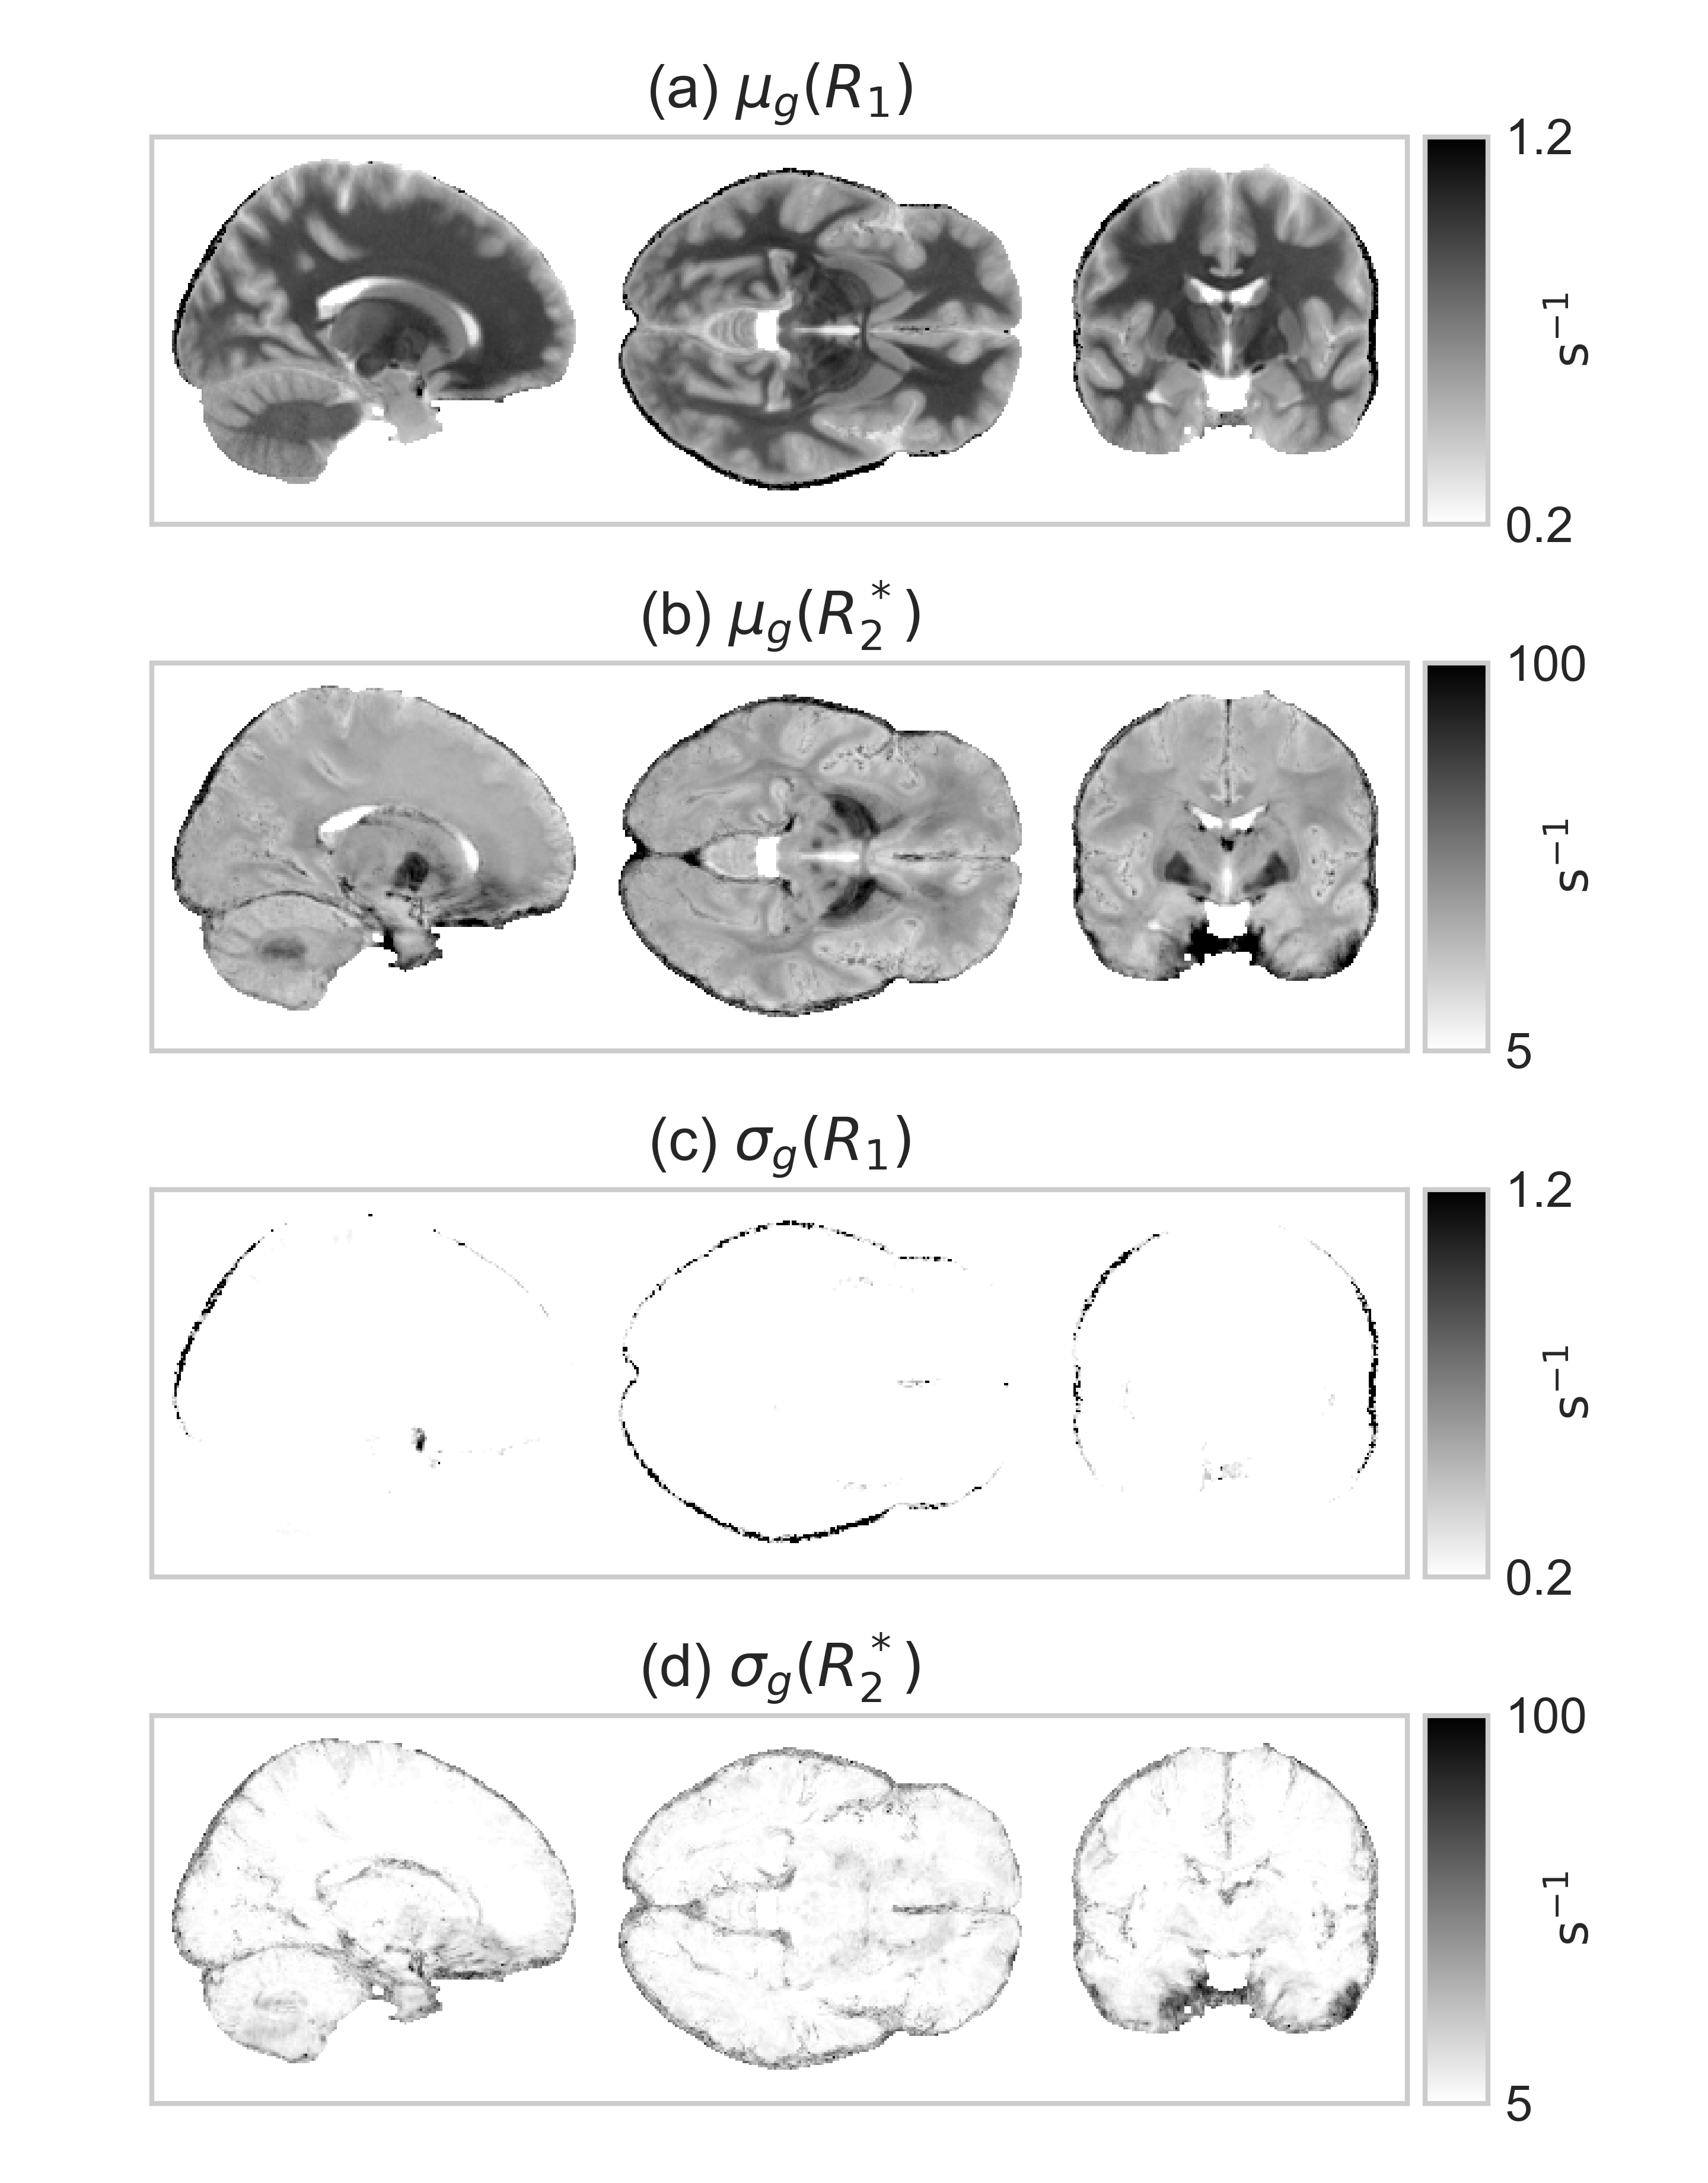
Fig.2: The group average and standard deviation of the relaxation maps.
$$$R_1$$$ and $$$R_2$$$ are the longitudinal and transverse relaxation maps obtained using ME-MP2RAGE with the same acquisition parameters as in [5] ($$$600\;\mathrm{\mu m}$$$, $$$T_{I,(1,2)}=750,2900\;\mathrm{ms}$$$, $$$\alpha_{1,2}=3,6°$$$, $$$T_R=6000\;\mathrm{ms}$$$, $$$T_{E,i}=2.35,6.59,10.63,14.77\;\mathrm{ms}$$$). The black borders surrounding the brain tissues are a registration artifact. The group standard deviation of $$$R_1$$$ is significantly less than that of $$$R_2^*$$$, indicating the higher level of reproducibility of $$$R_1$$$, consistent with the findings in [5].
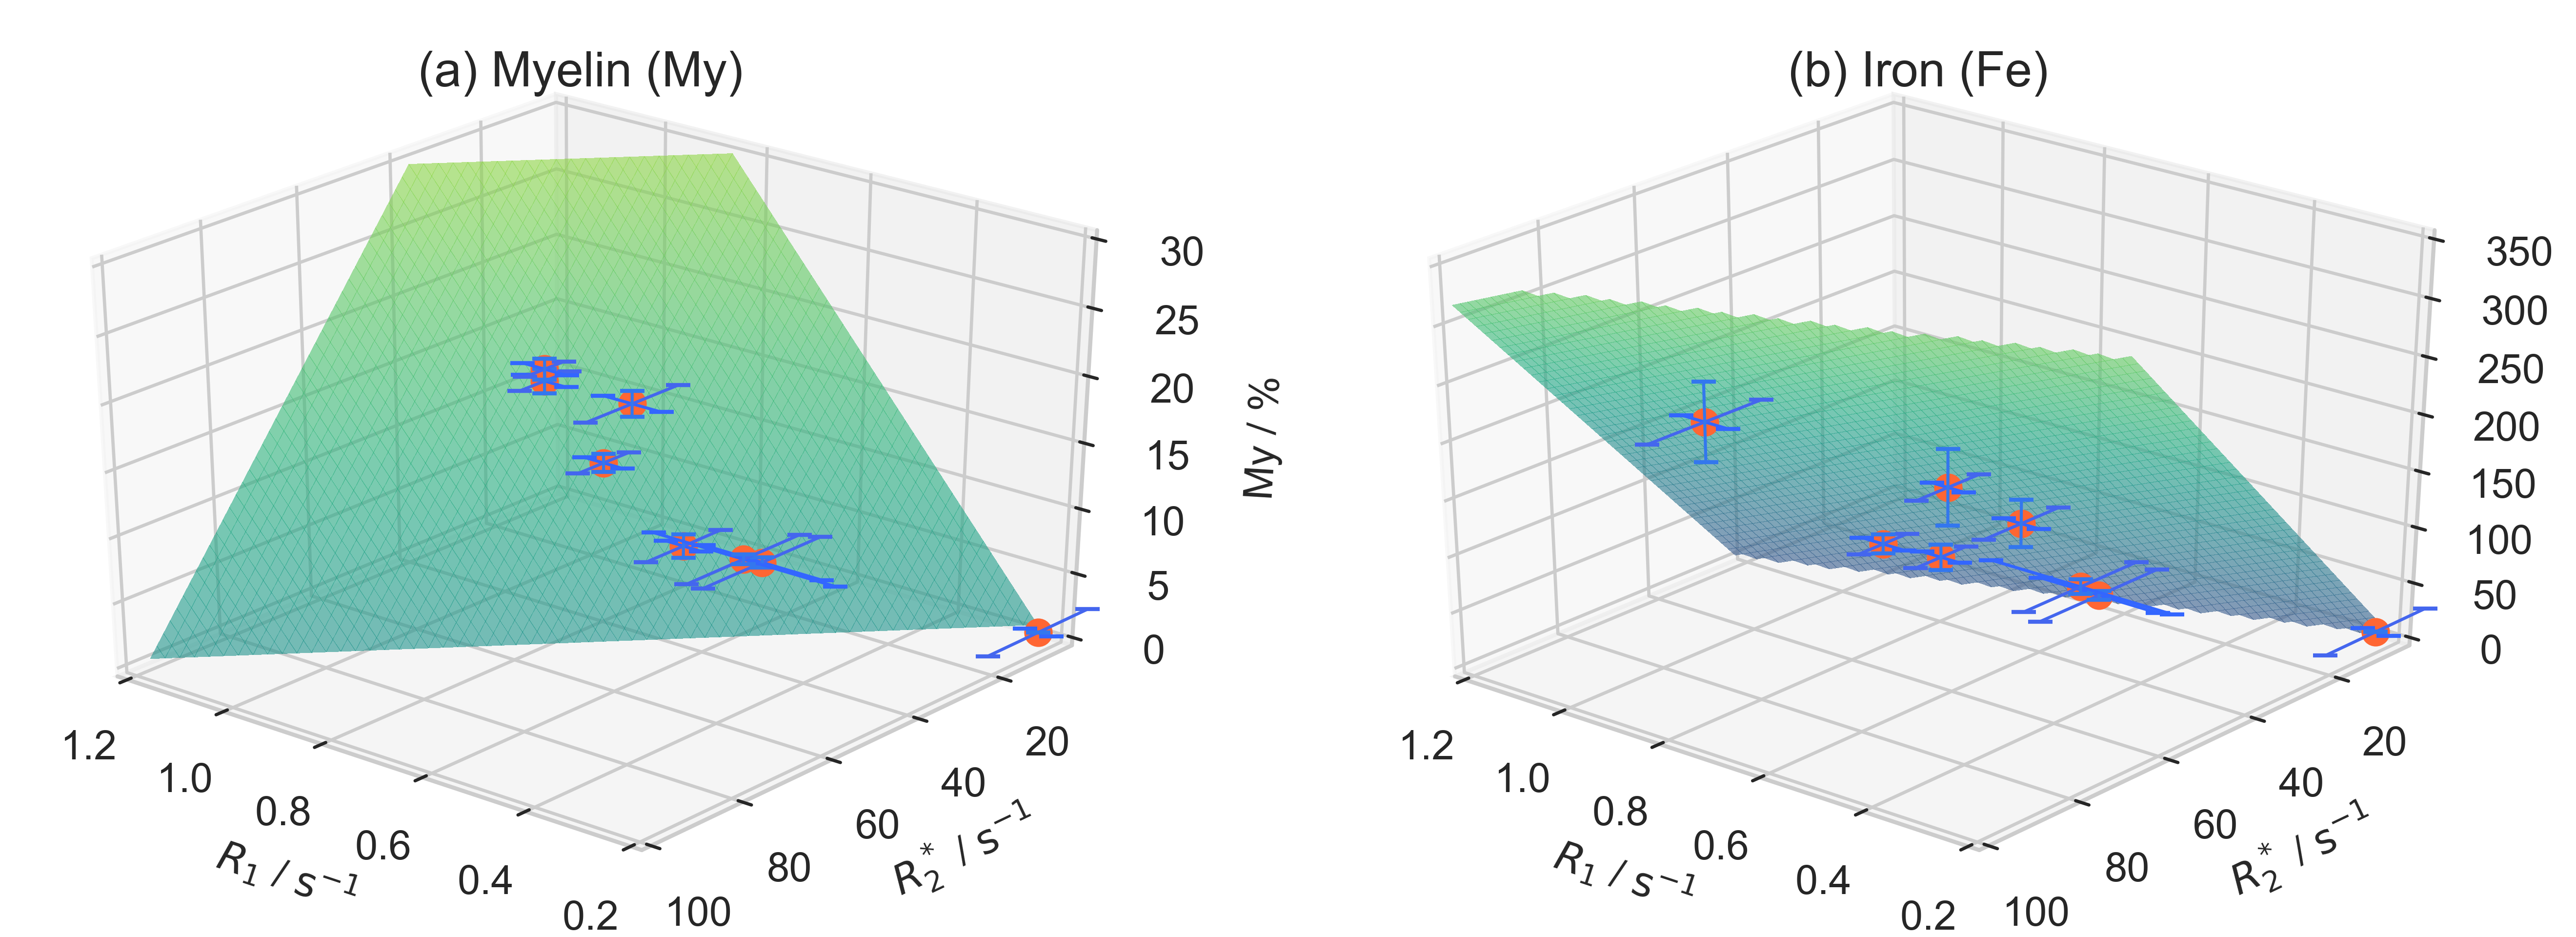
Fig.3: Results of the ODR affine fits on the priors.
Visual representation of the Orthogonal Distance Regression (ODR) fits for both macromolecules and iron content. This regression method is suited when the errors on the independent variables cannot be ignored. The fits were performed separately for the two relaxing agents. The numerical results of the fits, including their standard errors, are reported, in addition to the (relative) residual variance, i.e. the fraction of the variance in the dependent variable that cannot be explained by the model.
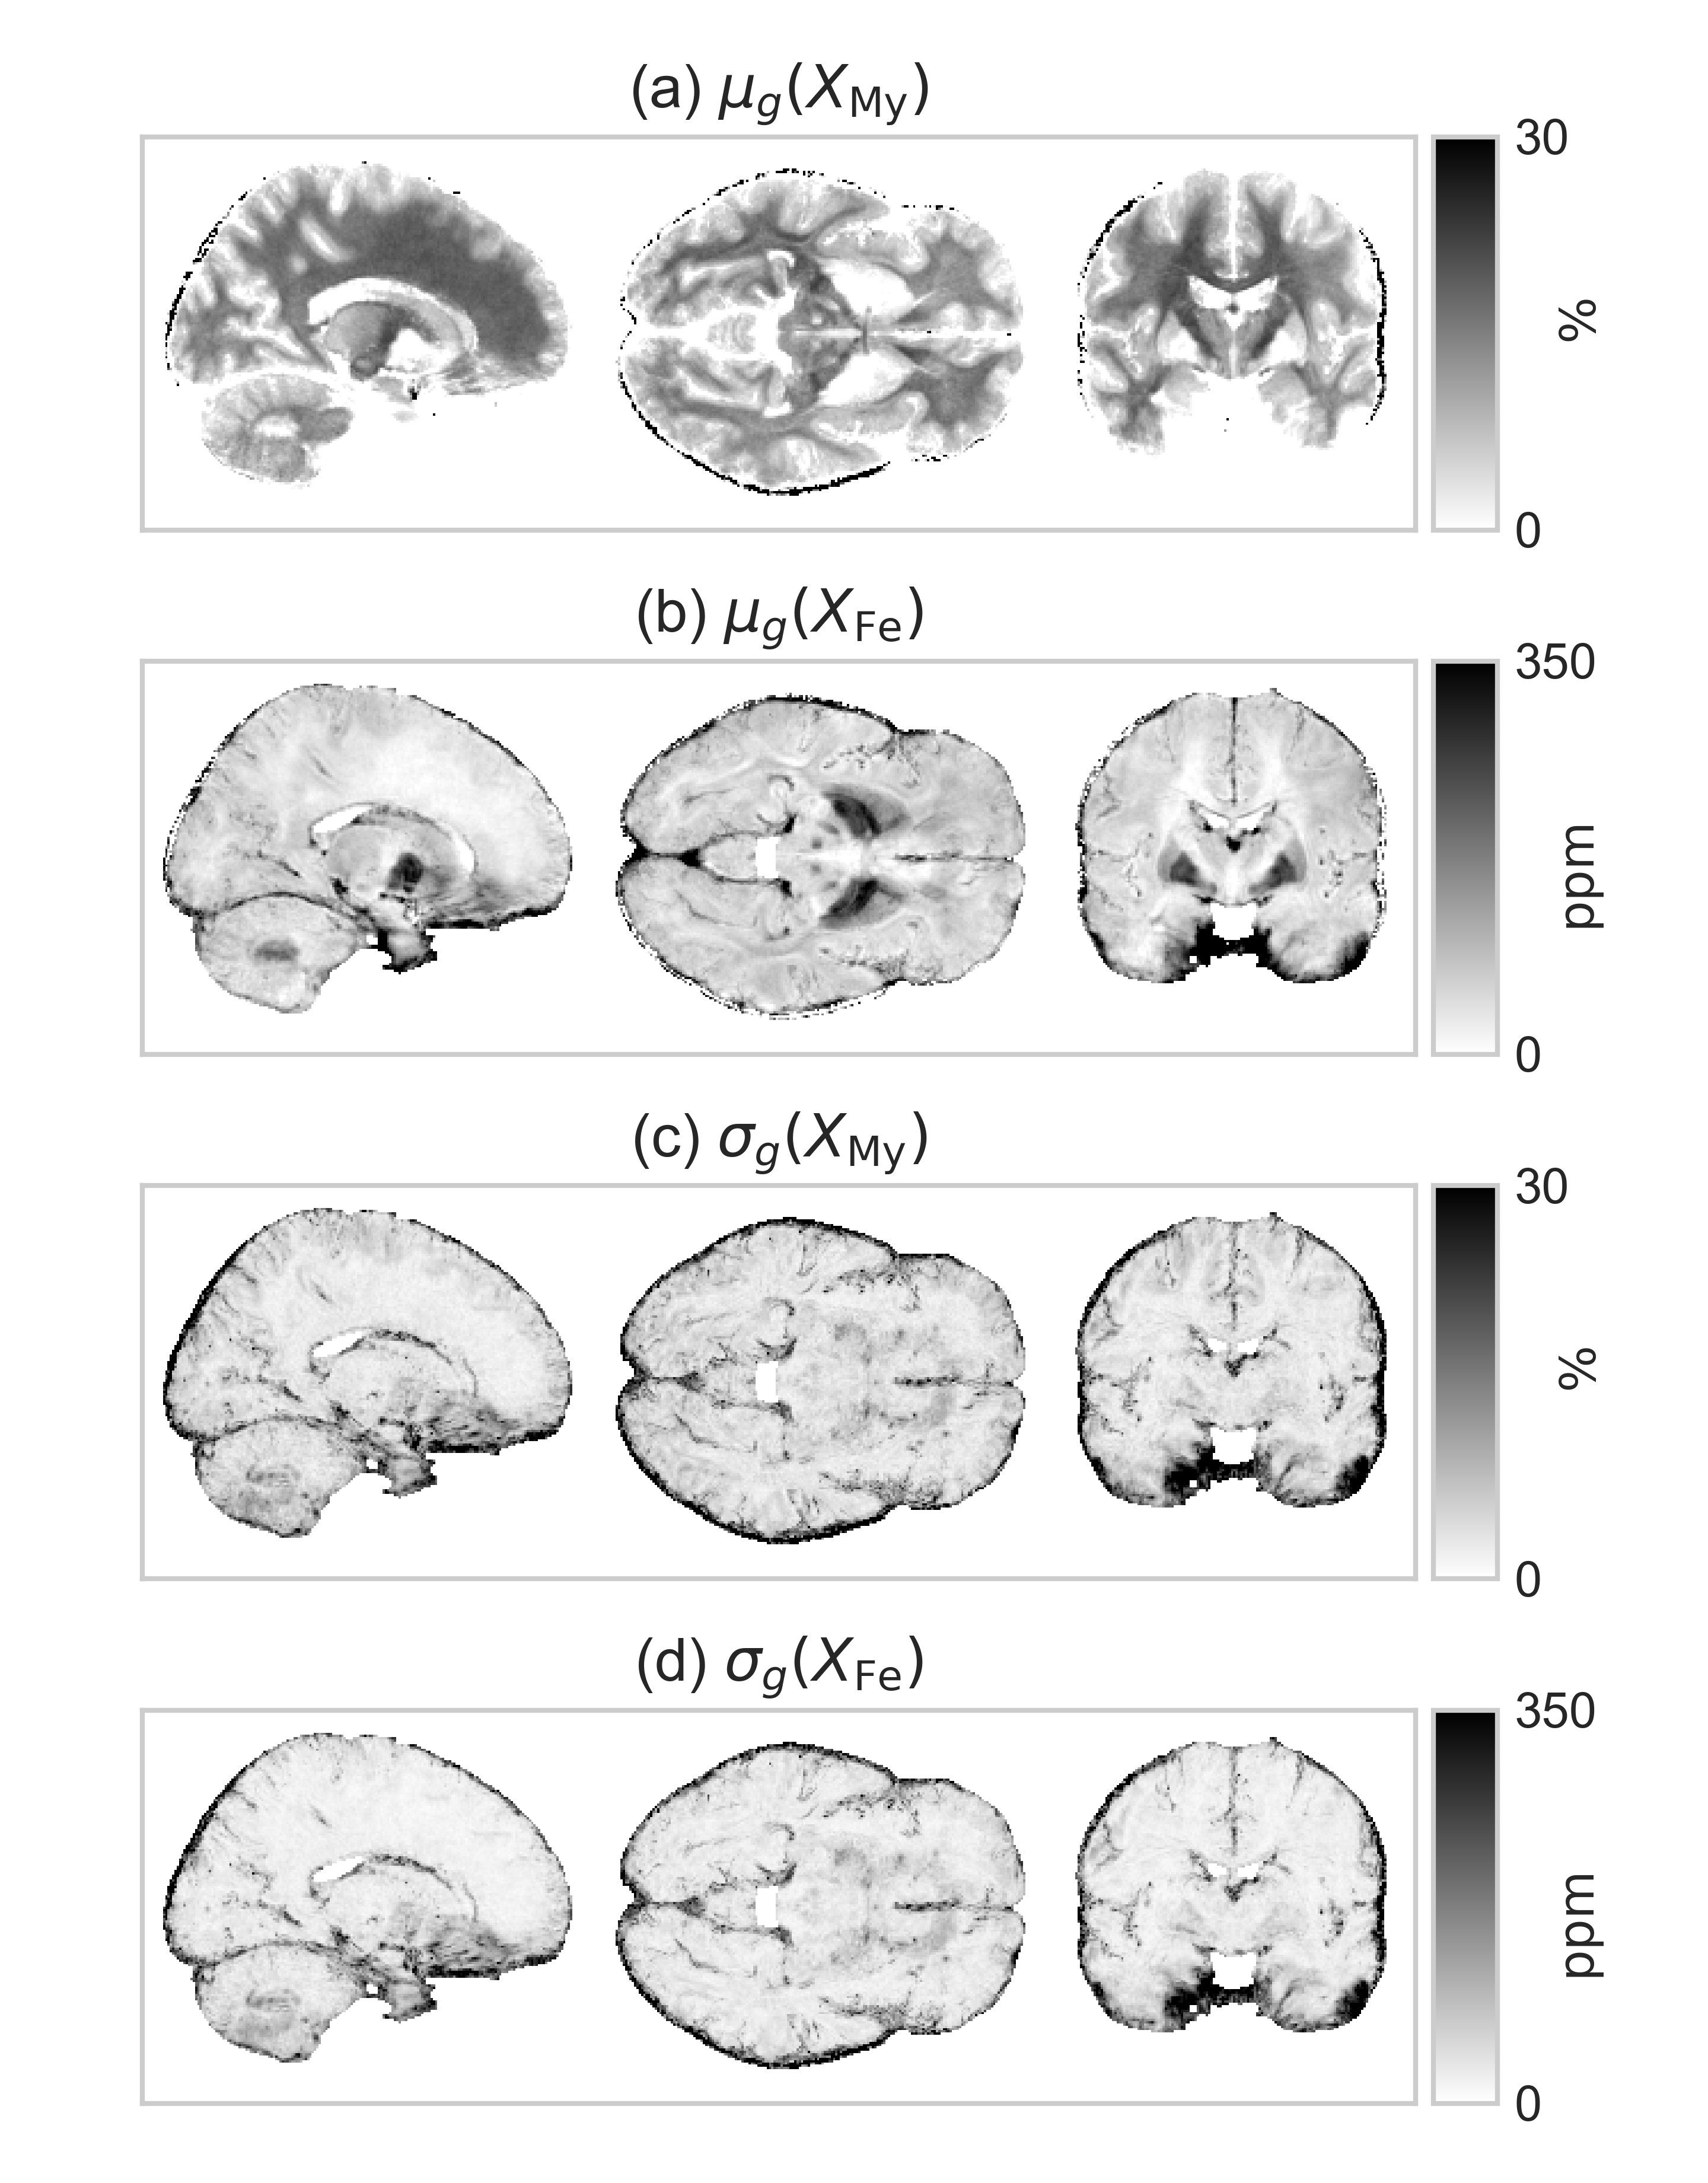
Fig.4: The group average and the standard deviation of the myelin and iron maps.
$$$X_\mathrm{My}$$$ and $$$X_\mathrm{Fe}$$$ are myelin and iron maps obtained by applying the linear model (with the parameter values obtained with the ODR fits) to the relaxation maps $$$R_1$$$ and $$$R_2^*$$$. Realistic values are reproduced in almost all voxels. The larger biases and inferior reproducibility originating from $$$R_2^*$$$ maps affects both estimates similarly.
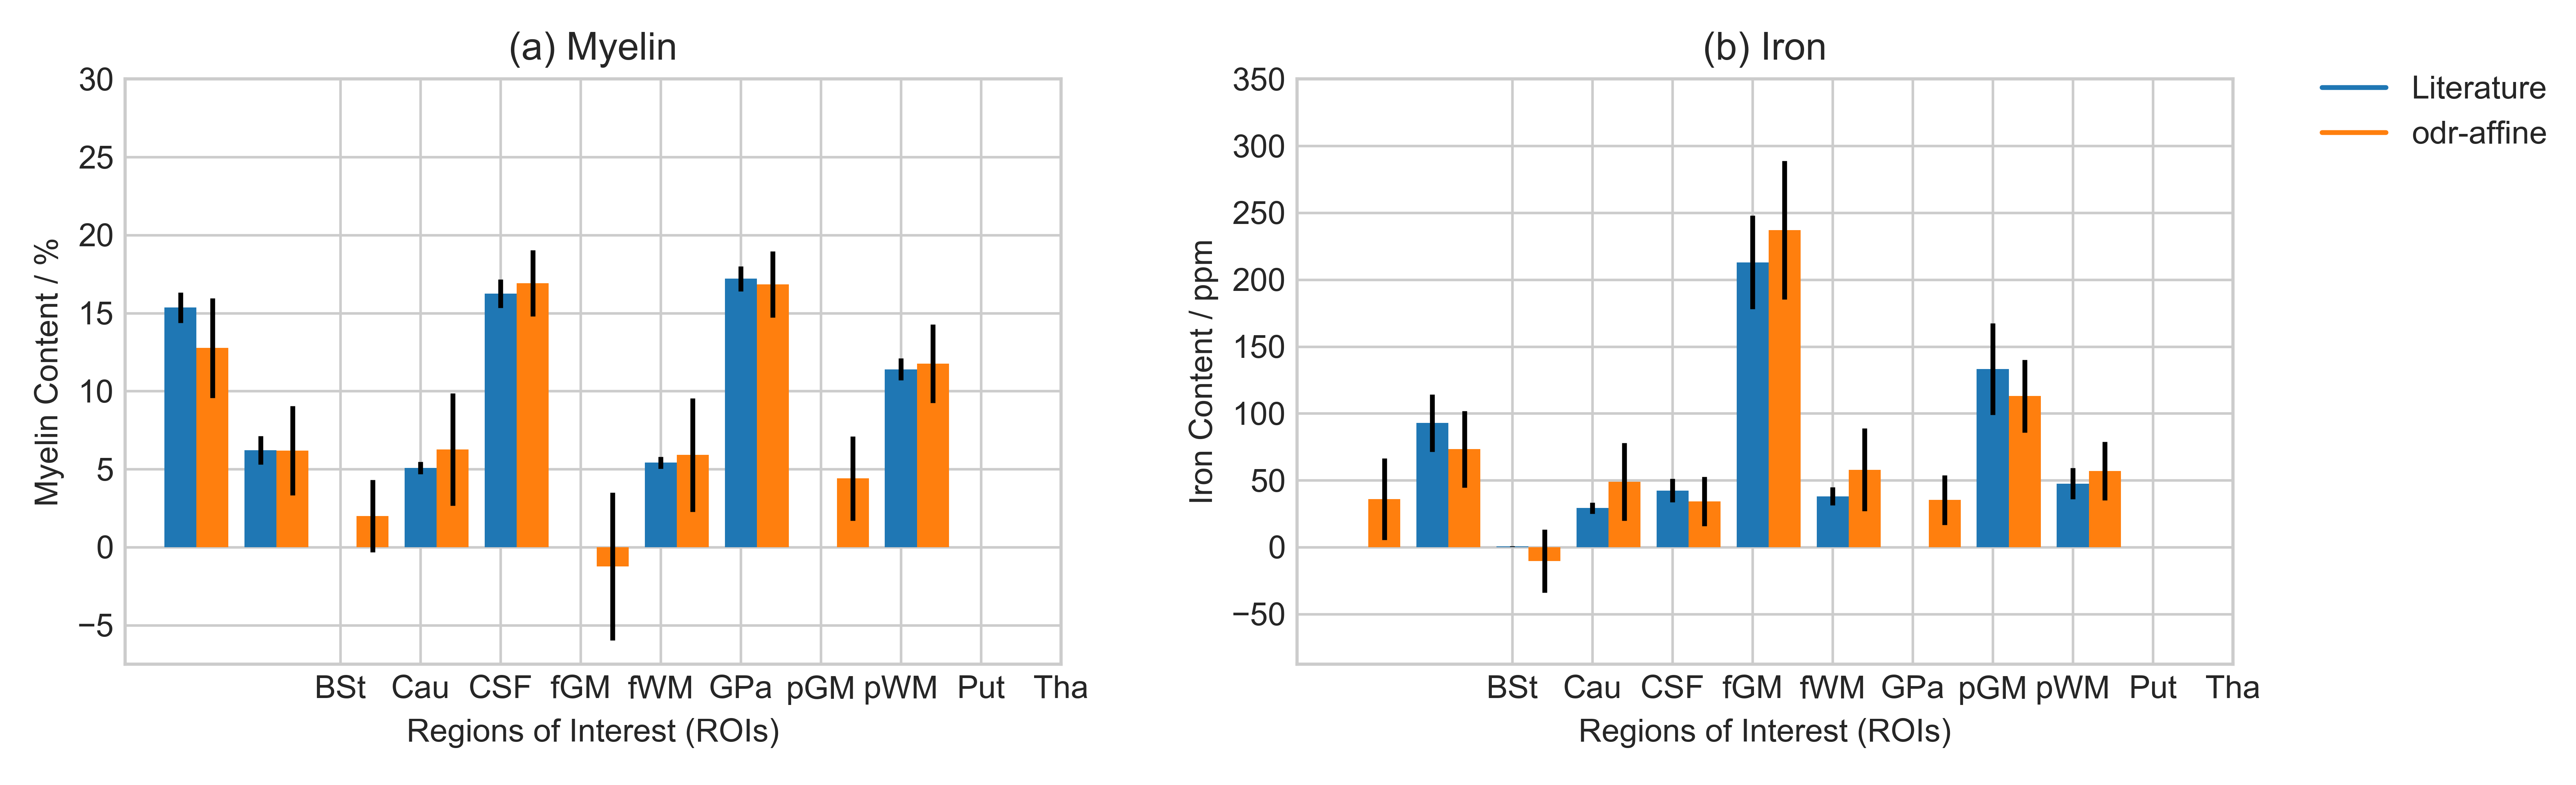
Fig.5: ROI-based validation of the myelin and iron maps.
The mean values of the myelin and iron content group averages are calculated in each Region-Of-Interest (ROI) (and weighted for the inverse of the group variance). These are compared with the values from the literature5,6,7,8 (as reported in Fig.[1]). For all ROIs the values are within their respective standard deviations. The abbreviations for the ROIs were introduced in Fig.[1].