5501
Varying diffusion effects in susceptibility-based myelin water imaging produce characteristic signal decay curves1Heidelberg University Hospital, Heidelberg, Germany, 2German Cancer Research Center, Heidelberg, Germany
Synopsis
The biophysical origins of MR signal formation in uniform media such as an axon with its multilayered myelin envelope may produce signal characteristics that can be used to determine status and/or outcome of demyelinating disease. We extend a recently proposed model of neuronal magnetic susceptibility by including the whole dynamic range of diffusion effects to study gradient-echo MR signal decay. Our results may be used to adjust or control simulation studies on neuronal MR signal decay.
Introduction
Myelin microstructure and composition are thought of as the main underlying mechanisms to both signal and phase anisotropic properties in gradient-echo MRI of white matter (GRE)1. Specifically, loss of myelin in demyelination protocols leads to a loss of phase contrast between white matter and gray matter2,3. However, the absence of phase contrast between white matter and cerebrospinal fluid, who both feature very different material content, reveal the need for a comprehensive theory of the biophysical origins of GRE signal formation4,5,6. A recent approach proposed a neuronal three-compartment model with an inner axonal, an outer extracellular, and an interjacent multilayered myelin compartment6, the latter comprising alternating lipoprotein and aqueous ring layers that are concentrically arranged around the main axon. This model could account for the additional contribution of susceptibility anisotropy to the frequency shift in the axon, while only considering either no or very fast diffusion effects. Here we generalize their signal decay model for arbitrary diffusion strengths.
Methods
With the addtion of isotropically distributed myelin water susceptibility inclusions $$$\chi^{\text{mw}}$$$, axonal susceptibility $$$\chi^{\text{a}}$$$, myelin lipid susceptibility components parallel ($$$\chi^{\text{ml}}_{\parallel}$$$) and perpendicular ($$$\chi^{\text{ml}}_{\perp}$$$) to the radius vector $$$\mathbf{r}=(r,\phi)$$$, distance $$$d_w$$$ between lipid layers and $$$d$$$ between water layers, the myelin sheath frequency shift $$$\omega(r,\phi)$$$ can be determined as 6
$$ \omega(r,\phi) = c_1 \frac{R^2}{r^2}\cos(2\phi)+c_2\ln\left(\frac{R_{\text{ext}}}{r}\right)+c_3\,,$$ where $$$c_1=\frac12\omega_0 \sin^2\theta[\chi^{\text{a}}-\chi^{\text{mw}}]$$$, $$$c_2=\frac12 \omega_0 \sin^2\theta\frac{d}{d+d_w}\Delta\chi$$$, and $$$c_3=\frac12\omega_0\left[\frac23-\sin^2\theta\right]\chi^{\text{mw}}-\frac12\omega_0\sin^2\theta\frac{d}{d+d_w}\lambda\chi^{\text{ml}}_{\parallel}$$$, as well as $$$\omega_0=\gamma B_0$$$ with proton gyromagnetic ratio $$$\gamma$$$ and external magnetic field $$$B_0$$$ to which the axon tilts with angle $$$\theta$$$, and $$$\Delta\chi=\Delta\chi^{\text{ml}}=[\chi_{\parallel}^{\text{ml}}+\chi_{\perp}^{\text{ml}}t]/2$$$. We have also assumed that isotropically distributed susceptibility inclusions in myelin water, steming mostly from myelin remnants since myelin layers enclose aqueous layers, are similar to the effective isotropic myelin magnetic susceptibility. The radius of the axon is denoted as $$$R$$$, whereas the radius of the most distant myelin layer around the axon is denoted as $$$R_{\text{ext}}$$$. The term $$$\lambda\chi_{\parallel}^{\text{ml}}d/[d+d_{\text{w}}]$$$ can be attributed to a "hop-in hop-out'' mechanism as suggested in 7, where the parameter $$$\lambda$$$ denotes the apparent fraction of time that a water molecule resides in the lipid layer. The mechanisms account for an additional water molecule phase shift that is due to the aqueous layers in the myelin, but not due to the lipoprotein layers. Typically, $$$\Delta\chi$$$ is not zero due to the anisotropic myelin susceptibility.
Results
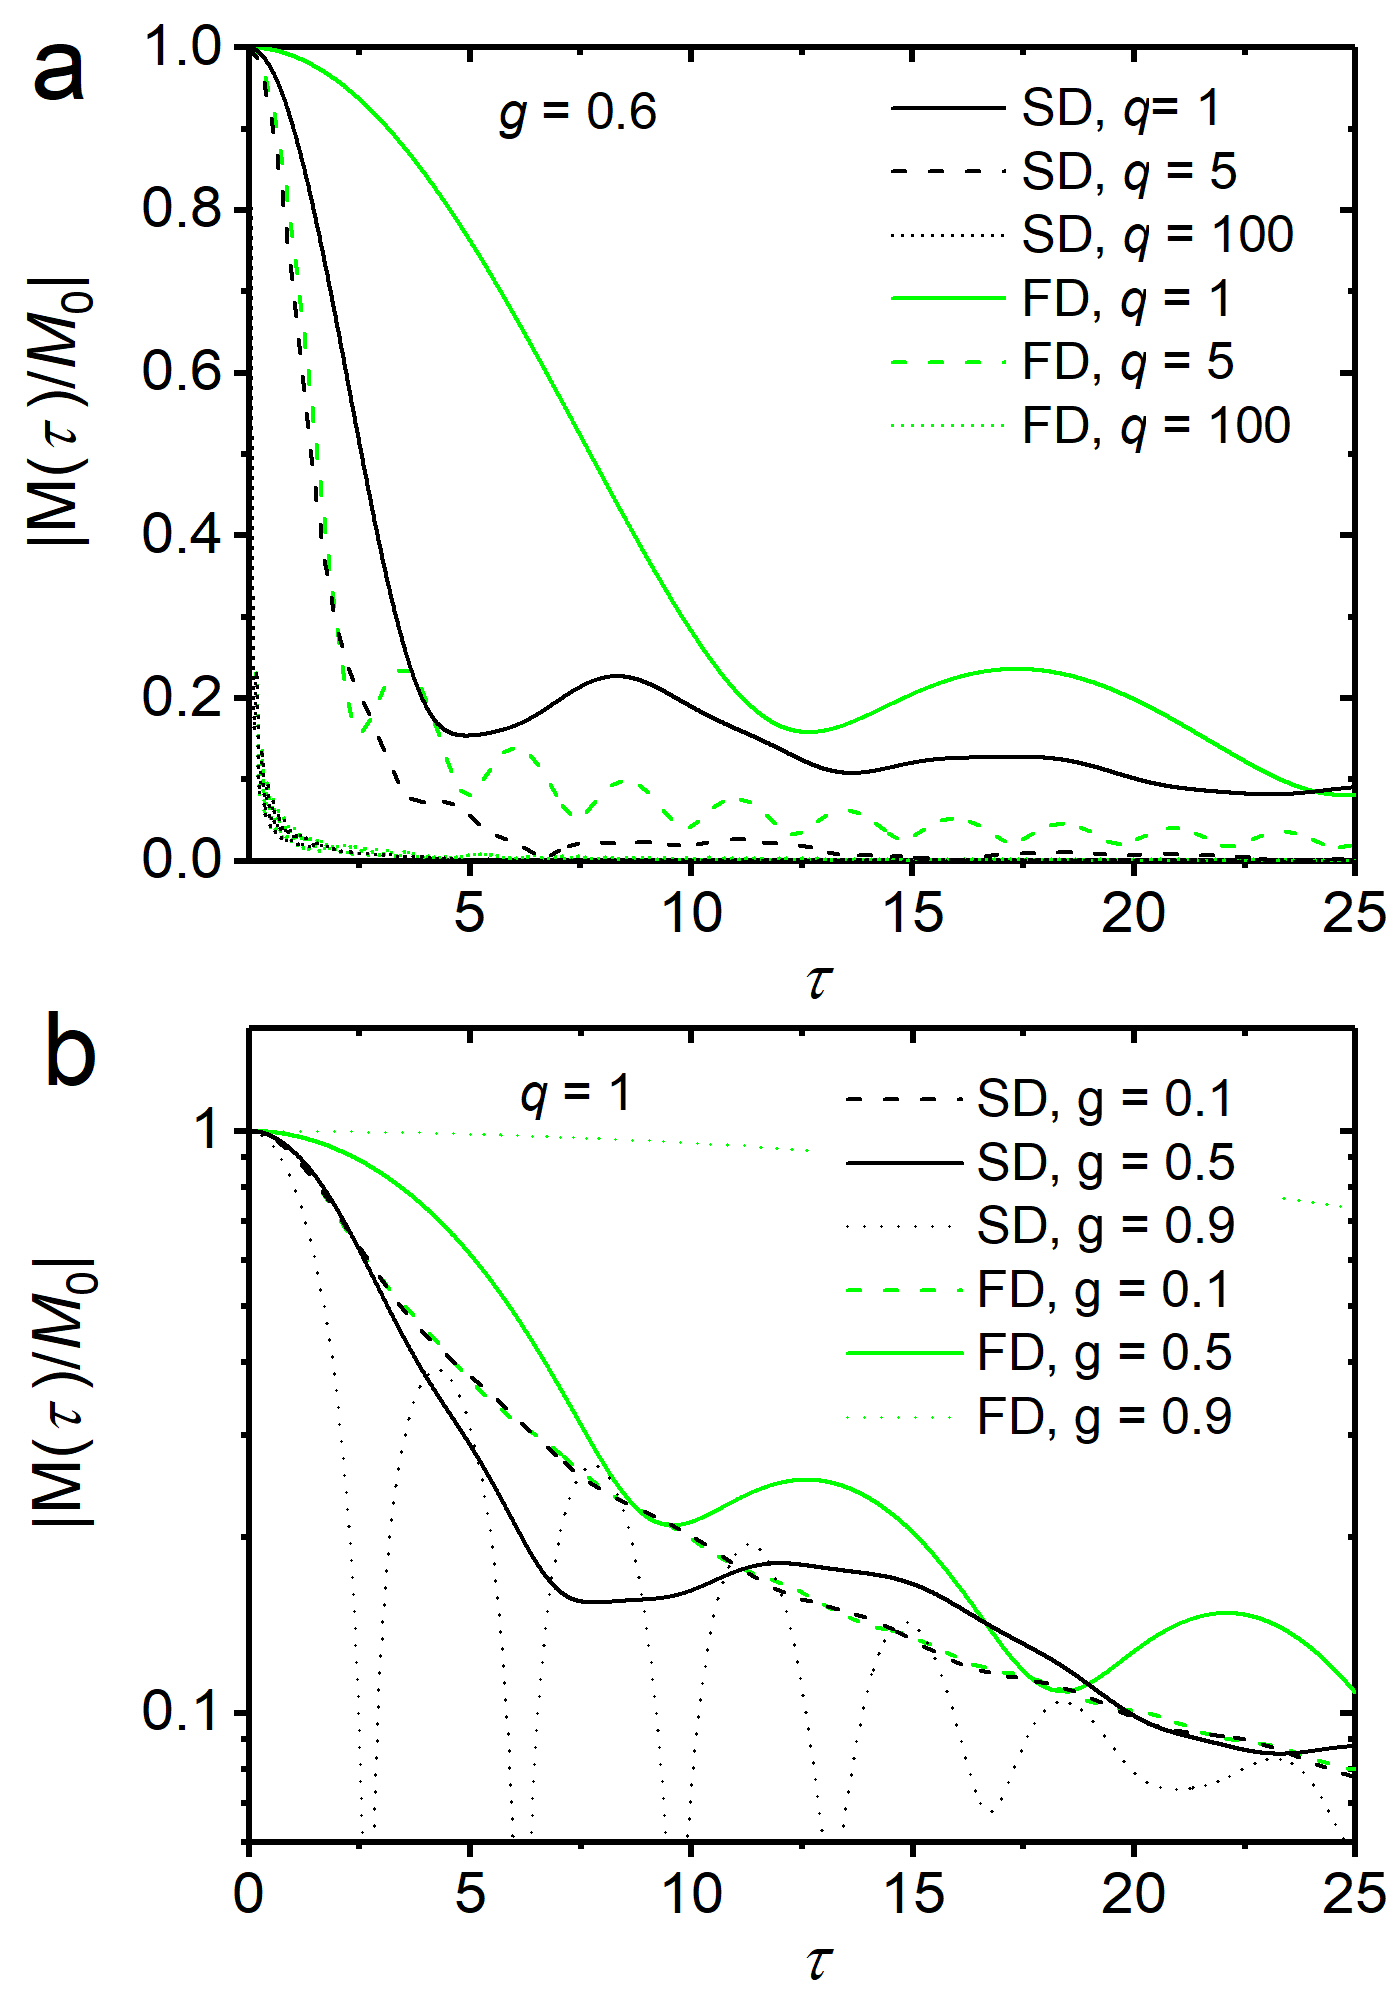
To obtain the myelin susceptibility-induced local magnetization $$$m(t)$$$, one has to solve the Bloch-Torrey equation $$$\frac{\partial}{\partial t}m(r,\phi,t)=\left[D\Delta-\text{i}\omega(r,\phi)-\frac{1}{T_2}\right]m(r,\phi,t)$$$ 8, where $$$D$$$ represents the diffusion coefficient (typically, $$$D=1\,\mu\text{m}^2\text{s}^{-1}$$$), $$$\Delta$$$ the Laplace operator, and $$$T_2$$$ the spin-spin relaxation time, toobtain the MR signal decay from the water-myelin compartment as $$$M(t)=V^{-1}\int_R^{R_\text{ext}}\,\text{d}V\,m(r,\phi,t)$$$ with dephasing volume $$$V=\pi[R_{\text{ext}}^2-R^2]$$$. For the regime of static dephasing, we find $$\frac{M(t)}{M_0}=\text{e}^{-\frac{1}{T_2}}\frac{1}{1-g^2}\frac{2}{2+\text{i} q \tau}\text{e}^{-\text{i} p \tau}\left[H(g^2\tau)-g^{2+\text{i} q \tau}H(\tau)\right]\,$$with $$$H(x)=_1\!\!F_2\left(\left\{-\frac12-\frac{\text{i} q\tau}{4}\right\},\left\{1,\frac12-\frac{\text{i} q\tau}{4}\right\},-\frac{x^2}{4}\right)$$$, and g-factor $$$g=R/R_{\text{ext}}$$$, as well as $$$p=c_3/c_1$$$, $$$q=c_2/c_1$$$, and $$$\tau=c_1 t$$$ (also, $$$M_0=M(0)$$$). Fig. 1 shows signal decays (for $$$T_2\to\infty$$$ without loss of generality) in the static dephasing regime from Eq. (3), and for the fast diffusion regime as developed in 6.
The full range of diffusion effects, however, can be obtained by a separation ansatz to solve the Bloch-Torrey equation. The angle-dependent part leads to a Mathieu differential equation and its Mathieu function solutions $$$\text{ce}_{2m}(\phi,\text{i}\bar{\tau}c_1/2)$$$ and eigenvalues $$$k_m^2$$$, see also 9. The radial eigenfunctions and -values ($$$\lambda_{nm}$$$) can be obtained by a uniformly convergent perturbation expansion, where the eigenvalues can be determined through the eigenvalue equation
$$\frac{\lambda\, J_{1-k_m}\!\!\left(\frac{\lambda}{g}\right)+g k_m\,J_{-k_m}\!\!\left(\frac{\lambda}{g}\right)}{\lambda\, J_{1+k_m}\!\!\left(\frac{\lambda}{g}\right)- g k_m\, J_{1-k_m}\!\!\left(\frac{\lambda}{g}\right)} =\frac{\lambda\, J_{-1-k_m}\!\!\left(\lambda\right)+k_m\, J_{-k_m}\!\!\left(\lambda\right)}{k_m\, J_{k_m}\!\!\left(\lambda\right)-\lambda\, J_{1+k_m}\!\!\left(\lambda\right)}\,.$$
We eventually find
$$\frac{M(t)}{M_0}=\text{e}^{-\frac{t}{T_2}}\frac{g^2}{1-g^2}\sum\limits_{m=0}^{\infty}\sum\limits_{n=0}^{\infty} f_{nm}^2 N_{nm}\text{e}^{-\frac{\lambda_{nm}^2+\text{i}\bar{\tau}c_3}{\bar{\tau}}t}\,$$
with $$$\bar{\tau}=R^2/D$$$ as well as expansion coefficients
$$$f_{nm}=\frac{2 A_0^{(2m)}}{R^2 N_{nm}} [H(k_m,\lambda_{nm})-H(-k_m,\lambda_{nm})]$$$ with
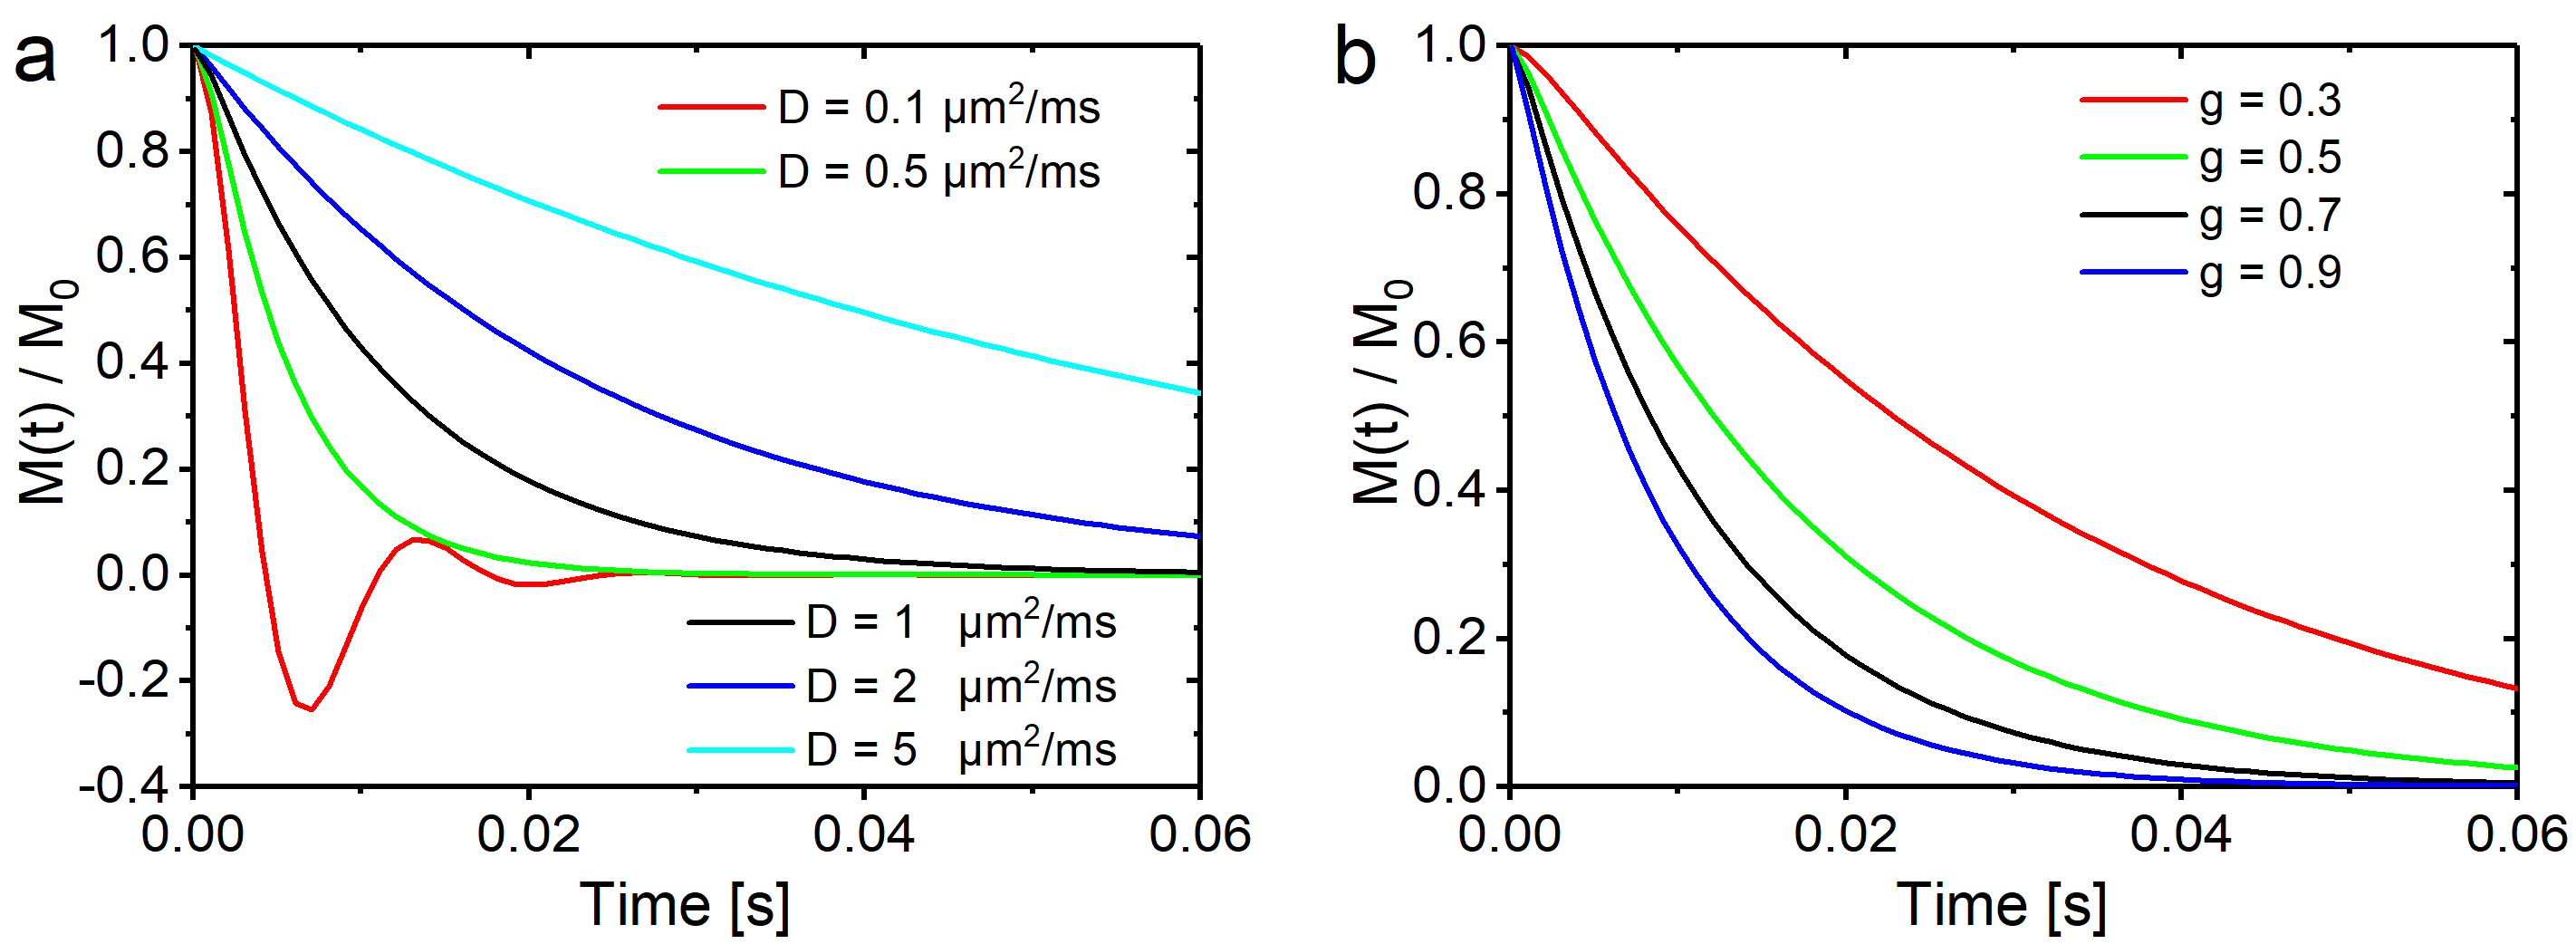
$$H(x,y)=y^{-x}2^{1+x}R\,\Gamma(1+x)\frac{y J_{x-1}(y)-x J_{x}(y)}{2-x}\left[g^2\, _1\!F_2\left(1-\frac{x}{2};1-x,2-\frac{x}{2};-\frac{y^2}{4}\right)-g^x\, _1\!F_2\left(1-\frac{x}{2};1-x,2-\frac{x}{2};-\frac{y^2}{4 g^2}\right) \right]$$ and a determining equation for $$$N_{nm}$$$ that proved too extensive for this abstract. The influence of diffusion strengths and $$$g$$$-factors on the myelin signal decay is shown in Fig. 2 for $$$R=1\,\mu\text{m}$$$, $$$D=1\,\mu\text{m}^2\text{s}^{-1}$$$, and $$$g=0.7$$$ while either varying $$$D$$$ (Fig. 2a) or $$$g$$$ (Fig. 2b); ($$$B_0=3\,\text{T}$$$, $$$\Delta\chi=-0.2\,10^{-6}$$$ 6, $$$c_1=1000$$$ 10, and $$$c_3=0$$$).
While low diffusion values lead to pronounced and characteristic oscillations in the signal decay, the opposite is true for strong diffusion effects. For intermediate diffusion effects, the $$$g$$$-ratio dependent curves decay faster for $$$g$$$-values that approach 1, i.e. for vanishing myelination. The latter effect may be of use for the quantification of demyelinating diseases such as encephalomyelitis disseminata.
Conclusion
The inclusion of diffusion effects into the myelin compartment model that incorporates myelin anisotropy may serve as a basis to simulate and predict myelination and demyelination patterns as inferred from MR signal decay, not only in the physiological state, but also in growth and disease. It needs to be evaluated if pathological decay signatures may correlate with disease severity and/or outcome.
Acknowledgements
F.T. Kurz was supported by a grant from the German Research Foundation (DFG KU 3555/1-1) and the Hoffmann-Klose foundation of Heidelberg University Hospital.References
1. Fukunaga M, Li TQ, van Gelderen P, de Zwart JA, Shmueli K, Yao B, Lee J, Maric D, Aronova MA, Zhang G, Leapman RD, Schenck JF, Merkle H, Duyn JH. Layer-specific variation of iron content in cerebral cortex as a source of MRI contrast. Proc. Natl. Acad. Sci. USA. 2010;107:3834-3839.
2. Liu C, Li W, Johnson GA, Wu B. High-field (9.4 T) MRI of the brain dysmyelination by quantitative mapping of magnetic susceptibility. Neuroimage. 2011;45:930-938.
3. Lodygensky GA, Marques JP, Maddage R, Perroud E, Sizonenko SV, Huppi PS, Gruetter R. In vivo assessment of myelination by phase imaging at high magnetic field. Neuroimage. 2012;59:1979-1987.
4. He X, Yablonskiy DA. Biophysical mechanisms of phase contrast in gradient echo MRI. Proc. Natl. Acad. Sci. USA. 2009;106:13558-13563.
5. Duyn JH, van Gelderen P, Li TQ, de Zwart JA, Koretsky AP, Fukunaga M. High-field MRI of brain cortical substructure based on signal phase. Proc. Natl. Acad. Sci. USA. 2007;104:11796-11801.
6. Sukstanskii AL, Yablonskiy DA. On the role of neuronal magnetic susceptibility and structure symmetry on gradient echo MR signal formation. Magn Reson Med. 2014;71:345-353.
7. Yablonskiy DA, Sukstanskii AL. Biophysical mechanisms of myelin-induced water frequency shifts. Magn Reson Med. 2014;71:1956-1958.
8. Torrey HC. Bloch equations with diffusion terms. Phys Rev. 1956;104:563-565.
9. Ziener CH, Kampf T, Reents G, Schlemmer HP, Bauer WR. Spin dephasing in a magnetic dipole field. Phys Rev E. 2012;85:051908.
10. Chen WC, Foxley S, Miller KL. Detecting microstructural properties of white matter based on compartmentalization of magnetic susceptibility. Neuroimage. 2013;70:1-9.
Figures