5499
In vivo high-field myelin water imaging: Investigating the T2 distribution at 7T1Physics and Astronomy, University of British Columbia, Vancouver, BC, Canada, 2UBC MRI Research Centre, University of British Columbia, Vancouver, BC, Canada, 3Pediatrics, University of British Columbia, Vancouver, BC, Canada, 4Radiology, University of British Columbia, Vancouver, BC, Canada, 5Swedish National 7T MRI Facility, Lund University, Lund, Sweden, 6Medical Radiation Physics, Lund University, Lund, Sweden, 7BC Children's Research Centre, University of British Columbia, Vancouver, BC, Canada
Synopsis
With the increased frequency of human 7T scanners, there is also a drive towards the implementation advanced MR sequences, such a myelin water imaging, at high fields. Here, we demonstrate the feasibility of translating 3T myelin acquisitions scheme, GRASE, to 7T. We studied the distribution of T2 values at 7T and determined that myelin water has a T2<25ms. We obtained excellent agreement for myelin water fraction values in the corpus callosum between 3T and 7T.
Introduction
Myelin water imaging (MWI) opened up new avenues into the investigation of neurodegenerative diseases affected by demyelination. MWI exploits the fact that water molecules trapped between the myelin-phosphoplipid bilayers will exhibit a faster T2 signal decay than intra- or extracellular water[1]. While other techniques such as diffusion tensor imaging have been used as surrogate markers, the specificity of myelin water imaging[2], supported by post-mortem validation[3], has been unprecedented. The 1.5T single-slice CPMG-multi SE acquisition has evolved to allow whole brain MWI in under 10min using a 3D GRASE sequence[4]. With the move to higher field strengths, MWI at 7T is also desirable. The increased signal-to-noise ratio allows for more accurate estimation of the T2 components[5], however, B0 as well as B1 homogeneities will play a larger role and sequence implementation will be challenged by energy-deposition limits. Here, we investigate the details of the T2 distribution of brain tissue at 7T and demonstrate the feasibility of 3D multi-echo spin echo experiments for the assessment of 7T-MW in vivo.Methods
Data were acquired in one healthy volunteer on a 7T Philips Achieva AS using a dual-transmit and 32-channel receive coil as well as on a 3T Philips Achieva with an 8-channel head coil. The current 32-echo GRASE implementation, which uses a series of slab-selective refocusing pulses after a 90 excitation pulse and incorporates crusher gradients along Gz as well as non-selective composite 180 refocusing pulses[4,6,7], was chosen to reduce SAR. Sequence parameters were closely matched between field strengths (TE=n*10ms, EPI=3, 40 over-contiguous slices of 2.5mm, 0.96x0.96mm2 resolution, SENSE=2 (left-right)). To compensate for higher RF-energy deposition, TR was increased from 1000ms (3T) to 1730ms (7T) at a lowest B1_max of 10μT. Slice oversampling was increased from 130% to 150% at 7T, which increased acquisition time to 27min compared to 14min at 3T and increased bandwidth at 7T (37.5kHz; 34.9 kHz at 3T). Image acquisition with EPI factor 5 were also tested, parameters are given alongside the MWF maps. The MW fraction was estimated using a non-negative least squares fitting procedure, which estimated the logarithmic T2 distribution after correction for stimulated echoes[10]. The integral over the short T2 peak, i.e. MW, was divided by the integral over the whole T2 distribution, i.e. the total water content in the voxel.Results
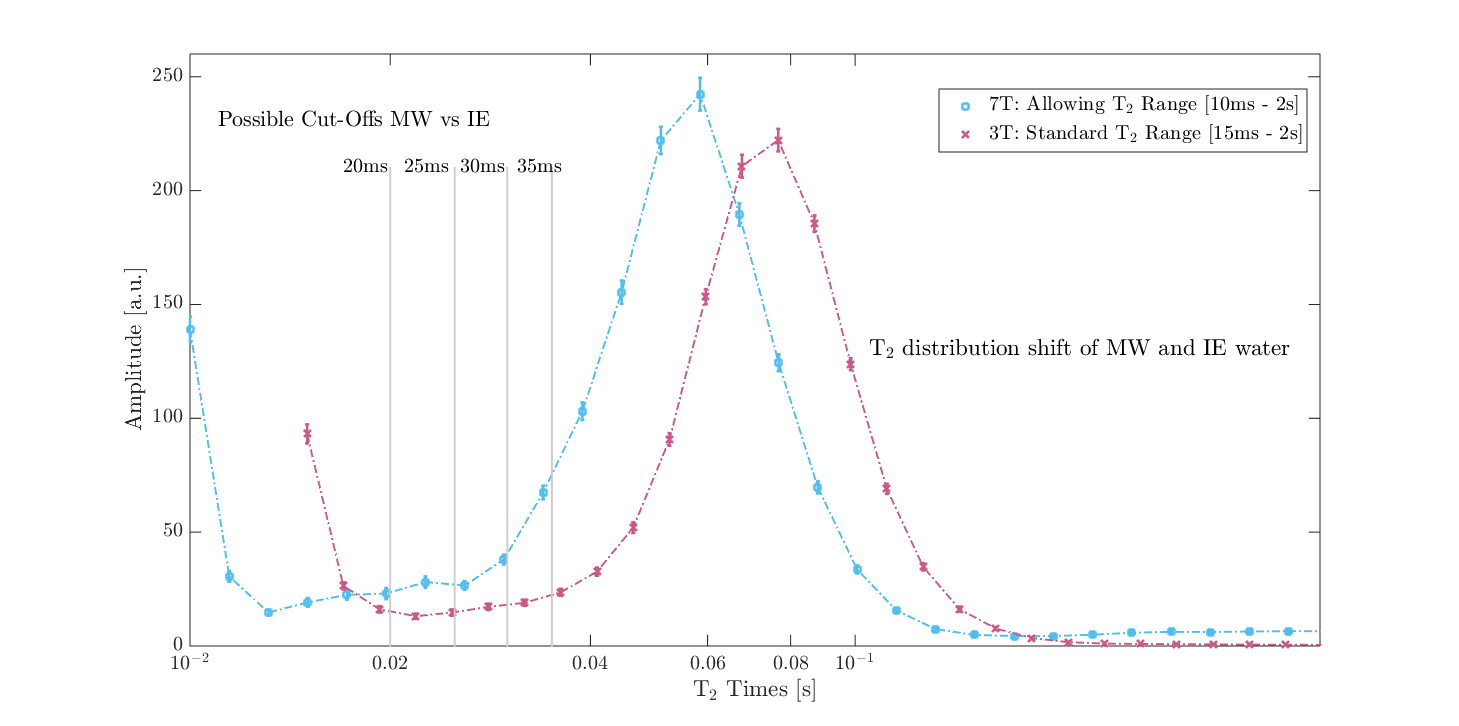
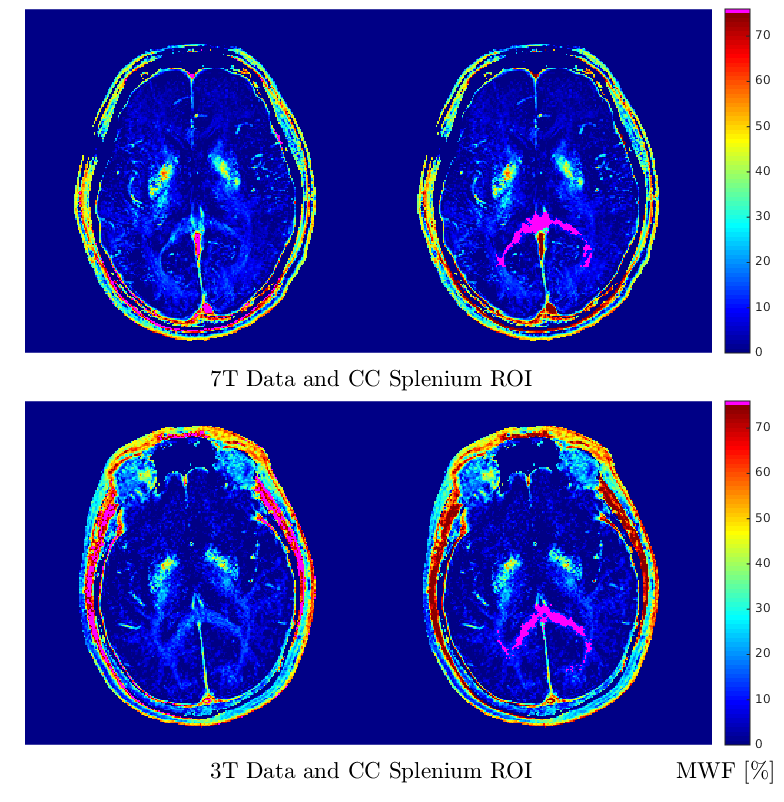
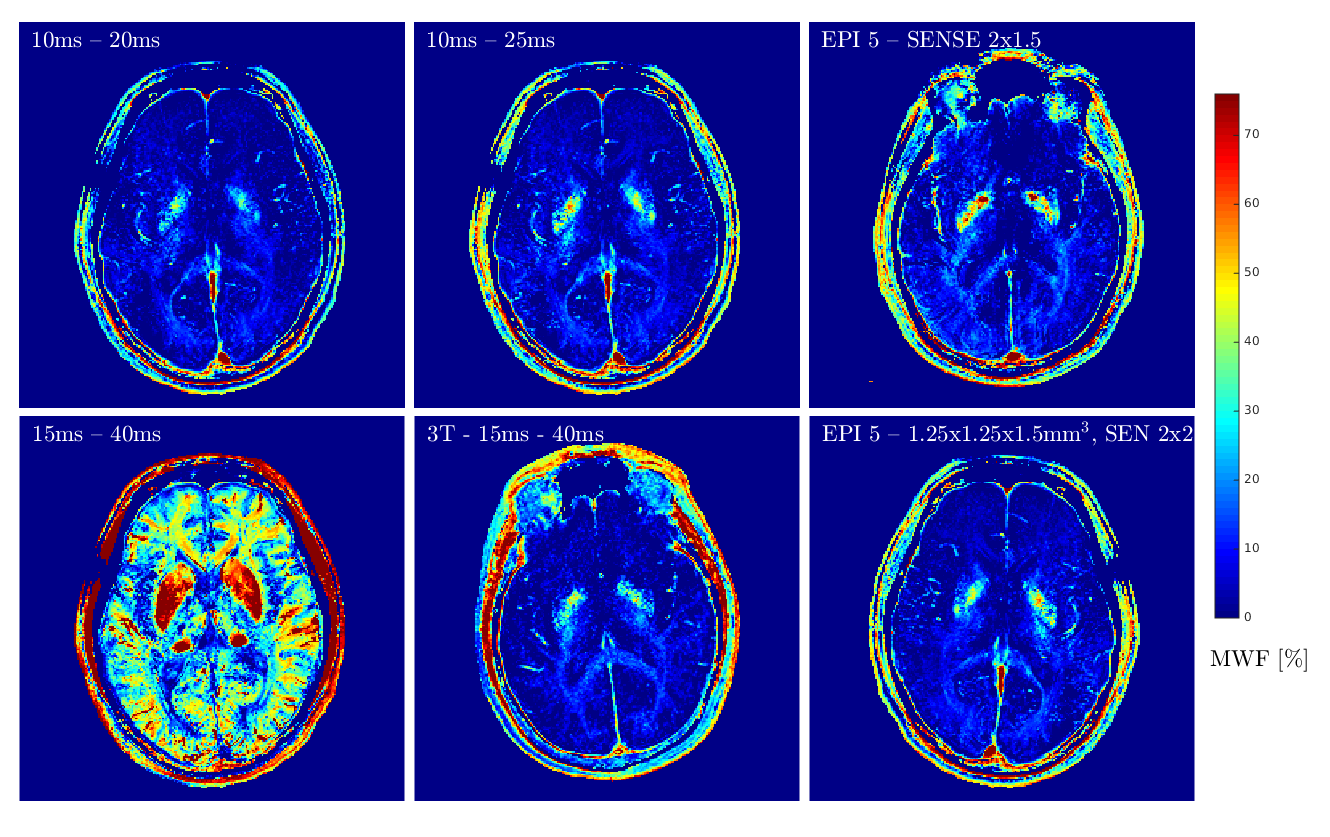
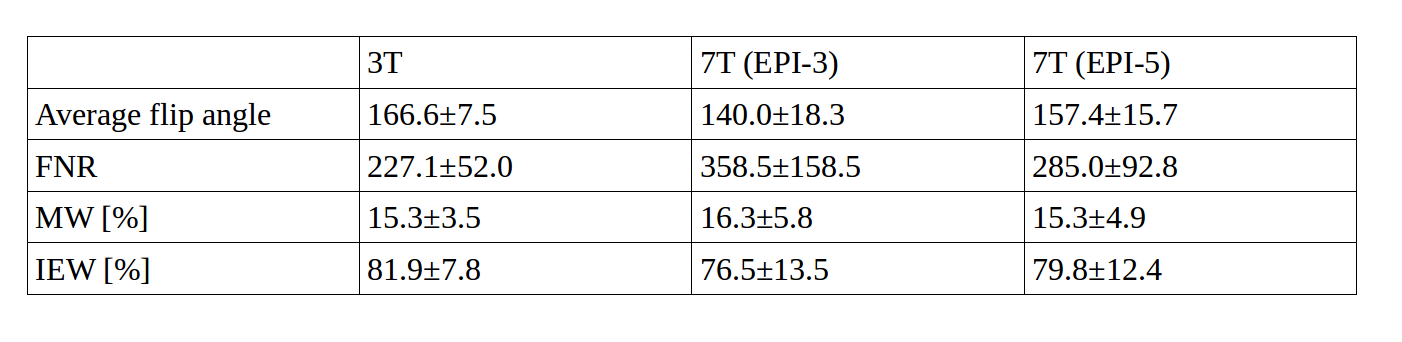
The T2 distributions obtained at 3T and 7T are compared in Figure 1. The distributions represent the average from all voxels within one slice of the splenium of the corpus callosum (Fig. 2). Regions were visually matched, not co-registered. The intermediate T2 peak, corresponding to intra/extracellular (IE) water, was shifted to shorter T2 times as expected for higher magnetic fields. The in vivo IEW T2 at 7T was centered approximately at 50ms, with a range of 25-100ms, compared to 75ms and a range of 40-120ms at 3T. It seems clear that the cut-off, which was set to 40ms at 3T to differentiate MW from IEW, should be around 25ms at 7T. This is represented in Figure 3, where the resulting MW maps are compared for various T2 ranges. As suggested by the T2 distributions, images that separate MW and IE water based on a 25ms cut-off produce MWF maps comparable to the myelin map obtained at 3T, for EPI factors 3 and 5. For comparison, the average flip angle, fit-to-noise (FNR), MWF and IEW fraction are listed in Table 1. Note that the estimated myelin fraction is slightly higher at 7T, either due to small differences in ROI location, or possibly due to higher SNR or differences in B1+.Discussion
Our observation of shorter MW and IE T2 values at 7T is in agreement with post-mortem single-slice MWI at 7T[9]. This study reported a MW-T2 of <20ms for the fixed tissue, which is shorter than we observed in vivo. Notably, the authors suggested that the shortening is due to field strength alone, unrelated to tissue fixation. The small increase in MW estimates at 7T compared to 3T is in line with the reported differences between 1.5 and 3T MWFs, which scaled by a factor of 1.06 between field strengths in most brain regions[7]. At 7T, the longer T1 is compensated by the increased TR. Using a transmit head coil yields less unwanted excitation inferior to the slab, allowing for undersampling in slice direction for acceleration using SENSE[10] or for encoding thinner slices.Conclusion
We demonstrated that MWI multi-echo GRASE-based acquisition schemes are translatable to 7T, yielding comparable MWF maps without the need for large modifications to the acquisition scheme.Acknowledgements
VW is supported by a graduate studentship award from the Multiple Sclerosis Society of Canada.References
[1] MacKay A., et al. In vivo visualization of myelin water in brain by magnetic resonance, MRM 31, 1994, 673-677.
[2] Alonso-Ortiz E., et al., MRI-based myelin water imaging: A technical review, Magn Reson Med 73, 2015,70-81.
[3] Laule C., et al. Myelin water imaging in multiple sclerosis: quantitative correlations with histopathology. MSJ 12(6), 2006, 747-753.
[4] Prasloski T., et al. Rapid whole cerebrum myelin water imaging using a 3D GRASE sequence, NeuroImage 63, 2012, 533-539.
[5] Graham S.J., et al., Criteria for analysis of multicomponent tissue T2 relaxation data. Magn Reson Med 35, 1996, 370-378.
[6] Poon C.S. and Henkelman R.M., Practical T2 quantification for clinical applications. JMRI 2, 1992, 541-553.
[7] Kolind S., et al. Myelin water imaging: Implementation and development at 3.0T and comparison to 1.5T measurements. Magn Reson Med 62, 2009, 106-115.
[8] Prasloski T., et al. Applications of stimulated echo correction to multicomponent T2 analysis. Magn Reson Med 67, 2012, 1803-1814.
[9] Laule C., et al. Myelin water imaging of multiple sclerosis at 7T: Correlations with histopathology. NeuroImage 40(1), 2008, 1575-1580.
[10] Pruessmann K.P., et al. SENSE: Sensitivity encoding for fast MRI. Magn Reson Med 42, 1999, 952-962.
Figures