5498
The Effect of Range of Echo Time on Gradient Echo Based Myelin Water Fraction Mapping1Yonsei University, Seoul, Republic of Korea, 2Seoul St. Mary's Hospital, College of Medicine, The Catholic University of Korea, Seoul, Republic of Korea
Synopsis
Recently, myelin water fraction has been investigated using mGRE data. The purpose of this study is to investigate effects of the range of TE in GRE based MWF using different three fitting models. The results of simulation and in-vivo data suggest that complex model can be helpful to overcome bias due to susceptibility anisotropy compared to magnitude based models.
Introduction
Recently, myelin water fraction (MWF) has been investigated using multi-echo GRE (mGRE) data1-3. Since MWF is a quantitative imaging technique, it is important that the MWF is consistent with respect to scan parameter changes. However, since susceptibility anisotropy progressively affects the signal according to TE, resulting MWF may be different depending on range of TE. In this study, we aimed to the effects of the range of TE in GRE based MWF using different models.Methods
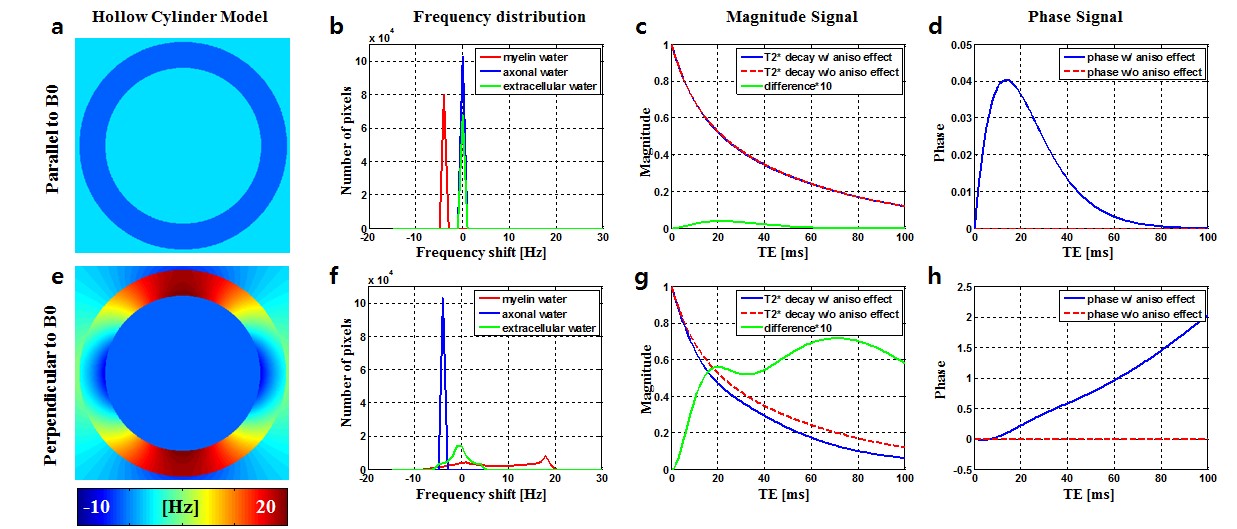
[Simulation] A series of Monte Carlo simulations (300 repetitions for each case) were performed to test the bias and noise performance of MWF estimation with respect to the range of TE. Simulations were carried out within a 100 ms range of TE. A hollow cylinder fiber model was used for the simulation4 with the following parameters: volume fraction for the myelin, axon, and extra-cellular space were 32%, 41%, and 27% respectively, with g-ratio of 0.75. Water compartment of myelin volume set to be 40%5, and for axonal or extra-cellular space set to 85%. Consequently, the fractional contribution to the total water signal for the myelin, axon, and extra-cellular space were 18%, 49%, and 33%, respectively. Isotropic susceptibility of -0.13 ppm and anisotropic susceptibility of -0.15 ppm were used6. Frequency shifts were calculated using the formula in Table1 of Ref 4. Fig. 1 shows the parallel and perpendicular examples of frequency shift of simulation data using the hollow cylinder model. T2* components were generated for myelin water, axonal water, and extra-cellular water with relaxation times 10ms, 64ms, 48ms1. Complex signal evolution was performed with the effect of hollow cylinder model for four different orientations. Complex Gaussian noise was added to the simulated signal for SNR of 300. Water exchange and diffusion effects were not considered in this simulation.
[Data acquisition] Data from four healthy volunteers were acquired on a clinical 3 Tesla MRI scanner (Tim Trio, Siemens Medical Solution, Erlangen, Germany) using a 12-channel head coil for signal reception. The 3D mGRE data were acquired for the MWF mapping. The imaging parameters were as follows: TR = 120 ms, flip angle = 30°, field of view = 256 × 256 × 88 mm3, spatial resolution = 2 × 2 × 2 mm3. To test the effect of range of echo times onto MWF, 80 echoes were acquired; first TE = 1.6 ms, echo spacing = 1 ms, Last TE = 84 ms. Additionally, MPRAGE and diffusion tensor imaging (DTI) was obtained to determine the structure and fiber orientation information.
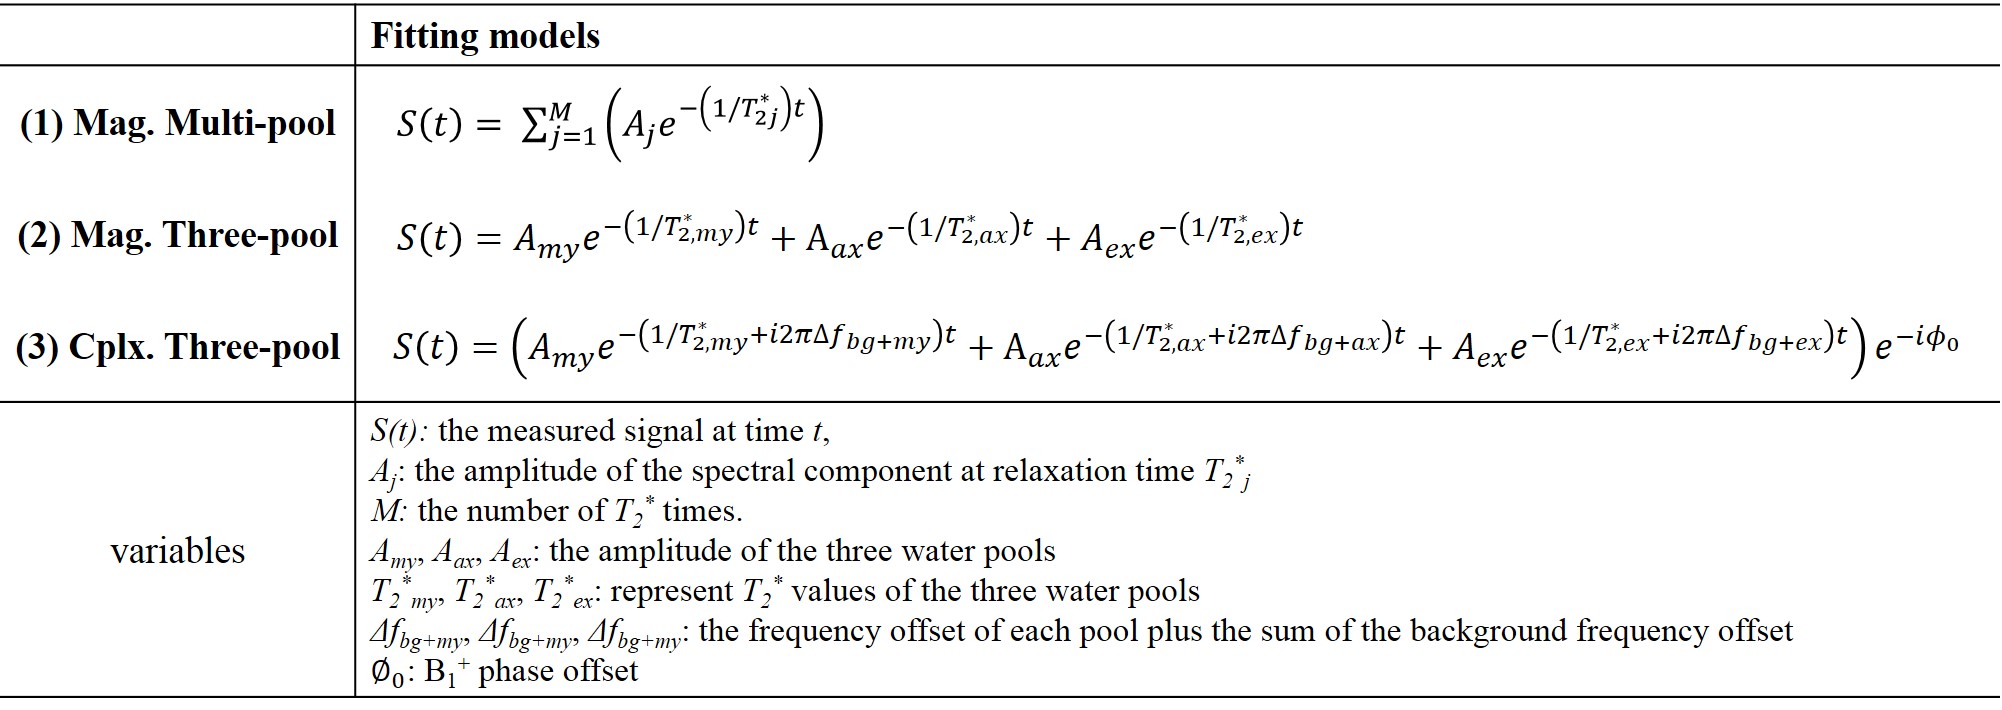
[Data Processing] Three different fitting models are used and analyzed in this study (table 1); magnitude multi-component model (eqn.1), magnitude three-component model (eqn.2), and complex three-component model (eqn.3). For magnitude multi-pool model, the rNNLS algorithm was used to estimate the parameters. For both three-pool models, non-linear least squares method was applied. In the simulation, of the complex model was ignored.
Results
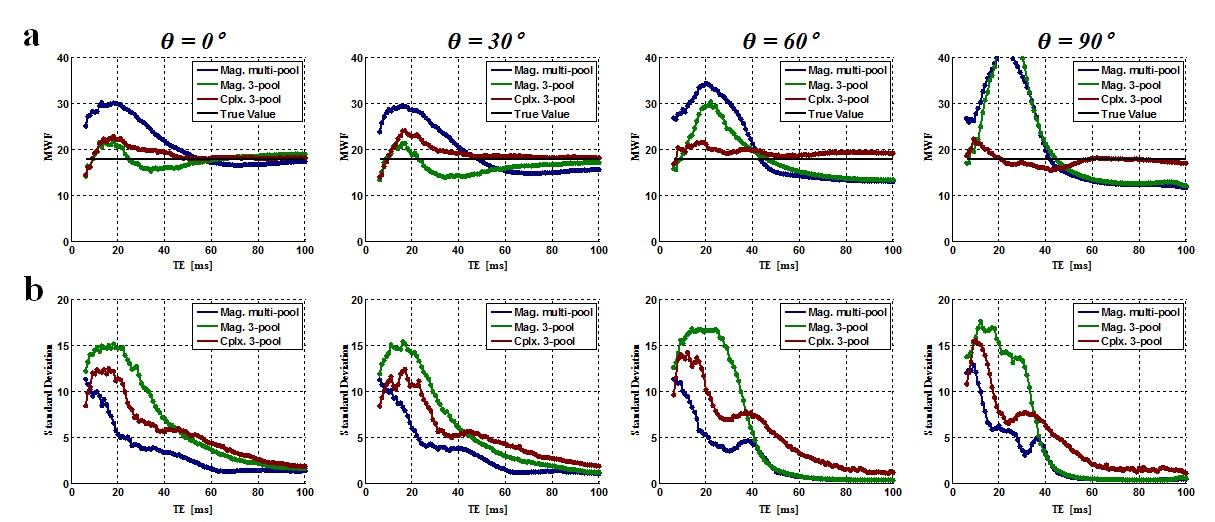
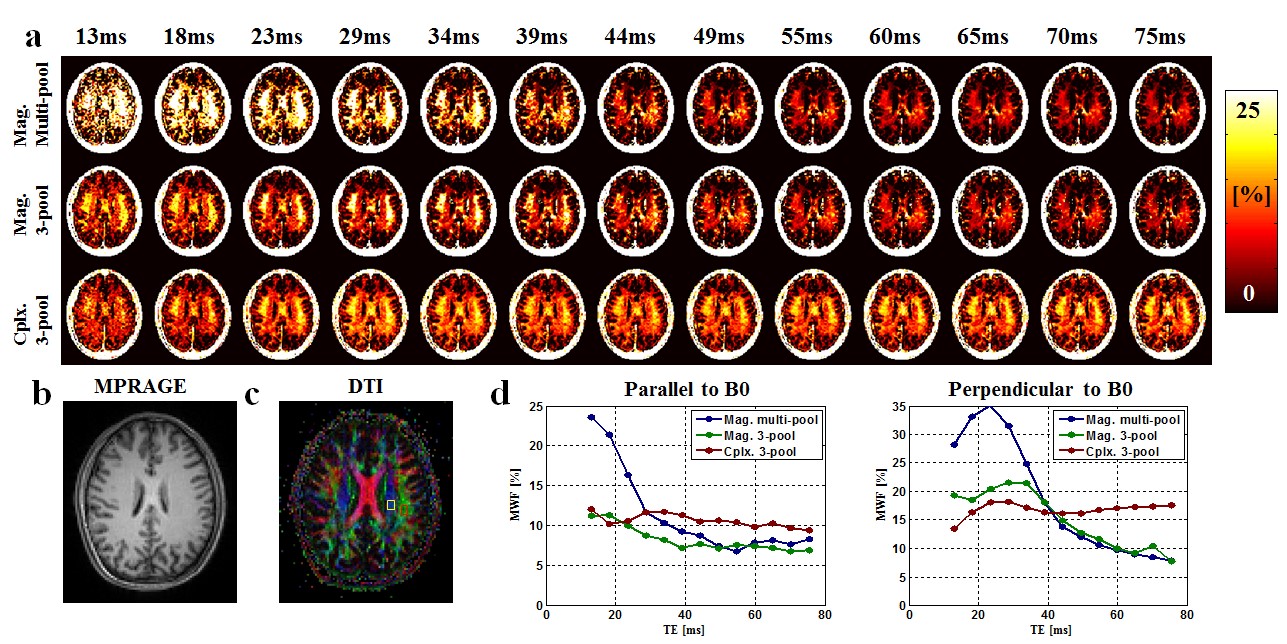
Fig. 2 represents the bias of the estimated MWF values for the different echo length used in the simulation. When fitting to parallel oriented fibers, the variations in the MWF estimations were relatively small for the different methods. However, when fibers were oriented at large angles to B0, there is a bias of the MWF estimation when the magnitude model is used. Both magnitude based models have overestimation when the echo range is relatively small (< 40 ms), and underestimation when the echo range is large (> 40 ms). In contrast, the complex three-component model yields a more consistent result. However, the standard deviation in the estimate is bigger with the complex fitting model (since more unknowns are used). These results demonstrate that complex model fitting is more robust to bias and consistent across the range of TE used for the mGRE data acquisition. Fig. 3 shows representative in-vivo slices of the MWF map derived from magnitude multi-pool, three-pool and complex three-pool model fitting using different range of echoes. The maps are more consistent across the TE range using the complex 3-pool fit, which agrees with the simulations. Fig. 3d shows MWF estimates in a parallel and a perpendicular fiber with B0. The magnitude models show larger variation. On the other hand, the variation was smaller when complex fitting was used.Conclusion
In this study, we demonstrated the effect of range of TE in mGRE based MWF. The results of simulation and in-vivo data suggest that complex model can be helpful to overcome bias due to susceptibility anisotropy compared to magnitude based models.Acknowledgements
This research was supported by Basic Science Research Program through the National Research Foundation of Korea(NRF) funded by the Ministry of Science, ICT and future Planning (NRF-2015R1A2A1A15052174, 2017R1D1A1B03030772)References
1. Nam Y, et al. Improved Estimation of Myelin Water Fraction using Complex Model Fitting. NueroImage, 2015;116:214-221
2. Du YP, et al. Fast multislice mapping of the myelin water fraction using multicompartment analysis of T2* decay at 3T: a preliminary postmortem study. MRM 2007;58(5):865-870
3. Hwang D, et al. In vivo multi-slice mapping of myelin water content using T 2* decay. NeuroImage 2010;52(1):198-204.
4. Wharton S, Bowtell R. Fiber orientation-dependent white matter contrast in gradient echo MRI. PNAS, 2012;109(45):18559-18564.
5. Vandenheuvel FA. Structural studies of biological membranes: The structure of myelin. Annals of the New York Academy of Sciences 1965;122(1):57-76.
6. Liu C. Susceptibility tensor imaging. Magnetic resonance in medicine 2010;63(6):1471-1477.
Figures