5497
Immunohistochemical validation of myelin water fraction obtained with FAST-T2 at 3 Tesla1Weill Cornell Medical College, New York, NY, United States, 2Yale University, New Haven, CT, United States
Synopsis
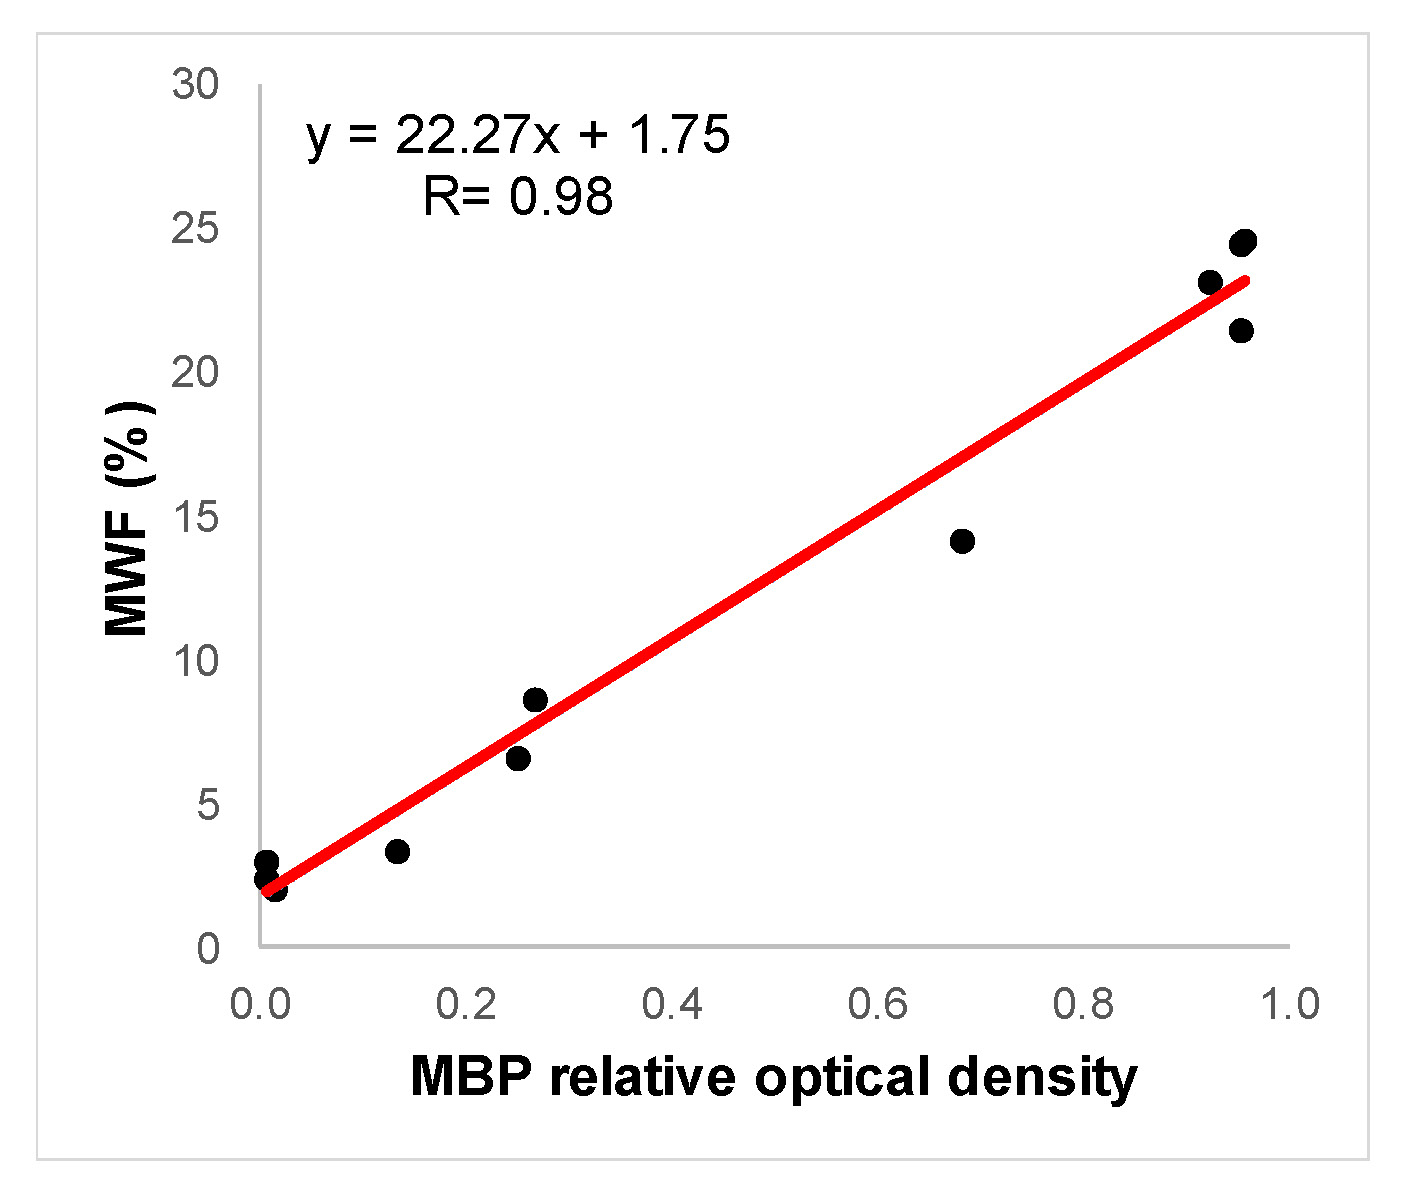
The purpose of this study was to validate MWF measurements obtained by FAST-T2 at 3T by myelin basic protein (MBP) staining in a postmortem brain. Excellent correlation (R=0.98) was found between MWF and MBP relative optical density measurements.
INTRODUCTION
Mapping of myelin loss and repair is highly desired for MS patient monitoring. Multi-component T2 relaxometry can quantify water trapped within the intact myelin sheath (myelin water) as an indirect measure of myelin (1). Myelin water fraction (MWF), defined as the ratio of myelin water and the total water within a voxel, has been shown to correlate highly with Luxol fast blue staining for myelin (R=0.88) in ex vivo MS brain (2). This result was obtained with a 32-echo spin echo (MESE) sequence on a 7T small-bore animal scanner. Recently, Fast Acquisition with Spiral Trajectory and adiabatic T2prep (FAST-T2) has emerged as a fast and robust alternative to MESE. FAST-T2 can provide whole brain MWF mapping in 4 min at 3T with high reproducibility (3). However, this method has never been validated by histopathology. Our objective was to correlate MWF measurements obtained by FAST-T2 on a clinical whole-body 3T scanner with immunohistochemistry in a postmortem brain.METHODS
MRI experiment. Whole brain from an MS patient was extracted and fixed in formalin prior to MRI at 3T on a GE Discovery MR750W scanner using an 8-channel head coil. FAST-T2 images were acquired with 1x1x2 mm3 resolution at 7 nominal echo times of 0, 7.5, 17.5, 27.5, 67.5, 147.5 and 307.5 ms, spiral TE/TR = 0.5/5.5 ms, number of spiral leaves = 48, flip angle = 10°, number of signal averages (NEX) = 9, scan time = 100 min.
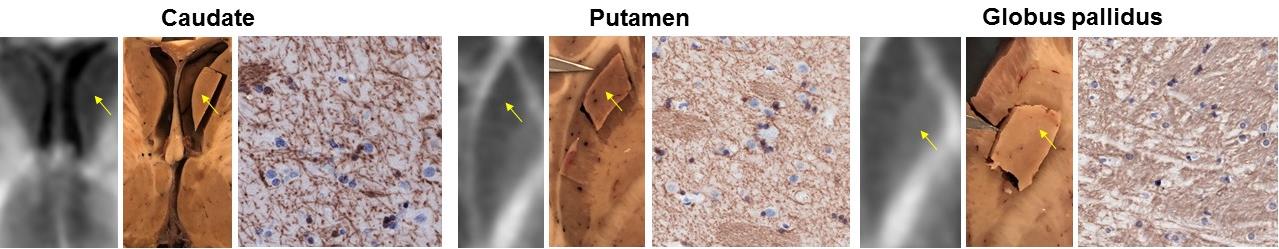
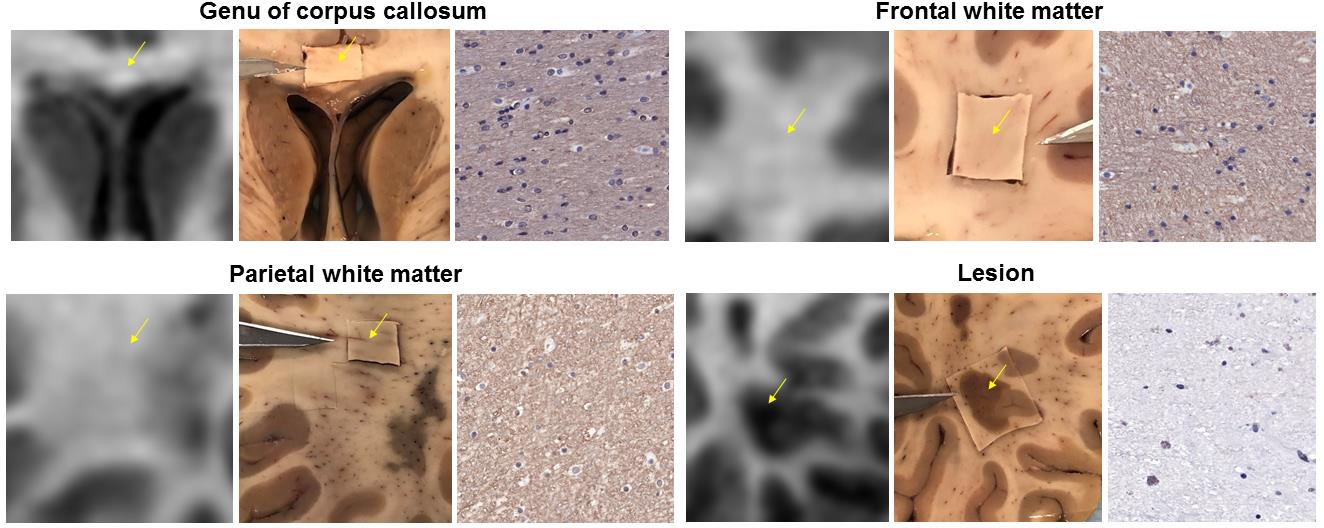
Immunohistochemistry (IHC). Following MRI, brain was sectioned axially based on MRI anatomical images. Tissue samples were cut from WM (genu and splenium of corpus callosum, frontal, and parietal WM) and three GM (caudate head, putamen, and globus pallidus) structures, as well as from four MS lesions (including the surrounding normal appearing WM). Tissue sections were paraffin-embedded, sectioned into 5 µm thick sections, and subjected to antibody labeling against myelin basic protein (MBP) as a tissue marker of myelin. Slides were scanned with a digital scanner (Mirax).
Data analysis. MWF maps were extracted using a spatially constrained 3-pool non-linear least squares algorithm (3). Regional MWF values were obtained based on visual matching of MRI images and photographs of sectioned brain slices (Figs. 1-2). The digitized IHC images were analyzed in ImageJ. At least 5 ROIs were sampled per tissue section. IHC images were deconvolved to separate MBP specific DAB stain from hematoxylin, followed by automatic intensity thresholding to generate a MBP mask. Relative optical density (rOD) of MBP stain was calculated as the ratio of MBP stained area to the total ROI area, which was used as a semi-quantitative measure of myelin. Linear correlation analysis was performed to quantify the association between MWF and rOD measurements.
RESULTS
Figures 1-2 show examples of MWF and MBP images of selected GM and WM structures as well as a demyelinated WM lesion, demonstrating the good visual correlation between MWF and MBP density. Lower MWF values were obtained in the basal ganglia, including caudate head (6.6%), putamen (8.6%) and globus pallidus (14.1%), while WM structures generally have higher MWF (21-25% range). This trend can be seen on MBP images. In the lesion example, MWF was 3.1%, which corresponds with the lack of MBP staining. The correlation between MWF and MBP rOD measurements was found to be excellent (R=0.98) (Fig.3).DISCUSSION
This was the first IHC validation study of MWF measured by FAST-T2 on a whole-body scanner at the clinical field strength of 3T. A major limitation of our study was the relatively large voxel size of MRI acquisition due to SNR limitation, which could lead to overestimation of MWF in small lesions due to partial voxel effect. Despite this technical challenge, our results confirmed previous findings obtained at 7T by Laule et al (2) that MWF measurements show good correlation with histopathology.CONCLUSION
MWF values obtained by FAST-T2 at 3T in a postmortem brain correlate well with MBP staining, which suggests that MWF is a reliable quantitative biomarker of myelin.Acknowledgements
This work was supported in part by grants from the NIH (R01NS090464) and the National MS Society (RG-1602-07671).References
1. MacKay A, Whittall K, Adler J, Li D, Paty D, Graeb D. In vivo visualization of myelin water in brain by magnetic resonance. Magn Reson Med. 1994 Jun;31(6):673-7.
2. Laule C, Kozlowski P, Leung E, Li DK, Mackay AL, Moore GR. Myelin water imaging of multiple sclerosis at 7 T: correlations with histopathology. Neuroimage. 2008 May 1;40(4):1575-80.
3. Nguyen TD, Deh K, Monohan E, Pandya S, Spincemaille P, Raj A, Wang Y, Gauthier SA. Feasibility and reproducibility of whole brain myelin water mapping in 4 minutes using fast acquisition with spiral trajectory and adiabatic T2prep (FAST-T2) at 3T. Magn Reson Med. 2016 Aug;76(2):456-65.
Figures