5496
Dipolar relaxation time (T1D) mapping to assess myelin in vivo1Aix Marseille Univ, CNRS, CRMBM UMR 7339, Marseille, France, 2Aix Marseille Univ, CNRS, ICR UMR 7273, Marseille, France, 3Department of Radiology, Division of MR Research, Beth Israel Deaconess Medical Center, Harvard Medical School, Boston, MA, United States
Synopsis
The dipolar relaxation time (T1D) is related to motion restricted molecules and could be used to assess myelin molecular dynamics associated with physiopathology processes. T1D was measured with the inhomogeneous magnetization transfer (ihMT). T1D maps were obtained from in-vivo mouse brain and from ex-vivo rat spinal cord at different temperatures. T1D was approximately 5ms in brain and 1.8ms in muscle. T1D in spinal cord was doubled from 26°C to 37°C, reflecting changes in molecular dynamics caused by the temperature rise. Measuring T1D in-vivo could give information about the myelin membrane structure altered in neurological disorders.
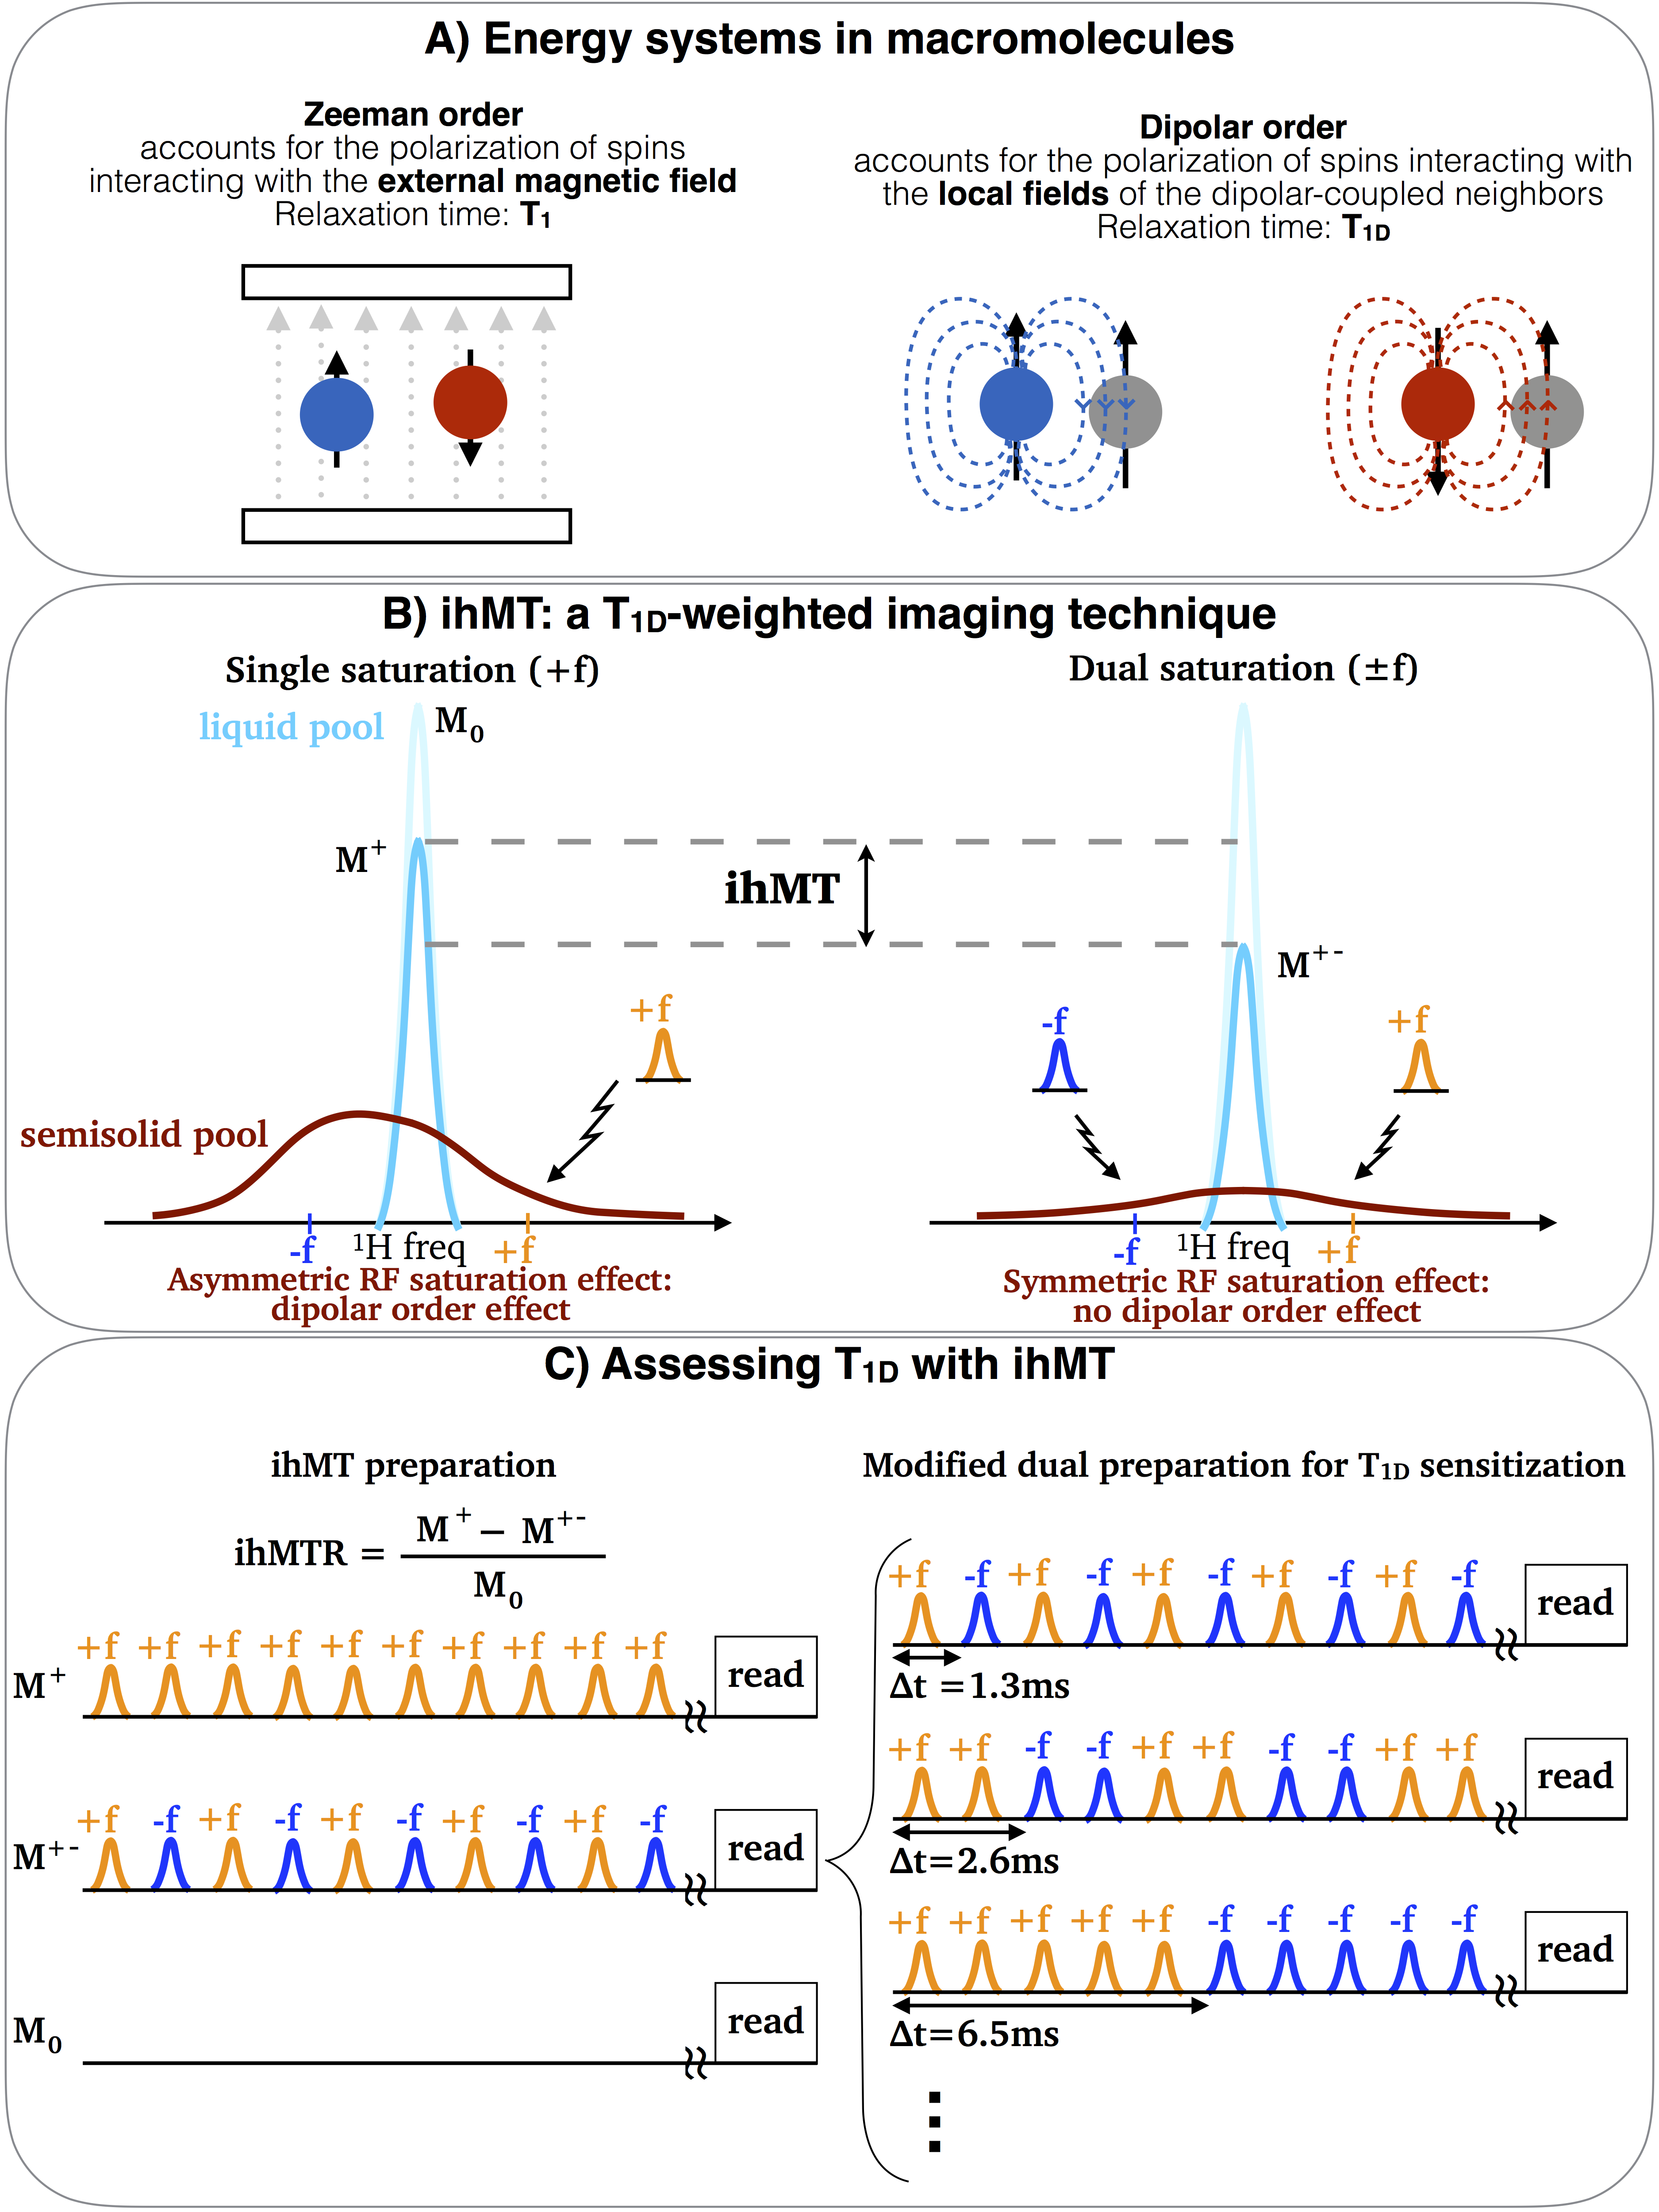
Dipolar relaxation time (T1D) and inhomogeneous magnetization transfer (ihMT)
In-vivo myelin biomarkers are very important for better understanding normal myelination and neurological disorders such as Multiple Sclerosis [1]. The dipolar order relaxation time (T1D) can provide information about motionally restricted molecules such as lipid bilayers that cannot be obtained with the usual Zeeman relaxation time (T1) [2-3]. Myelin is made of compact lipid bilayers hence making T1D a potential marker for changes in myelin molecular dynamics associated with physiopathological processes. However, the standard method to measure T1D, the Jeener-Broekaert sequence [4-6], used in solid-state NMR, is not suitable for in-vivo applications.
The inhomogeneous magnetization transfer (ihMT) (Fig. 1) has shown high selectivity to myelin [7-10]. IhMT and dipolar order are intrinsically linked [11]: the dipolar order corresponds to the selective attenuation of one side of the semisolid pool resonance line and may be generated with high power single frequency RF saturation. T1D can be understood as the relaxation time for equilibrating the magnetization across the semisolid line (Fig.1B). Therefore, ihMT is a T1D-weighted technique that allows assessing the dipolar order effects in-vivo.
A modification of the ihMT sequence was proposed in [12] to enable T1D measurements. By varying the switching time, ∆t, between the frequency-alternated RF pulses of the dual frequency saturation, the ihMT ratio (ihMTR) decays according to T1D, allowing for T1D fitting. Besides T1D, a normalization factor, $$$A = 0.5*ihMTR(∆t = 0)$$$, is also adjusted. Figure 1 summarizes the key concepts regarding dipolar order, ihMT and the modified ihMT.
In this work, T1D maps were built from both in-vivo mouse brain and ex-vivo rat spinal cord at different temperatures using the modified ihMT sequence.
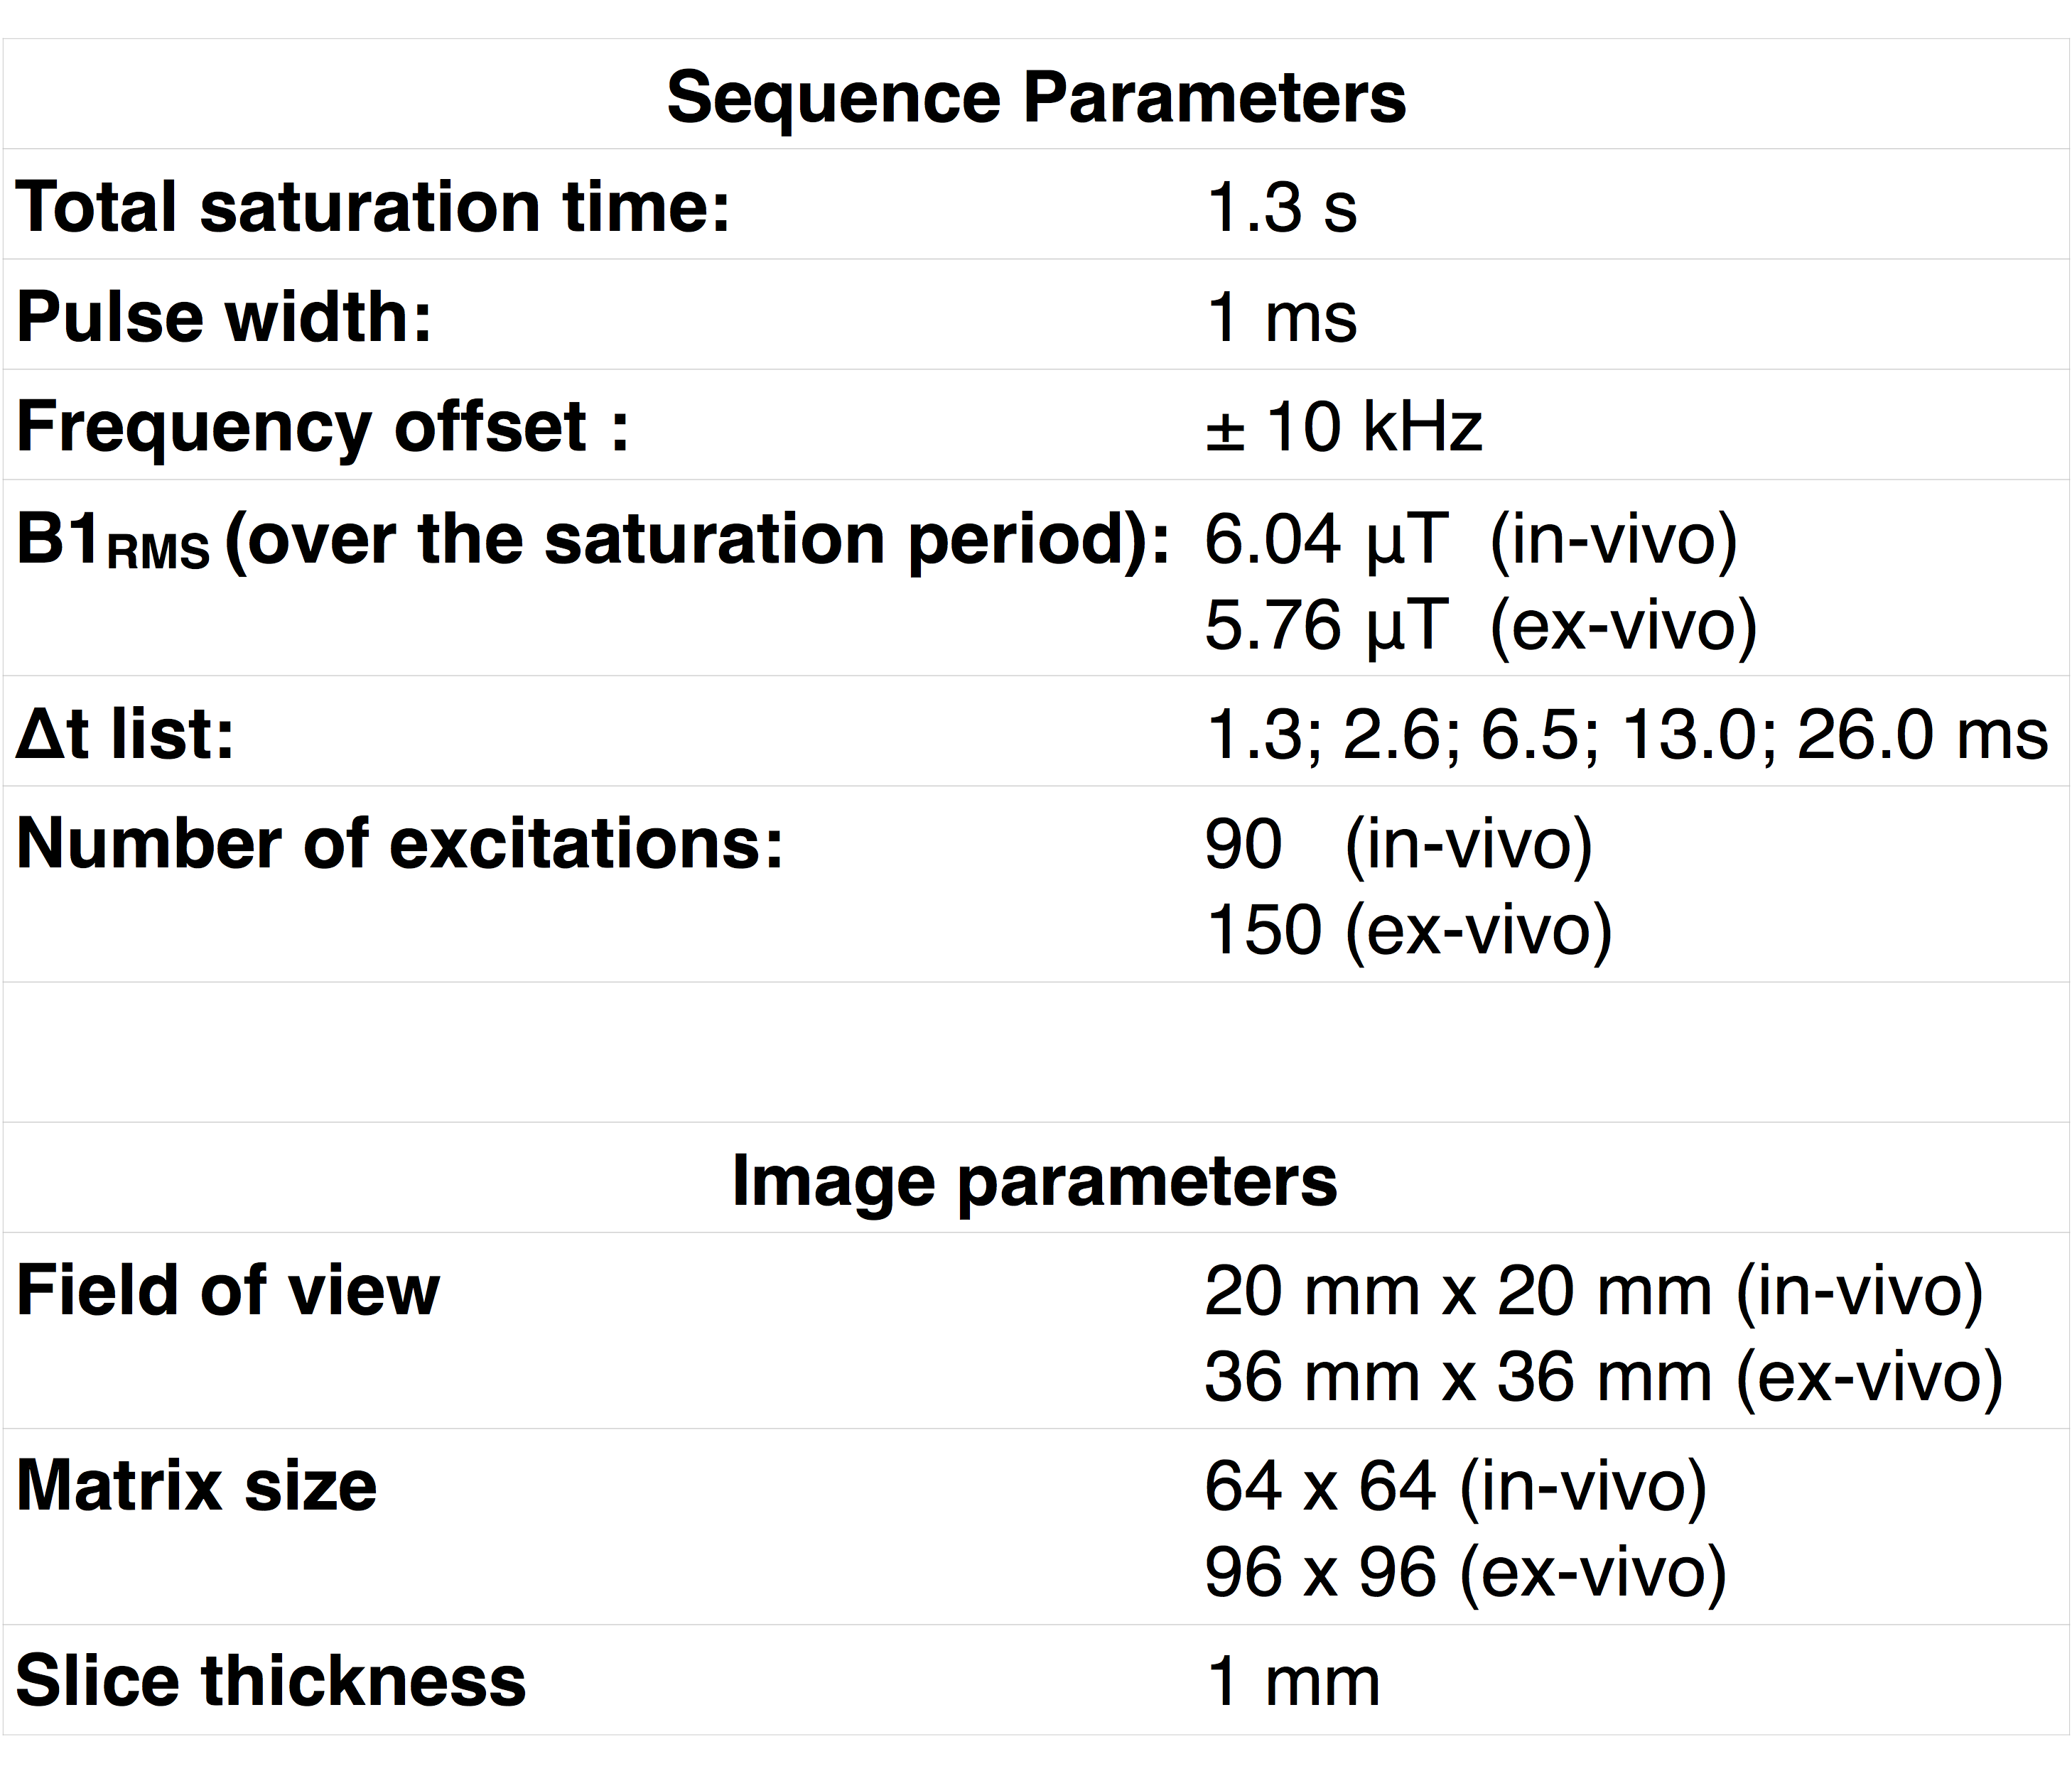
Experimental parameters
In-vivo T1D measurements were performed on two male mice (28g, 5 months). Ex-vivo measurements were taken in excised rat spinal cord maintained at 26°C and 37°C. All experiments were performed on a 11.75 T vertical bore MRI scanner (Bruker Avance, Ettlingen, Germany) with a 20 mm transmit/receive volume bird-cage coil. The parameters used for image acquisition are listed in Table 1. The modified ihMT sequence was used and T1D was estimated by fitting the ihMTR data according to [12].In-vivo T1D maps
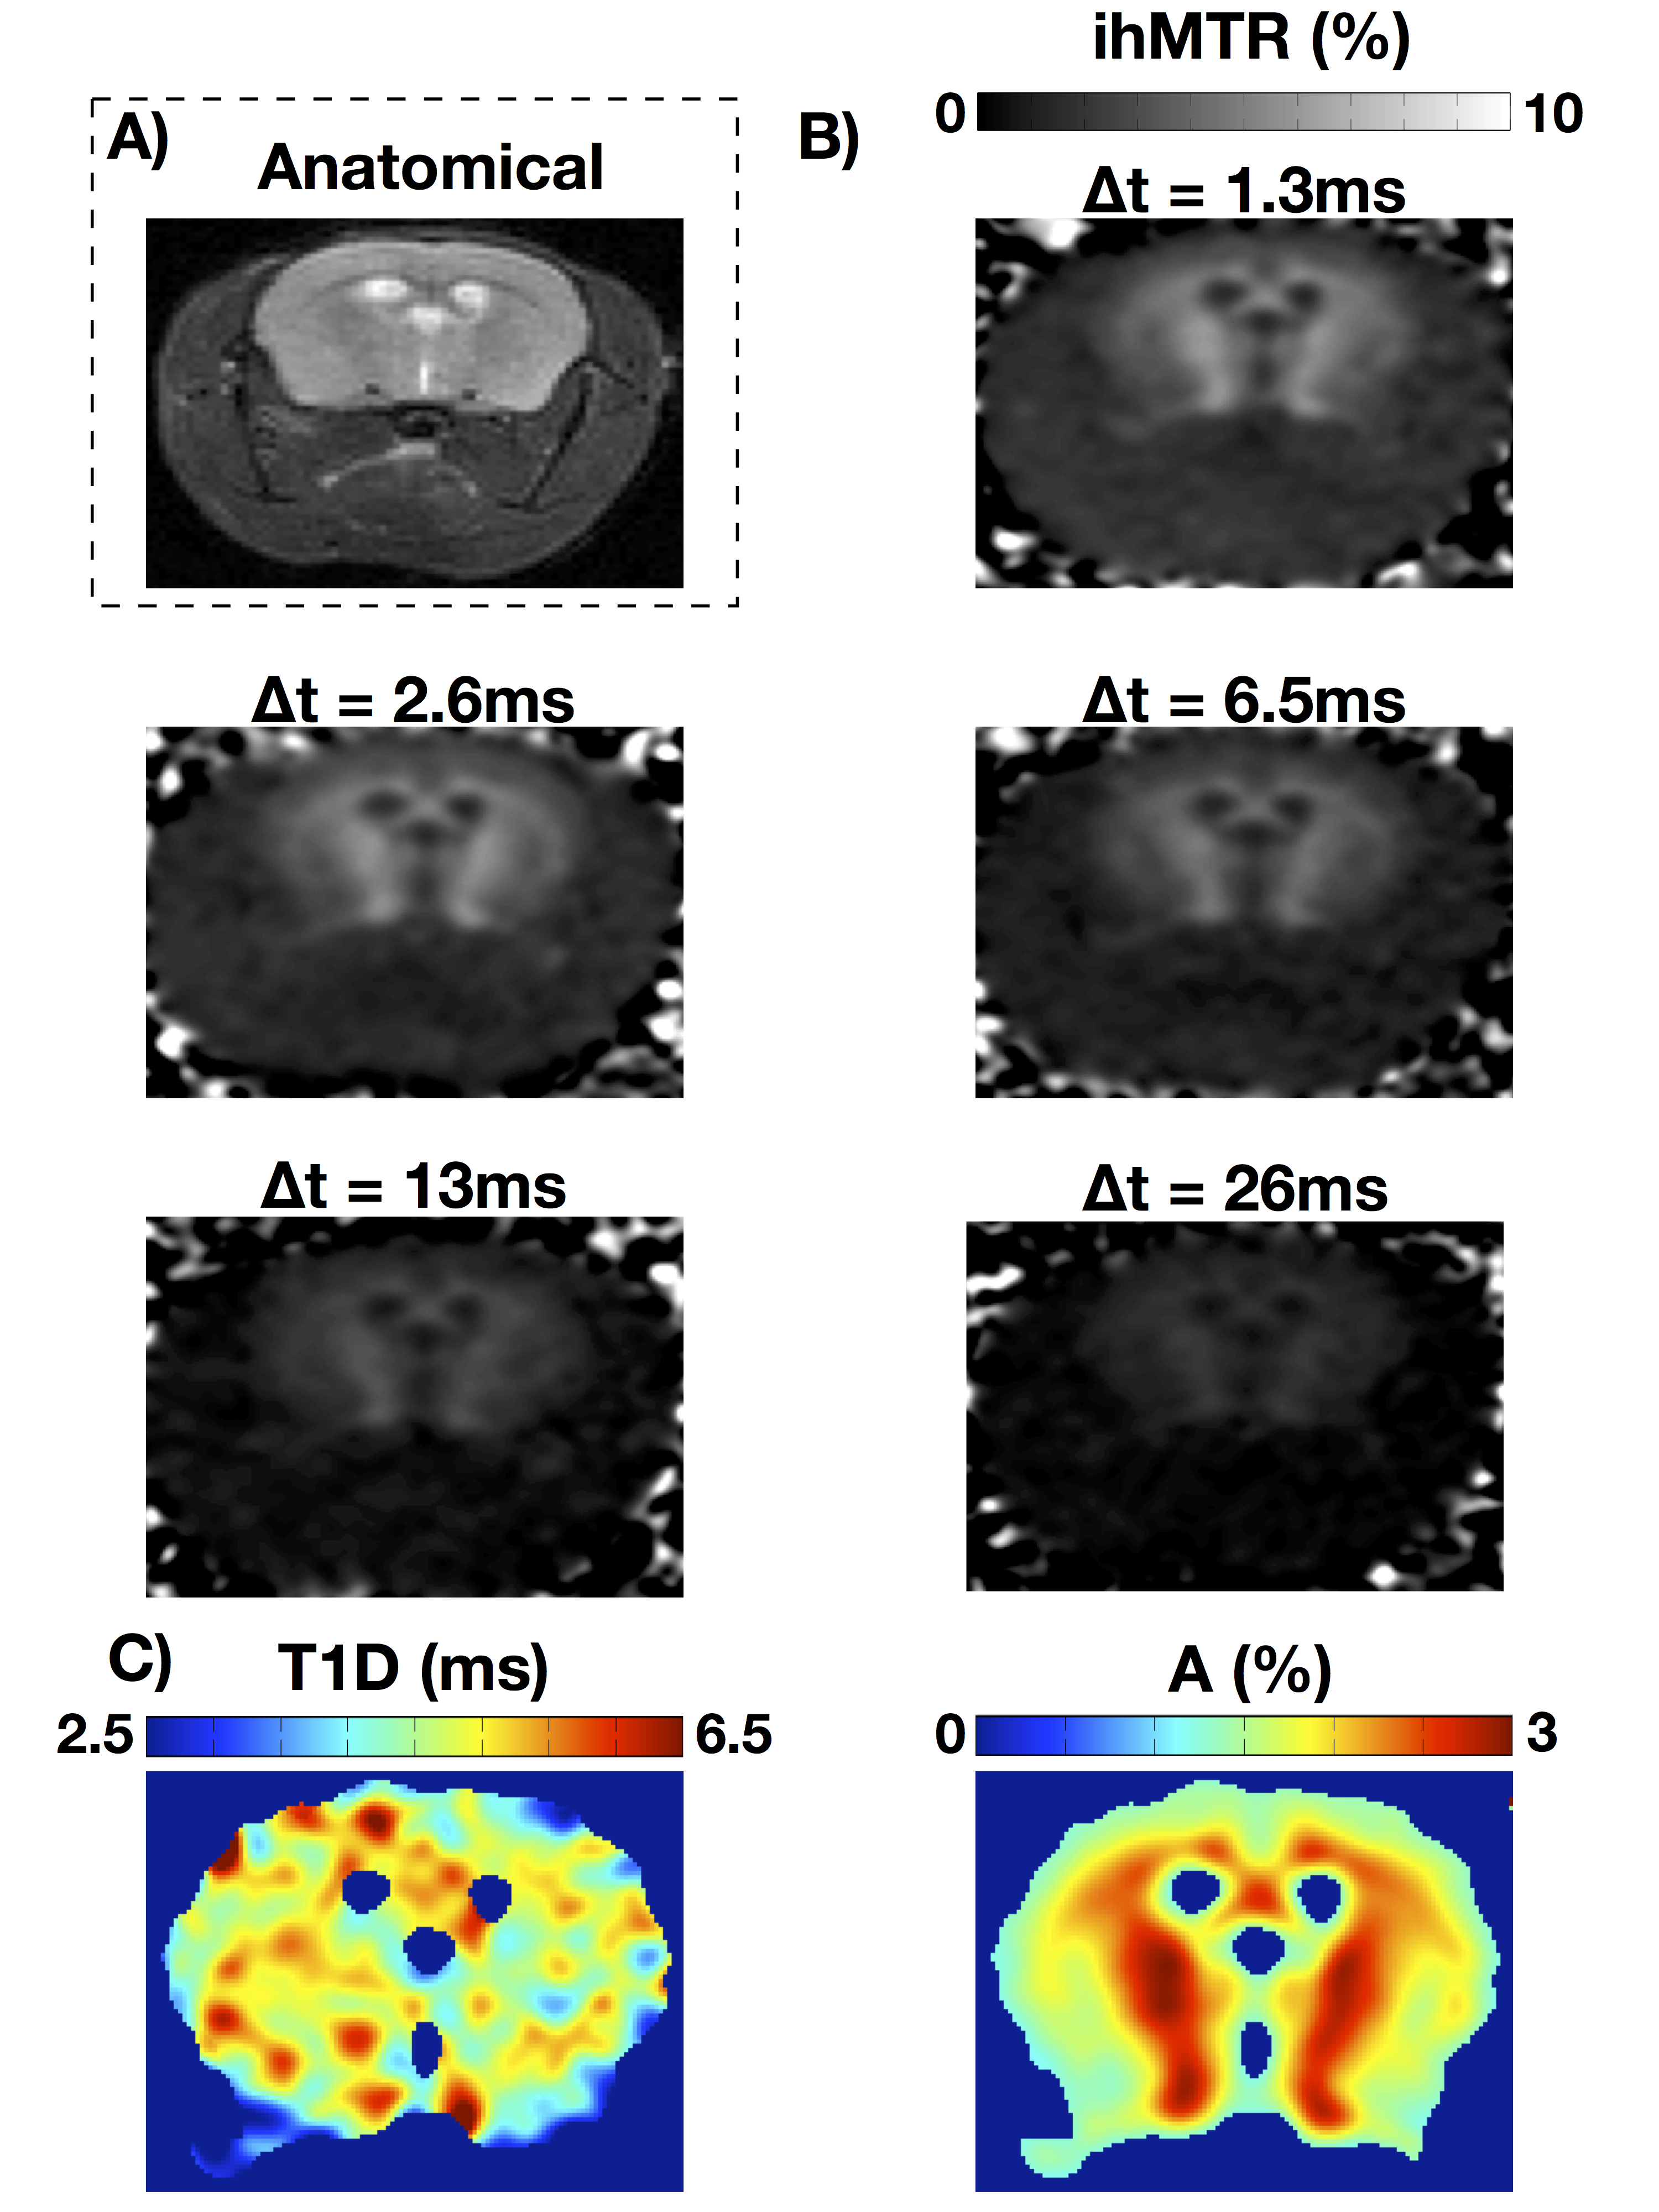
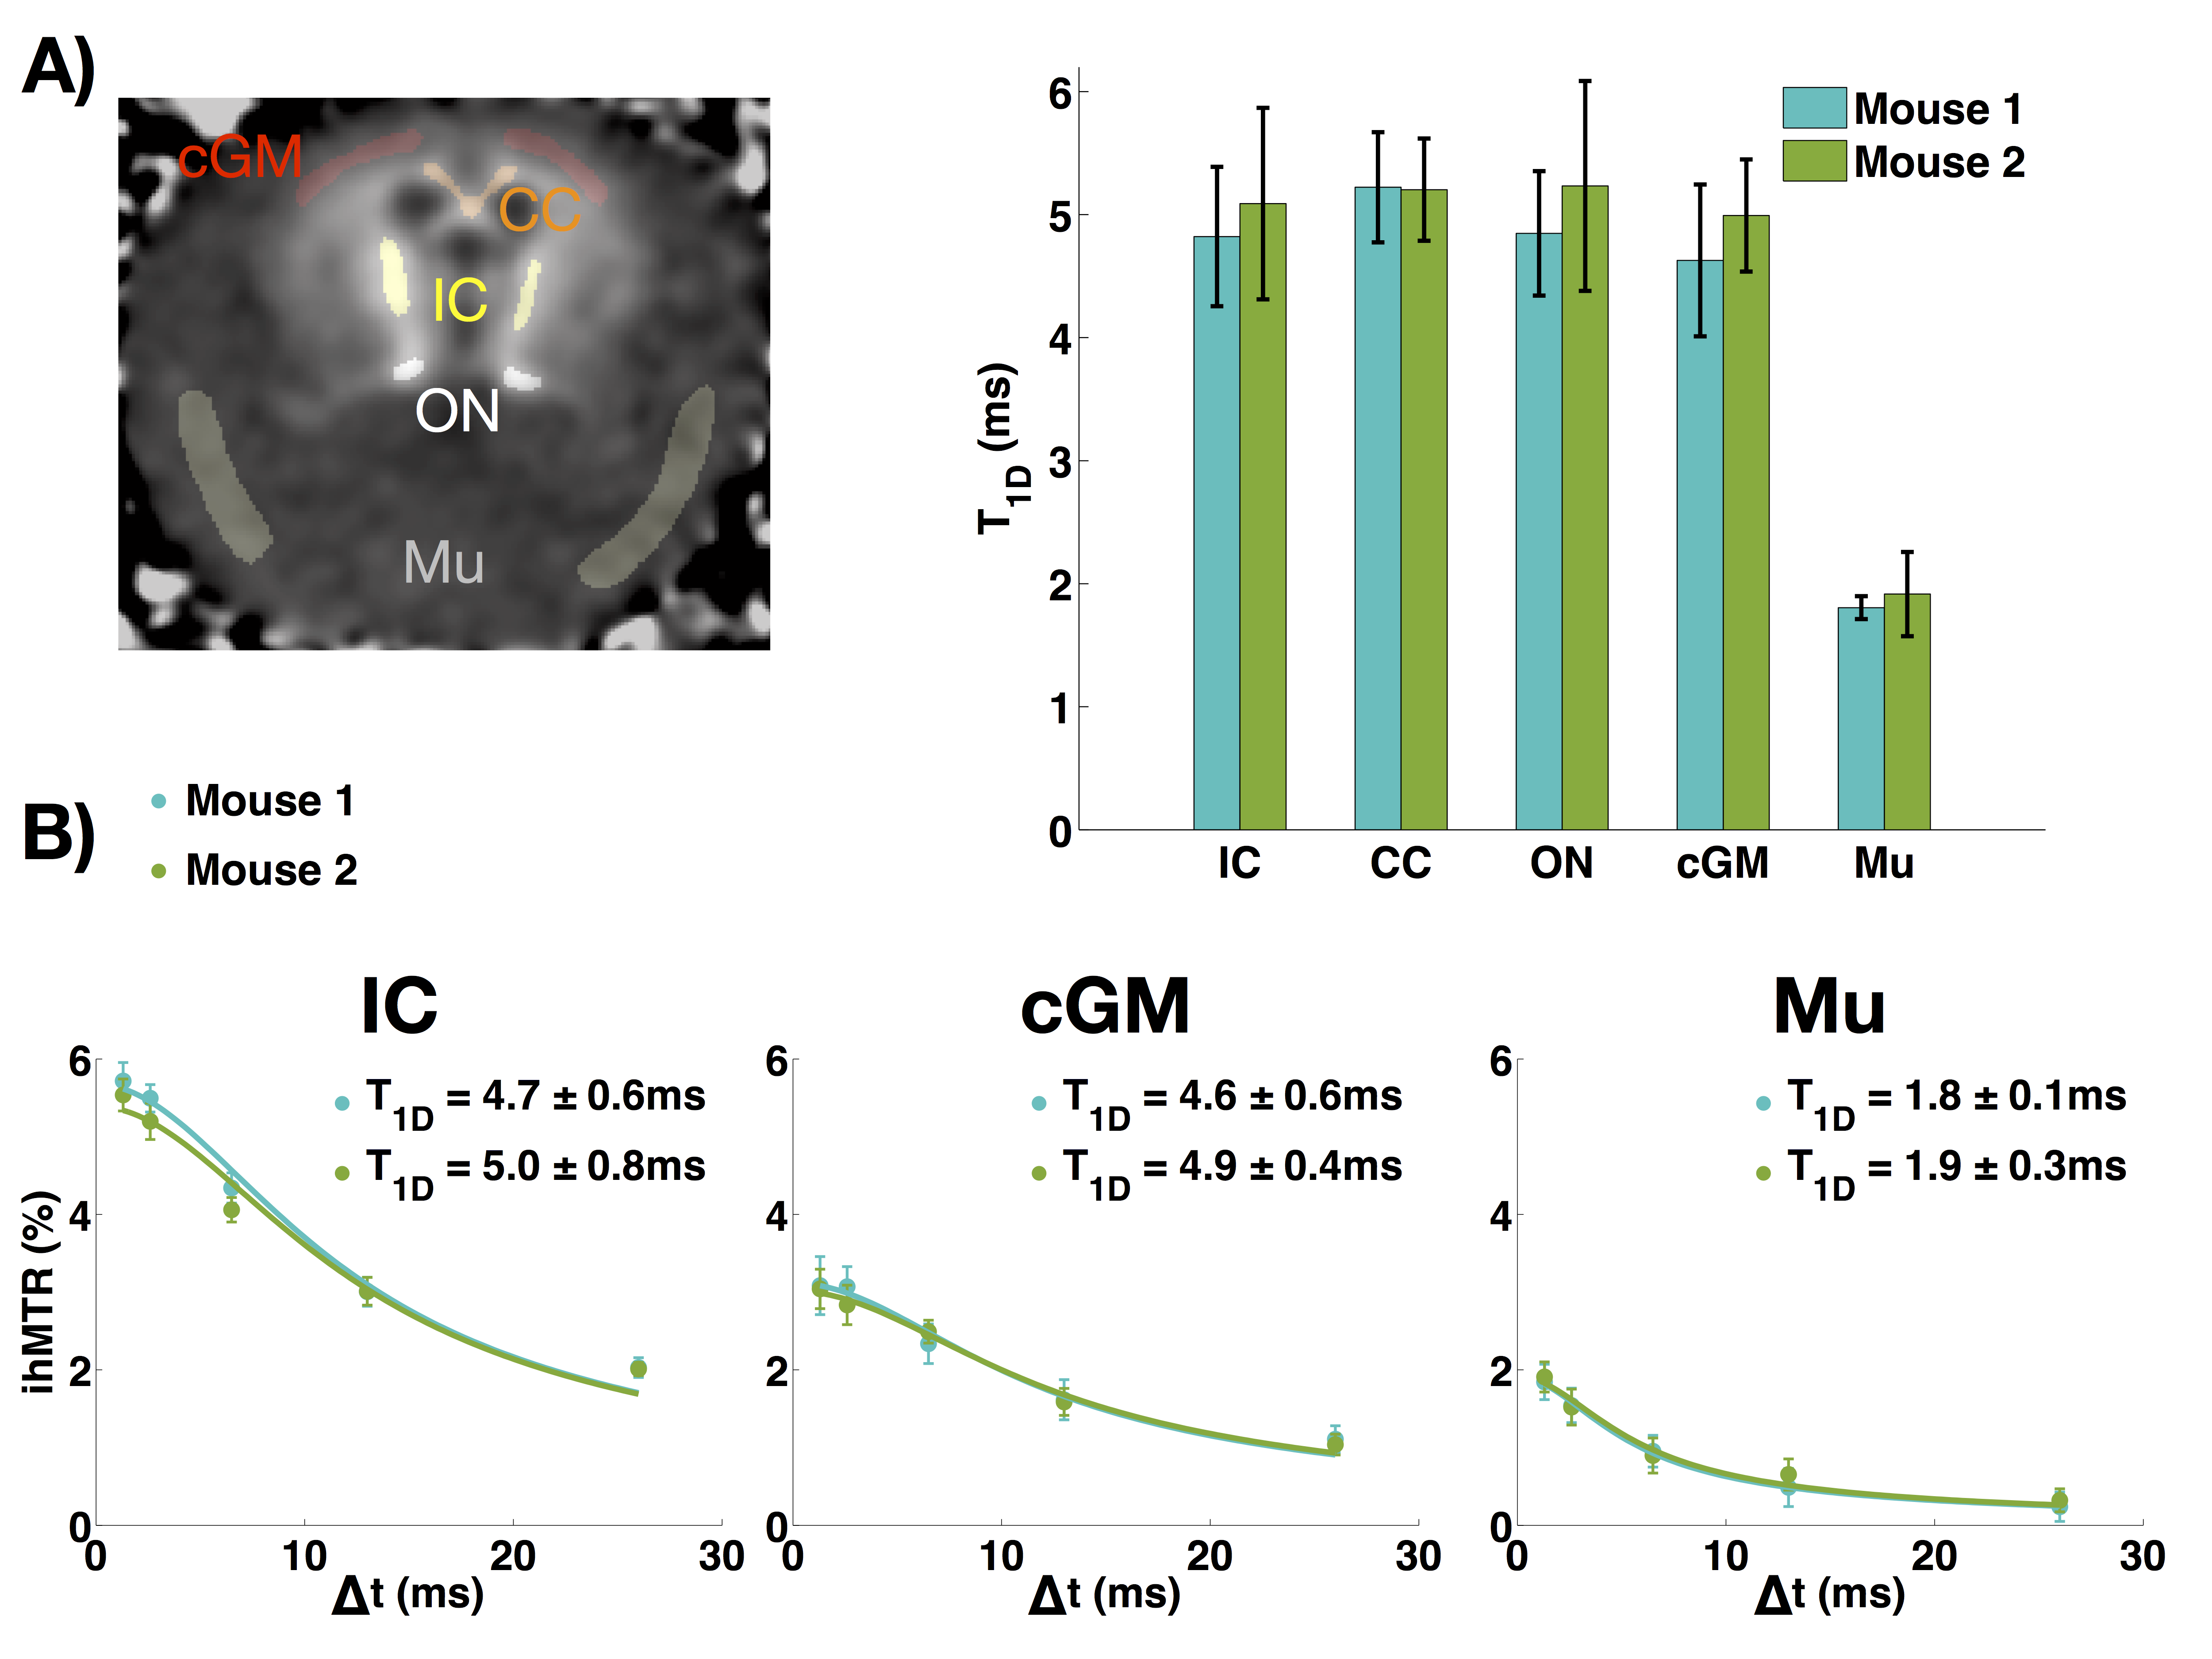
With increasing Δt values, the experiments confirmed that the ihMTR intensity decreases with ∆t. The in-vivo T1D maps show that the average T1D in the mouse brain is about 5ms, while it is about 1.8ms in muscle. ROIs in several structures (internal capsule (IC), corpus callosum (CC), optical nerves (ON), cortical gray matter (cGM), and muscle (Mu)) were taken and the T1D values are reported in Figure 3. Measurements performed on both mice were consistent.Ex-vivo T1D maps
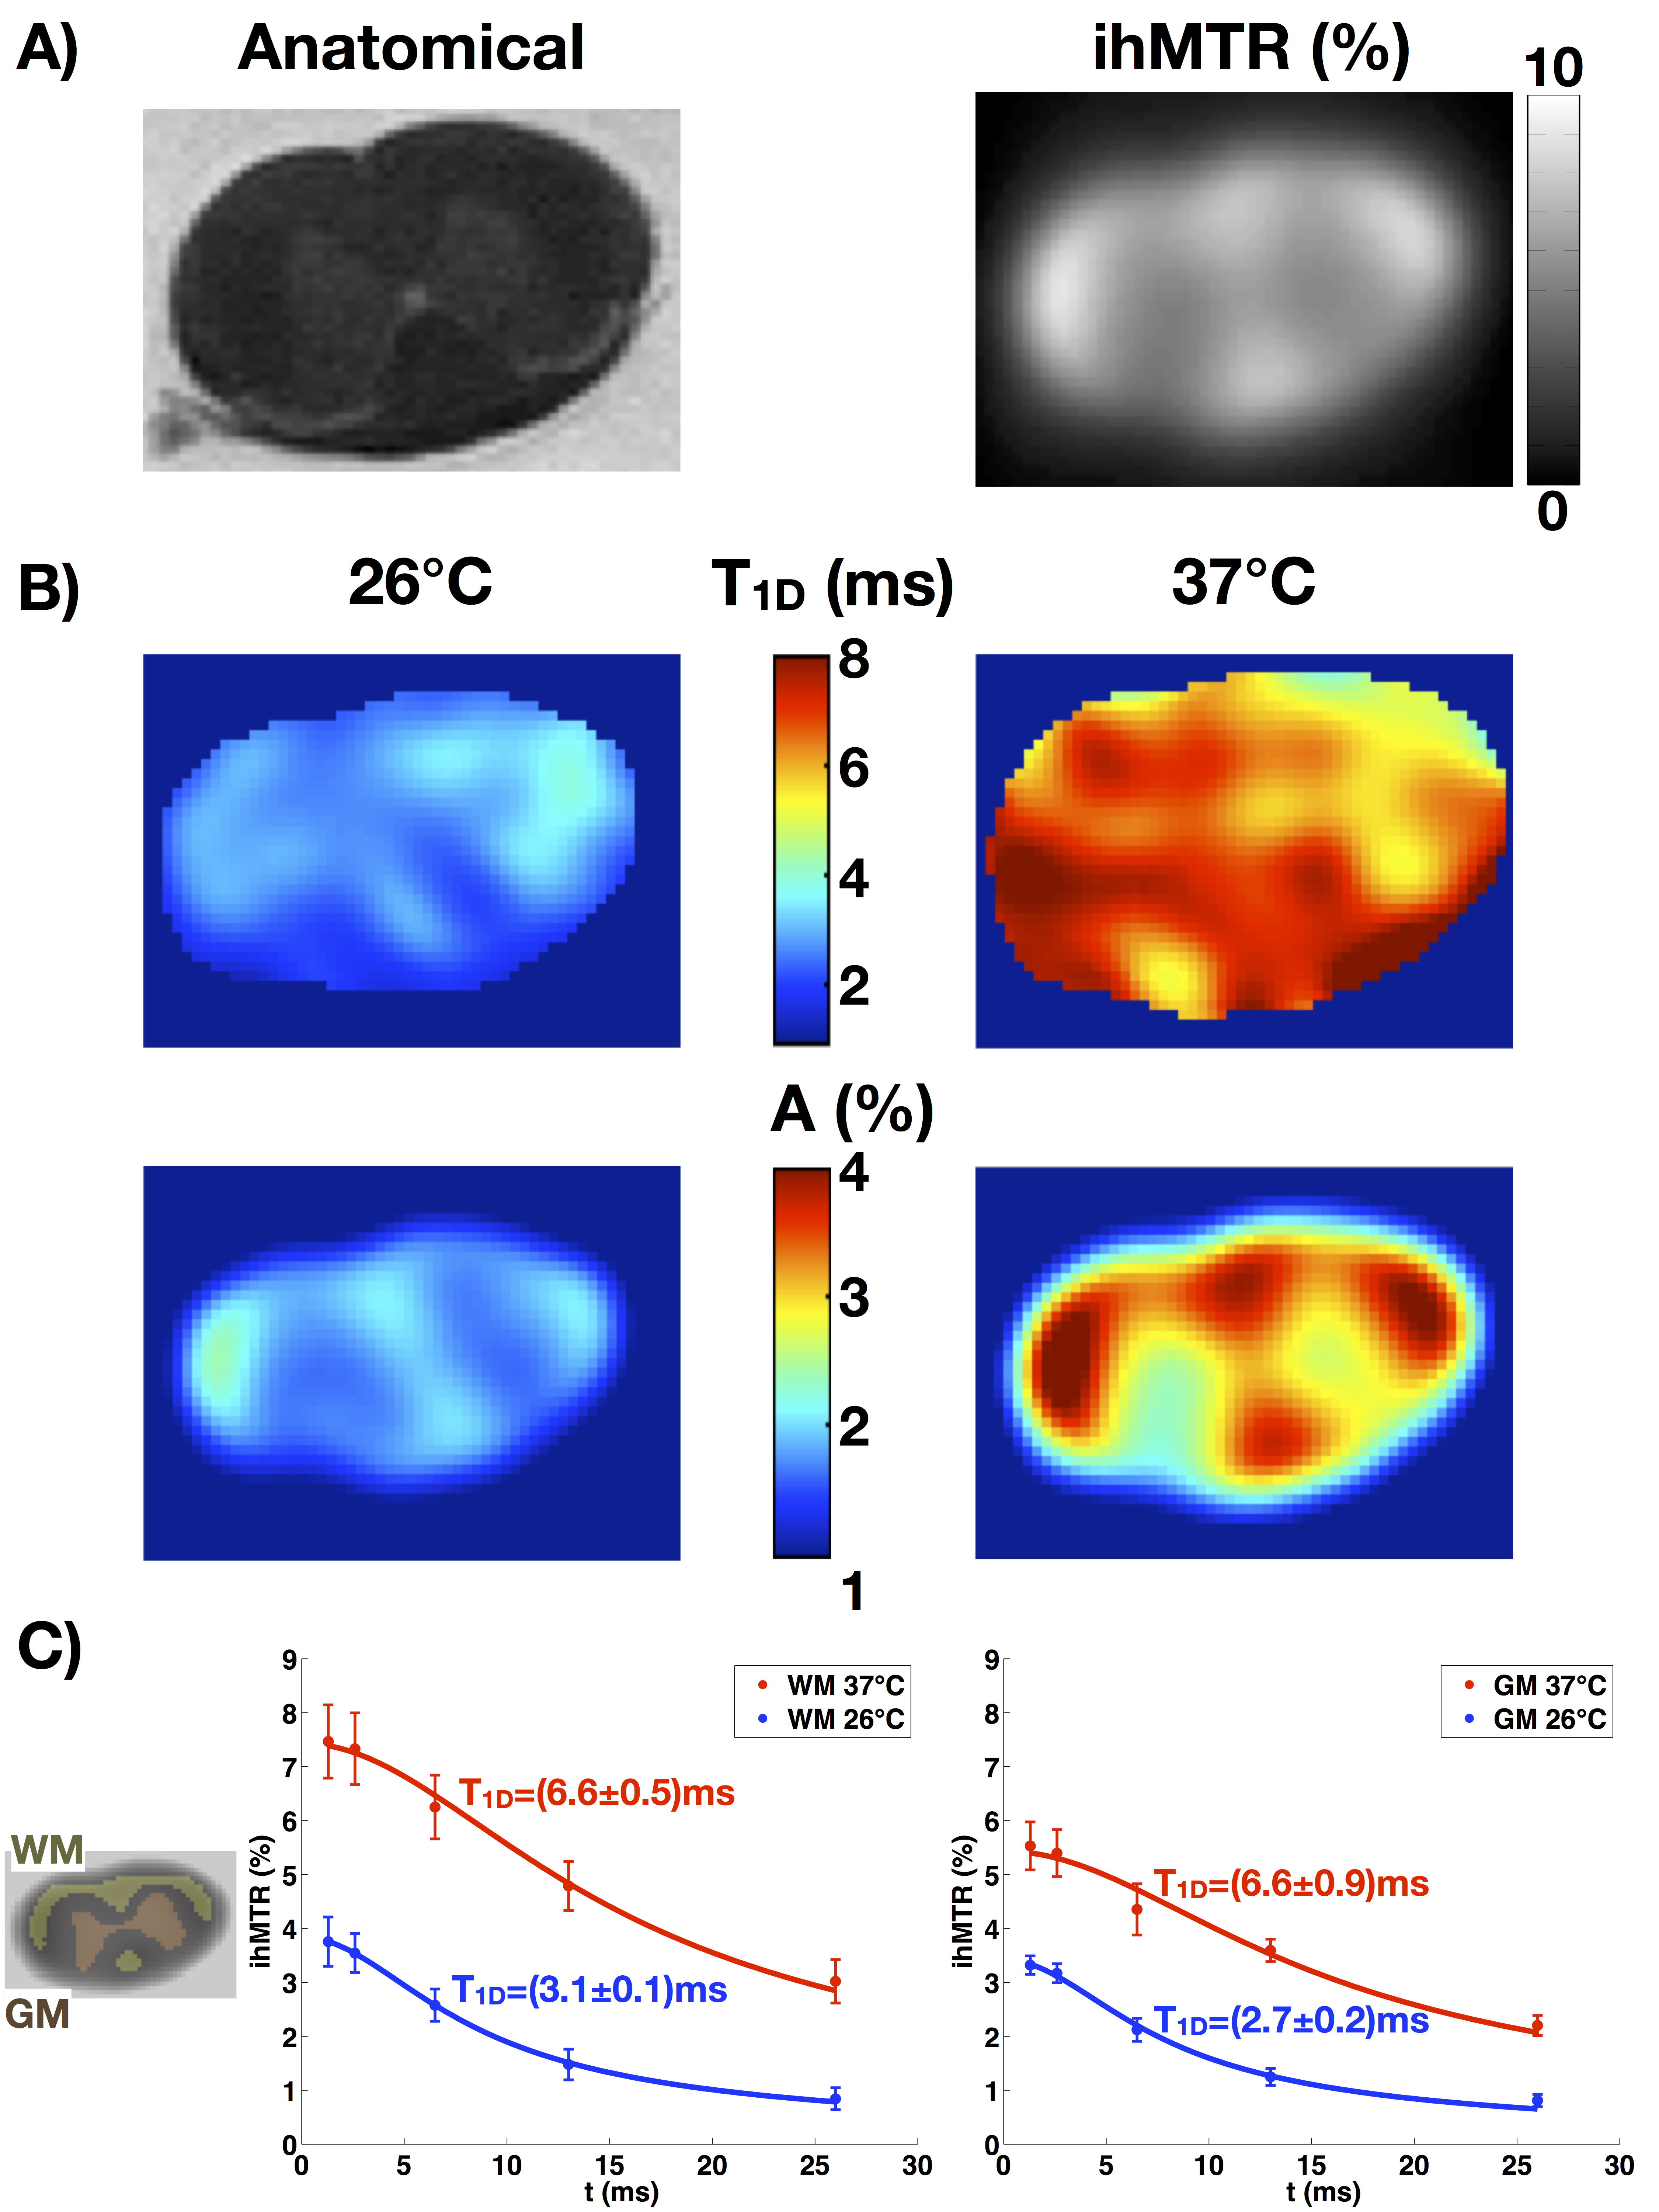
Ex-vivo T1D maps of a rat spinal cord at 26°C and 37°C show distinct T1D values: a T1D~3ms for the lowest temperature and T1D~6.5ms for the highest temperature. The fits for the white and gray matter regions are very good (R2 > 0.97). Note that at 37°C, the physiological temperature, the T1D values in spinal cord white and gray matter were close to those obtained in-vivo in mouse brain white and grey matter, respectively.T1D maps: a new marker of myelin structure?
T1D has been known in the NMR world as an important parameter related to molecular dynamics, especially in lipid bilayers. This work demonstrated reliable in-vivo T1D mapping by using the modified ihMT model introduced in [12]. The average in-vivo T1D values obtained for the different ROIs were reproducible and consistent with other measurements reported previously [9].
T1D was found very sensitive to changes in temperature. The values at 37°C were more than twice higher than the values at 26°C, indicating a good sensitivity to variations of molecular dynamics. This observation carries the potential of using T1D to assess myelin dynamical information in-vivo.
Myelin is presumably the dominant long-T1D component in the CNS. The fact that T1D maps did not show much contrast in different CNS structures indicates that T1D, as measured, is mostly independent of myelin concentration, conversely to ihMTR. Thus, T1D would provide additional information about myelin. Besides, the uniformity of T1D in normal CNS could provide an easy reference for the detection of abnormalities. More experiments must be performed in order to confirm these speculations.
Conclusion
Measuring T1D in-vivo could give new information about the myelin membrane structure, which is altered in many neurological disorders. T1D was consistently measured in-vivo and responded to temperature changes ex-vivo, indicating good sensitivity to changes in molecular dynamics.Acknowledgements
“This project has received funding from the European Union’s Horizon 2020 research and innovation programme under the Marie Skłodowska-Curie grant agreement No713750. Also, it has been carried out with the financial support of the Regional Council of Provence-Alpes-Côte d’Azur and with the financial support of the A*MIDEX (n° ANR- 11- IDEX-0001-02), funded by the Investissements d'Avenir project funded by the French Government, managed by the French National Research Agency (ANR).”References
[1] Cornelia Laule, Irene M. Vavasour, Shannon H. Kolind, David K.B. Li, Tony L. Traboulsee, G.R. Wayne Moore, and Alex L. MacKay. Magnetic resonance imaging of myelin. Neurotherapeutics, 4(3):460 – 484, 2007. Advances in Neuroimaging/Neuroethics.
[2] G. Furman and S. Goren. Dipolar Order and Spin-Lattice Relaxation in a Liquid Entrapped into Nanosize Cavities. Zeitschrift Naturforschung Teil A, 66:779–783, December 2011.
[3] R. Gaspar, E.R. Andrew, D.J. Bryant, and E.M. Cashell. Dipolar relaxation and slow molecular motions in solid proteins. Chemical Physics Letters, 86(4):327 – 330, 1982.
[4] J. Jeener and P. Broekaert. Nuclear magnetic resonance in solids: Thermodynamic effects of a pair of RF pulses. Phys. Rev., 157:232–240, May 1967.
[5] H. Yang and T. Schleich. Modified Jeener solid-echo pulse sequences for the measurement of the proton dipolar spin-lattice relaxation-time (T1D) of tissue solid-like macromolecular components. Journal of Magnetic Resonance, Series B, 105(3):205 – 210, 1994.
[6] Angelique N Danek and Robert G Bryant. Decay of dipolar order in diamagnetic and paramagnetic proteins and protein gels. Journal of Magnetic Resonance, 143(1):35 – 38, 2000.
[7] Gopal Varma, Guillaume Duhamel, Cedric de Bazelaire, and David C. Alsop. Magnetization transfer from inhomogeneously broadened lines: A potential marker for myelin. Magnetic Resonance in Medicine, 73(2):614–622, 2015.
[8] Olivier M. Girard, Valentin H. Prevost, Gopal Varma, Patrick J. Cozzone, David C. Alsop, and Guillaume Duhamel. Magnetization transfer from inhomogeneously broadened lines (ihMT): Experimental optimization of saturation parameters for human brain imaging at 1.5 tesla. Magnetic Resonance in Medicine, 73(6):2111–2121, 2015.
[9] V.H. Prevost, O.M. Girard, S. Mchinda, G. Varma, D.C. Alsop, and G. Duhamel. Optimization of inhomogeneous magnetization transfer (ihMT) mri contrast for preclinical studies using dipolar relaxation time (T1D) filtering. NMR in Biomedicine, 30(6):e3706–n/a, 2017. e3706 NBM-16-0237.R2
[10] Olivier M. Girard, Virginie Callot, Valentin H. Prevost, Benjamin Robert, Manuel Taso, Guilherme Ribeiro, Gopal Varma, Novena Rangwala, David C. Alsop, and Guillaume Duhamel. Magnetization transfer from inhomogeneously broadened lines (ihMT): Improved imaging strategy for spinal cord applications. Magnetic Resonance in Medicine, 77(2):581–591, 2017.
[11] G. Varma, O.M. Girard, V.H. Prevost, A.K. Grant, G. Duhamel, and D.C. Alsop. Interpretation of magnetization transfer from inhomogeneously broadened lines (ihMT) in tissues as a dipolar order effect within motion restricted molecules. Journal of Magnetic Resonance, 260(Supplement C):67 – 76, 2015.
[12] Gopal Varma, Olivier M. Girard, Valentin H. Prevost, Aaron K. Grant, Guillaume Duhamel, and David C. Alsop. In vivo measurement of a new source of contrast, the dipolar relaxation time, T1D, using a modified inhomogeneous magnetization transfer (ihMT) sequence. Magnetic Resonance in Medicine, pages n/a–n/a, 2016.
Figures