5495
The role of ferritin and myelin in orientation dependent R2* measured from susceptibility-weighted MR signal in white matter1UBC MRI Research Centre, University of British Columbia, Vancouver, BC, Canada, 2Engineering Physics, University of British Columbia, Vancouver, BC, Canada, 3Department of Physics and Astronomy, University of British Columbia, Vancouver, BC, Canada, 4Oxford Centre for Functional MRI of the Brain, University of Oxford, Headington, Oxford, United Kingdom, 5Department of Pediatrics, University of British Columbia, Vancouver, BC, Canada
Synopsis
The R2* relaxation in brain's white matter(WM) exhibits a dependency on WM fibre orientation relative to the external magnetic field, B0. Here, we introduce a computational model based on first principles derived from magnetic field inhomogeneities generated by ferritin and myelin. We investigate their effects on the multi gradient-echo signal by fitting simulated R2*, over angles 0–90o, to experimental R2*(R2=0.94). By comparing different myelin concentrations, we present how ferritin is required to complement myelin in describing the orientation dependency in R2*. Additionally, we propose a model for mapping R2* as a function of fibre orientation, myelin and iron concentration.
Introduction
Measured R2* relaxation in brain’s white matter (WM) displays a strong orientation dependency on the angle between the myelinated axons and the main magnetic field, B01,9. This orientation dependency has been attributed to the magnetic inhomogeneities generated by the anisotropic susceptibility of myelin, with existing models centered around myelinated axons for computing orientation dependency in R2* 2,3. Here, we present a computational model incorporating both myelin and ferritin, a required protein for healthy myelination and a known storage mechanism of iron in WM5,6, to describe the fibre orientation dependency in R2*.
Methods - Experimental
R2* data from 30 healthy volunteers were acquired on a 3T system equipped with an 8-channel SENSE head coil using a 3D gradient echo scan with 5 echoes (TE1=5 ms, echo-spacing=5 ms), voxel volume = 0.9 x 1 x 1.6 mm3 acquired and 0.8 x 0.8 x 0.8 mm3 reconstructed. Fibre orientation was measured with DTI (b0=0, b1=1000, TR/TE=7465/75 ms, voxel volume=2.2 x 2.2 x 2.2 mm3). R2* as a function of fibre orientation was computed as described by Hernández-Torres et al.4Methods - Model
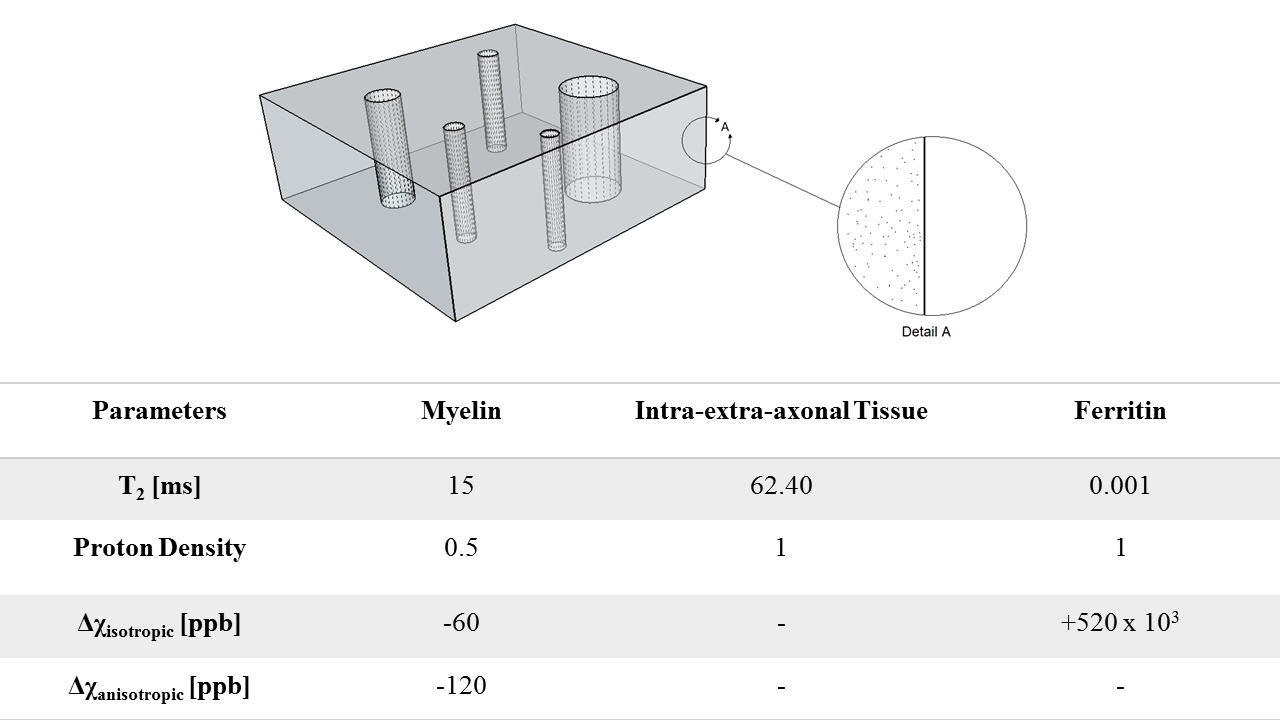
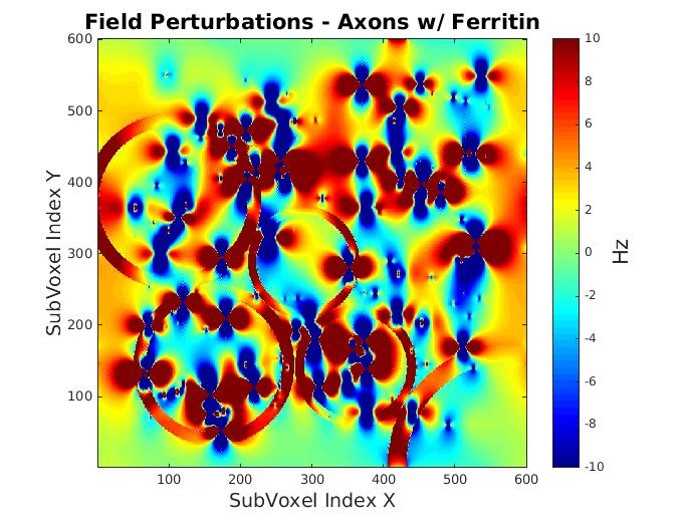
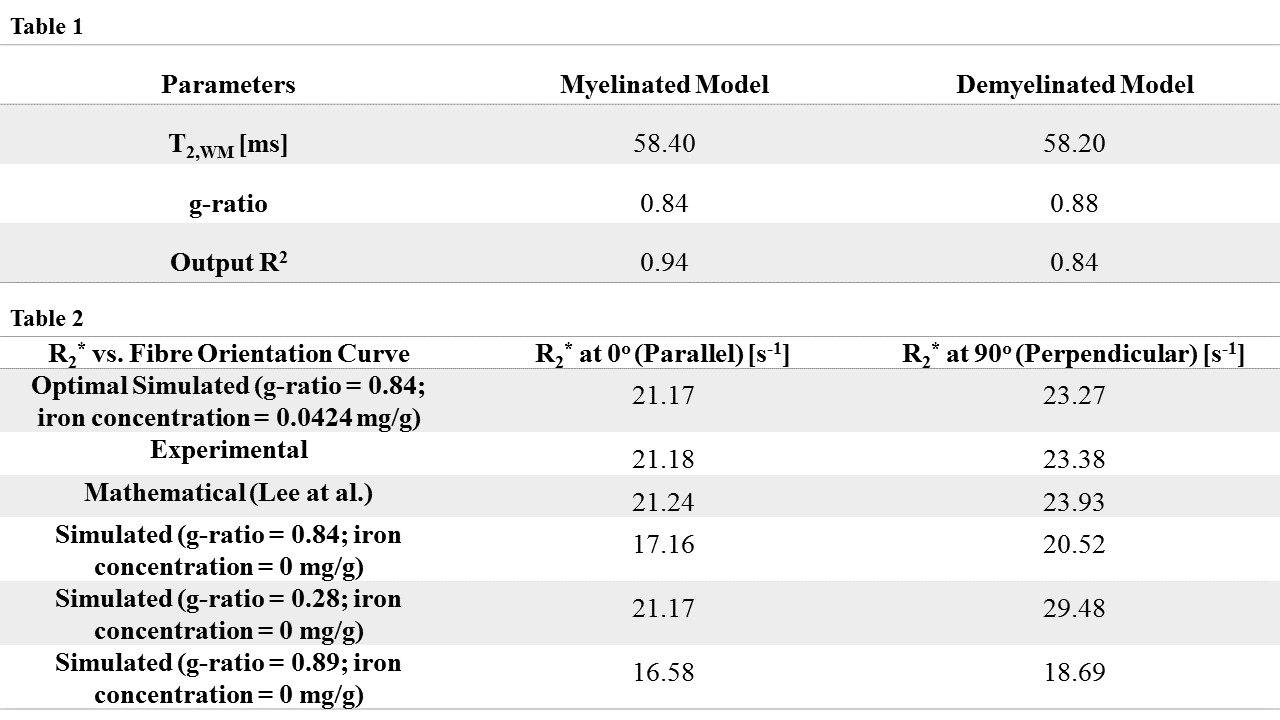
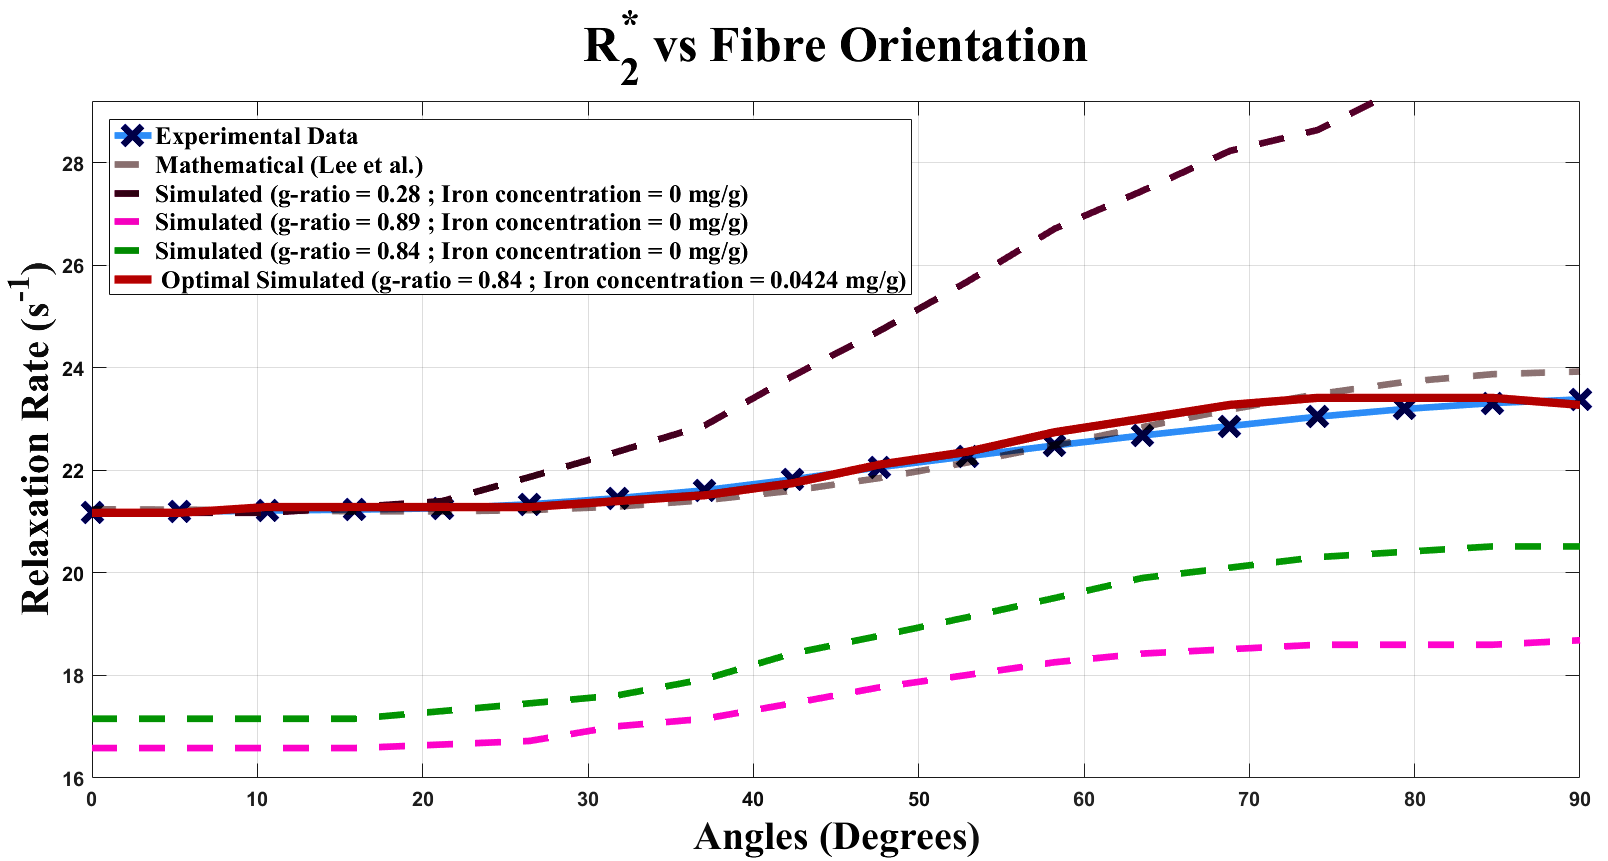
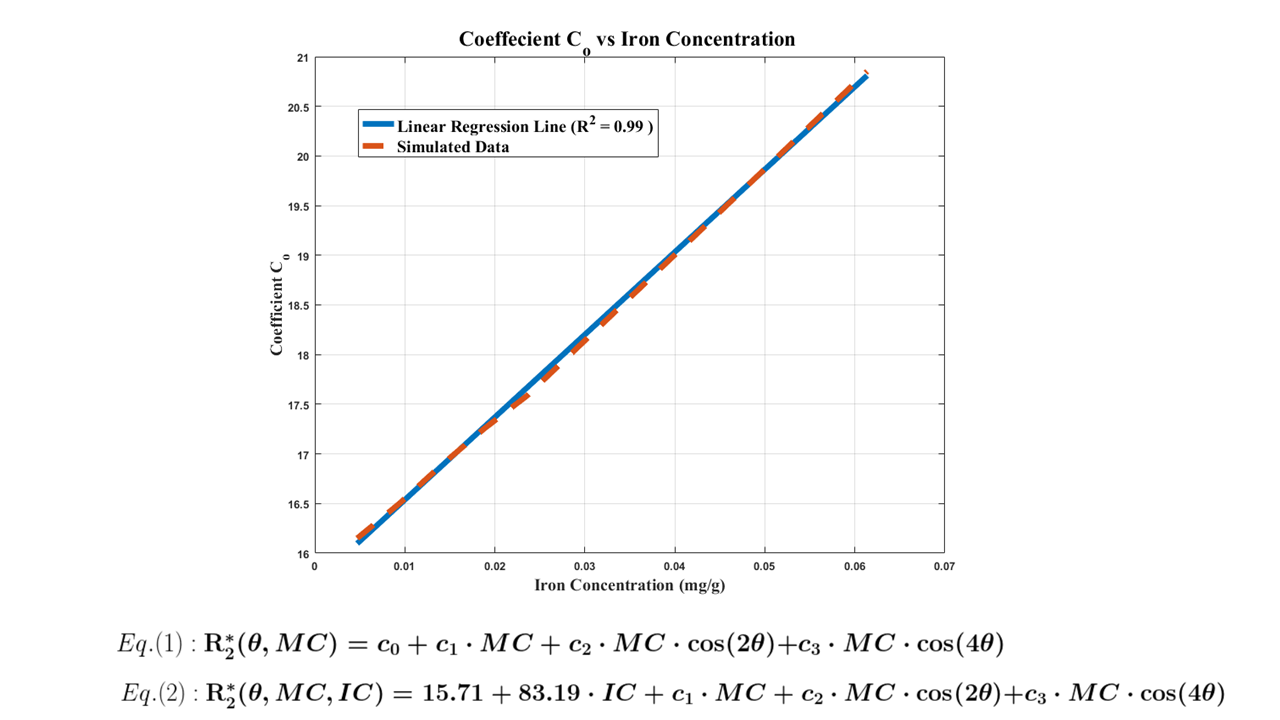
Myelinated axons and ferritin were taken to be idealized hollow cylinders and spheres, respectively. Axon sizes were modeled with a gamma distribution, with mean radii of 0.46 μm, shape factor of 3.82, and assigned a packing density of 64%3. The mean axon g-ratio was left variable as a fitting parameter. Each ferritin was allocated a radius of 4 nm, with the sphere assumed to be packed with 4500 ferric ions5. An iron concentration of 0.0424 mg/g was assumed for WM6. Magnetization within a 3D voxel was simulated (Fig. 1) for a multi gradient-echo signal over fibre orientation angles from 0 – 90o (5o intervals). For each angle, R2* was determined by fitting a mono-exponential curve to simulated signal computed for echo times up to 100 ms, and an R2* vs. fibre orientation plot was obtained. Variable parameters, g-ratio and T2 of white matter, were determined through a gradient descent based L2-norm minimization algorithm using MATLAB’s lsqcurvefit to match simulated R2* with experimental data. Verifications were performed by fitting an existing R2* model9 to both the experimental and simulated data sets. Fit coefficients from the simulated model were verified with reference coefficients from the experimental data(Fig. 5). Subsequent simulations varied g-ratio(Fig. 3,4) for comparisons. Lastly, multiple fits were performed with the existing R2* model9 for different iron concentrations to determine the relation between the myelin- and orientation-independent coefficient, C0, and iron concentration(Fig. 5).Results
The optimal fit (R2 = 0.94) with experimental data corresponds to input T2 of 58.40 ms for WM and 0.84 for g-ratio(Fig. 2). For comparison, R2* curves were simulated without ferritin and with different myelin concentrations (g-ratios 0.28, 0.84 and 0.89) (Fig. 3). A linear relation between C0 and simulated iron concentration is observed, with a regression coefficient of 83.19 s-1/(mg/g) and an offset of 15.71 s-1. The offset is interpreted to be the iron-, myelin- and orientation-independent coefficient, and is hypothesized to be the T2 of intra-extra-axonal tissue.Discussion and Conclusion
For parameters, a T2 value of 58.40 ms for WM is in close agreement with typical T2 values, such as those reported by Peters et al.7, while a g-ratio of 0.84 is a slightly higher than optimal g-ratio of 0.778. Plausible explanations may be the lack of inclusion of unmyelinated axons in a simulated volume, which are present in samples of WM. The simulated results demonstrate the requirement to incorporate ferritin for correctly describing R2* as a function of WM fibre orientation. Variations of simulated myelin concentration demonstrate myelin’s inadequacy in modelling the orientation dependency of R2* in WM(Fig. 3,4). The model only fits the data when ferritin is introduced, which gives rise to an orientation-independent R2* that contributes to an accurate R2* over all fibre orientations. Primary and secondary verifications with experimental data and data generated from an existing model9 confirm the nontrivial effects of ferritin in R2*. We also found a linear relation between coefficient C0 and iron concentration, and propose an improved R2* model dependent on iron concentration(Fig. 5). It should be noted that the R2* curves are a result of pooling voxels from various brain regions for each angle. Therefore, the g-ratio of the best fit represents an average across the entire WM. We also ignored that some axons may be unmyelinated and assumed that all axons have the same g-ratio. Moreover, the model only incorporated static dephasing, with no consideration for diffusion.
Acknowledgements
No acknowledgement found.References
1. C. Denk, E. Hernandez Torres, A. MacKay, and A. Rauscher, “The influence of white matter fibre orientation on MR signal phase and decay,” NMR Biomed., vol. 24, no. 3, pp. 246–252, Apr. 2011.
2. S. Wharton and R. Bowtell, “Fiber orientation-dependent white matter contrast in gradient echo MRI,” Proc. Natl. Acad. Sci. U. S. A., vol. 109, no. 45, pp. 18559–18564, Nov. 2012.
3. T. Xu, S. Foxley, M. Kleinnijenhuis, W. C. Chen, and K. L. Miller, “The effect of realistic geometries on the susceptibility-weighted MR signal in white matter,” Magn. Reson. Med., Apr. 2017.
4. E. Hernández-Torres et al., “Orientation Dependent MR Signal Decay Differentiates between People with MS, Their Asymptomatic Siblings and Unrelated Healthy Controls,” PLOS ONE, vol. 10, no. 10, p. e0140956, Oct. 2015.
5. P. M. Harrison and P. Arosio, “The ferritins: molecular properties, iron storage function and cellular regulation,” Biochim. Biophys. Acta, vol. 1275, no. 3, pp. 161–203, Jul. 1996.
6. B. Hallgren and P. Sourander, “The effect of age on the non-haemin iron in the human brain,” J. Neurochem., vol. 3, no. 1, pp. 41–51, Oct. 1958.
7. A. M. Peters et al., “T2* measurements in human brain at 1.5, 3 and 7 T,” Magn. Reson. Imaging, vol. 25, no. 6, pp. 748–753, Jul. 2007.
8. T. Chomiak and B. Hu, “What is the optimal value of the g-ratio for myelinated fibers in the rat CNS? A theoretical approach,” PloS One, vol. 4, no. 11, p. e7754, Nov. 2009.
9. J. Lee, H.-G. Shin, W. Jung, Y. Nam, S.-H. Oh, and J. Lee, “An R2* model of white matter for fiber orientation and myelin concentration,” NeuroImage, Aug. 2017.
10. A. S. of Neuroradiology, “Magnetic Resonance of Myelination and Myelin Disorders, 3rd ed,” Am. J. Neuroradiol., vol. 27, no. 4, pp. 947–948, Apr. 2006.
Figures