5494
A Feasibility Study of Quantifying Renal Microvascular Diameter and Density Using Vessel Size Imaging (VSI)1Institute for Medical Imaging Technology, Shanghai Jiao Tong university, Shanghai, China, 2Academy for Advanced Interdisciplinary Studies, Peking University, Beijing, China, 3College of Engineering, Peking University, Beijing, China, 4Philips Healthcare, Suzhou, China, 5Department of Radiology, Peking University First Hospital, Beijing, China
Synopsis
Information on renal microvascular architecture is still hardly accessible by clinical MRI techniques. This study explores the feasibility of using spin- and gradient-echo (SAGE) based dynamic susceptibility-contrast MRI for the quantification of renal microvascular diameter/density. Microvascular diameter (VSI) map, Q map and vessel density (D) map were calculated based on the differential dependence of R2/R2* relaxation rates on the capillary-sized vascular structures, which may provide a potentially important MR biomarker for the detection and staging of renal cell carcinoma
Target Audience
Researchers and clinicians interested in the development of advanced MRI techniques for quantification of renal microvascular diameter and vessel density.Introduction
MR angiography has been widely used for large vessel imaging. However, information on microvascular architecture is still hardly accessible by clinical MRI techniques. Vessel size imaging (VSI)1,2 exploits the differential dependence of R2/R2* relaxation rates on the capillary-sized vascular structures, which seems to be a promising approach to assess renal microvasculature. Many studies have reported applications of VSI for brain tumor detection and grading3-5. However, very few studies reported the quantification of renal microvascular diameter/density using VSI technique.Purpose
To explore the feasibility of using spin- and gradient-echo (SAGE) based dynamic susceptibility-contrast MRI for the quantification of renal microvascular diameter/density.Materials and Methods
Animal Preparation
Eight New Zealand white rabbits (weight range: 2.5-3.5 kg) were included in this study. All the experiments were performed in accordance with local Institutional Animal Care and Use Committee protocols.
MR Imaging
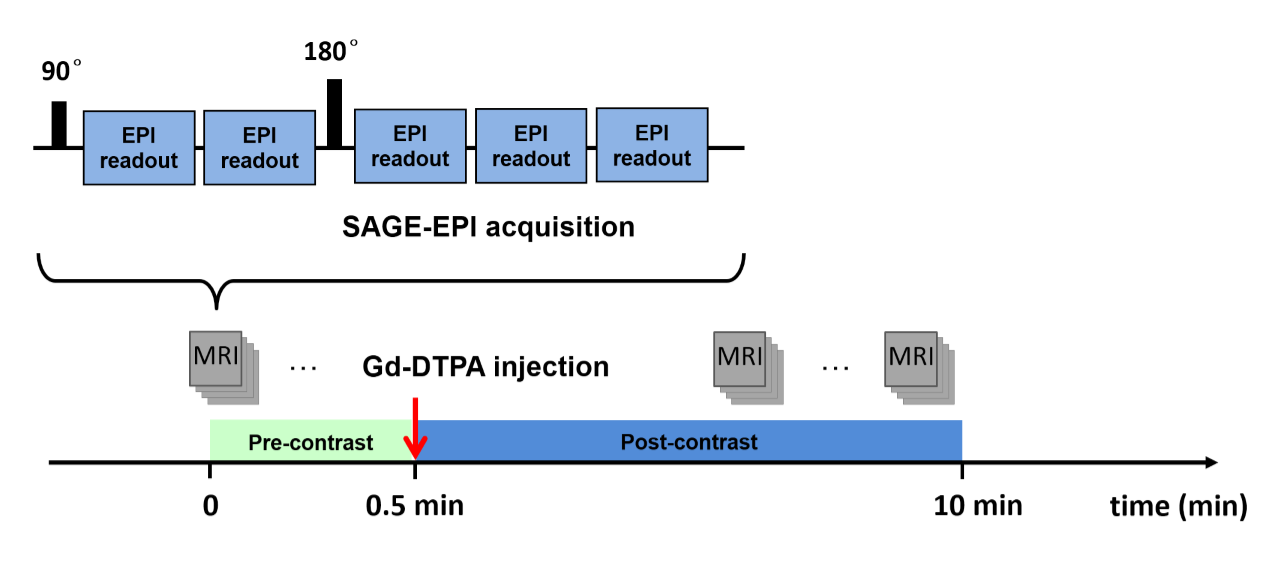
MRI was performed on a 3.0 Tesla MRI scanner (Achieva, Philips Medical Systems, Best, Netherlands). VSI data were acquired using a SAGE-EPI pulse sequence shown in Fig. 1. A five-echo SAGE acquisition was implemented with TE1-5 = 12, 34, 56, 78 and 100 ms, and with echo-train duration of 18 ms. The last echo train acquired at TE5 = TESE coincided with the SE formation. Detailed imaging parameters were: TR = 2.0 s, FOV = 120 × 120 mm2, Voxel Size = 1.6 × 1.6 mm2, slice thickness = 5.0 mm, dynamic phase = 100. Fat suppression was applied in the SAGE-EPI acquisition. After 20 s of baseline scan, 0.1 mmol/kg gadopentetate dimeglumine (Gd-DTPA) was injected followed by a 10-ml saline flush during the dynamic scans.
Image Analysis
The SAGE-derived R2 and R2* time-courses were obtained using nonlinear least squares fits as described previously6. The baseline signals were averaged to obtain the pre-bolus signal. ΔR2 and ΔR2* were calculated as the difference between the relaxation rates during contrast agent passage and the mean pre-contrast relaxation rate. Parametric maps were generated using a home-built MATLAB program. Q map and density (D) map were calculated pixelwisely according to Eq. [1] and Eq. [2].
$$Q=\triangle R2/(\triangle R2*)^\frac{2}{3}$$ [1]
$$N=Q^3/(D\cdot(1.678k)^3)$$ [2]
where k is dependent on the distribution of microvascular radii, D is the diffusion coefficient. The vessel diameter (VSI) was determined by fitting a linear dependence between ΔR23/2 and ΔR2* during the bolus passage according to Eq. [3].
$$VSI=0.867(\zeta D)^\frac{1}{2}\cdot\triangle R2*/\triangle R2^\frac{3}{2}$$ [3]
where ζ is the blood volume fraction.
Results
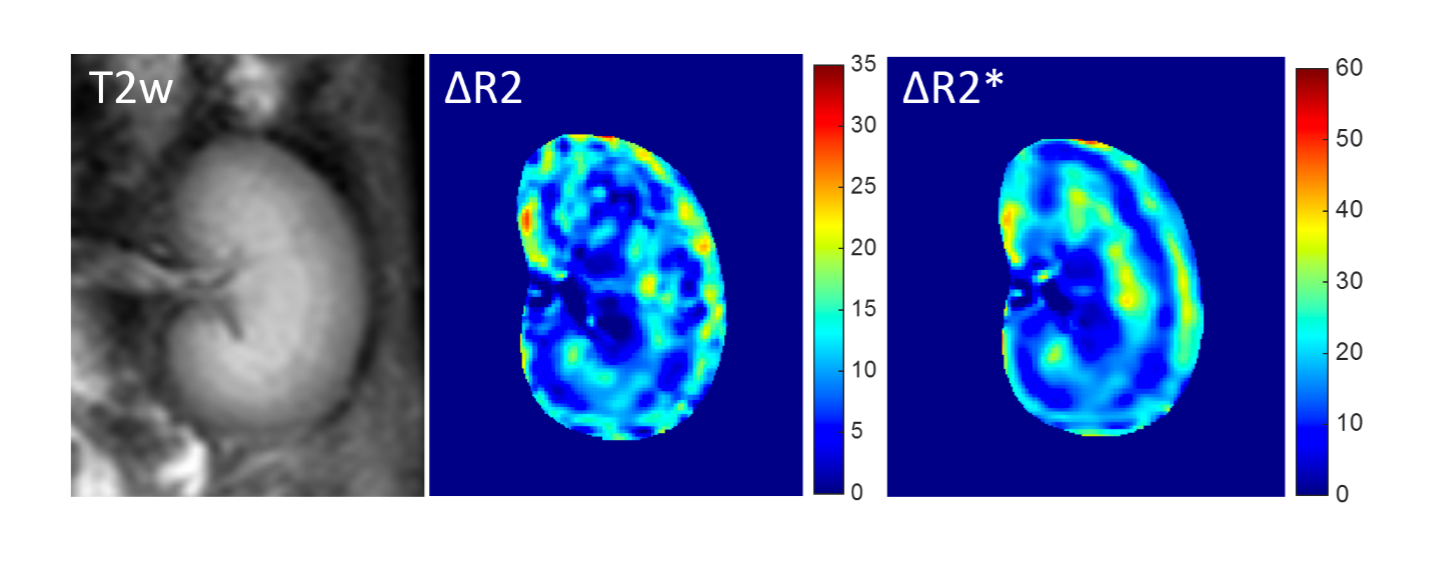
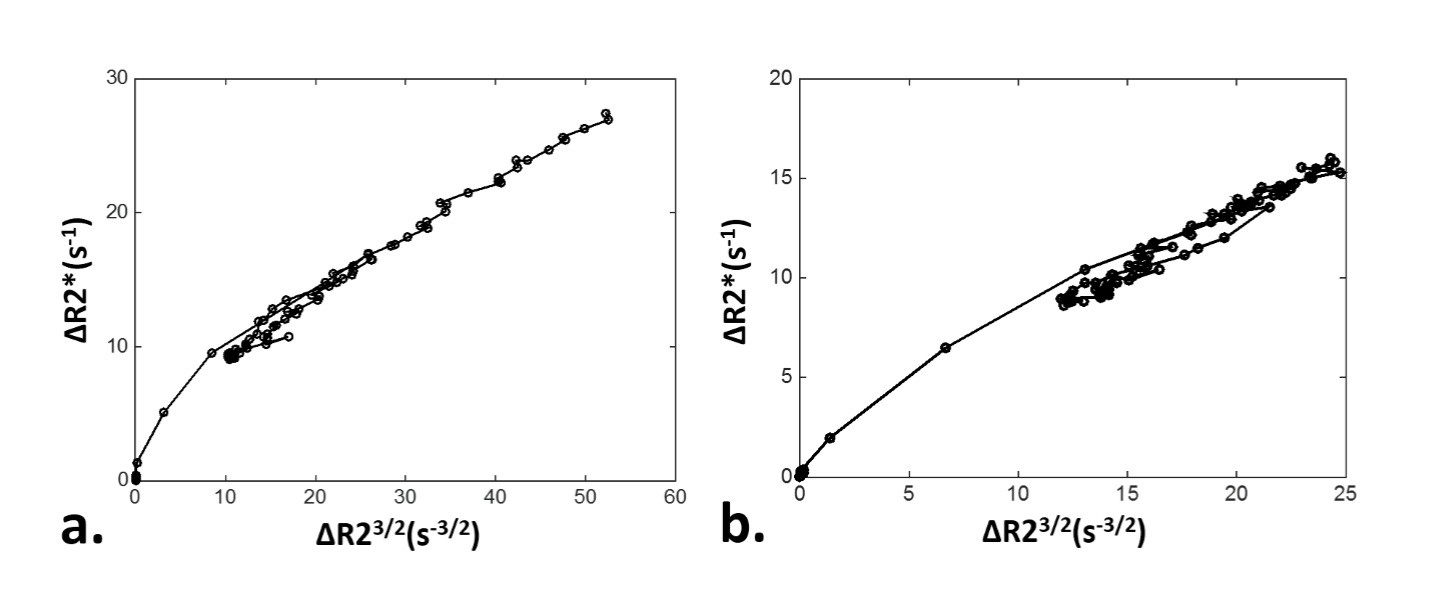
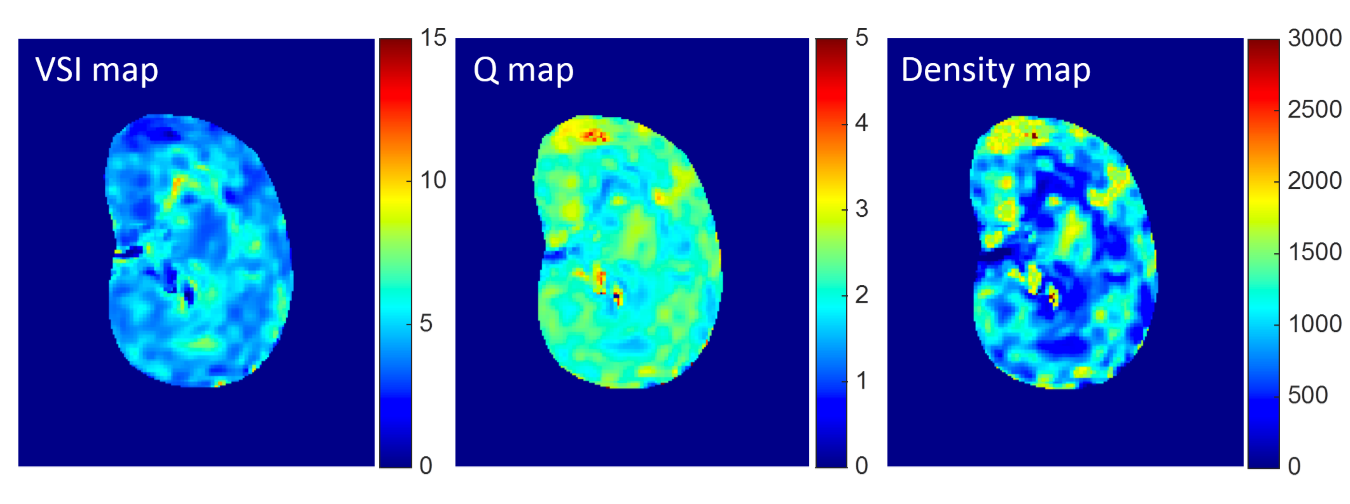
Fig. 2 shows an example of baseline T2w image and contrast-enhanced ΔR2/ΔR2* maps following Gd-DTPA injection. Fig. 3 shows the transient variations in the relaxation rates (ΔR2/ΔR2*) in healthy renal cortex and medulla. Note that the dependence between ΔR23/2 and ΔR2* is slightly different during the increase and decrease of the contrast agent concentration in tissue. This can be understood as a manifestation of the changing involvement of the arterial and venous pools in the signal dephasing. The estimated renal VSI, Q and vessel density maps were shown in Fig. 4.
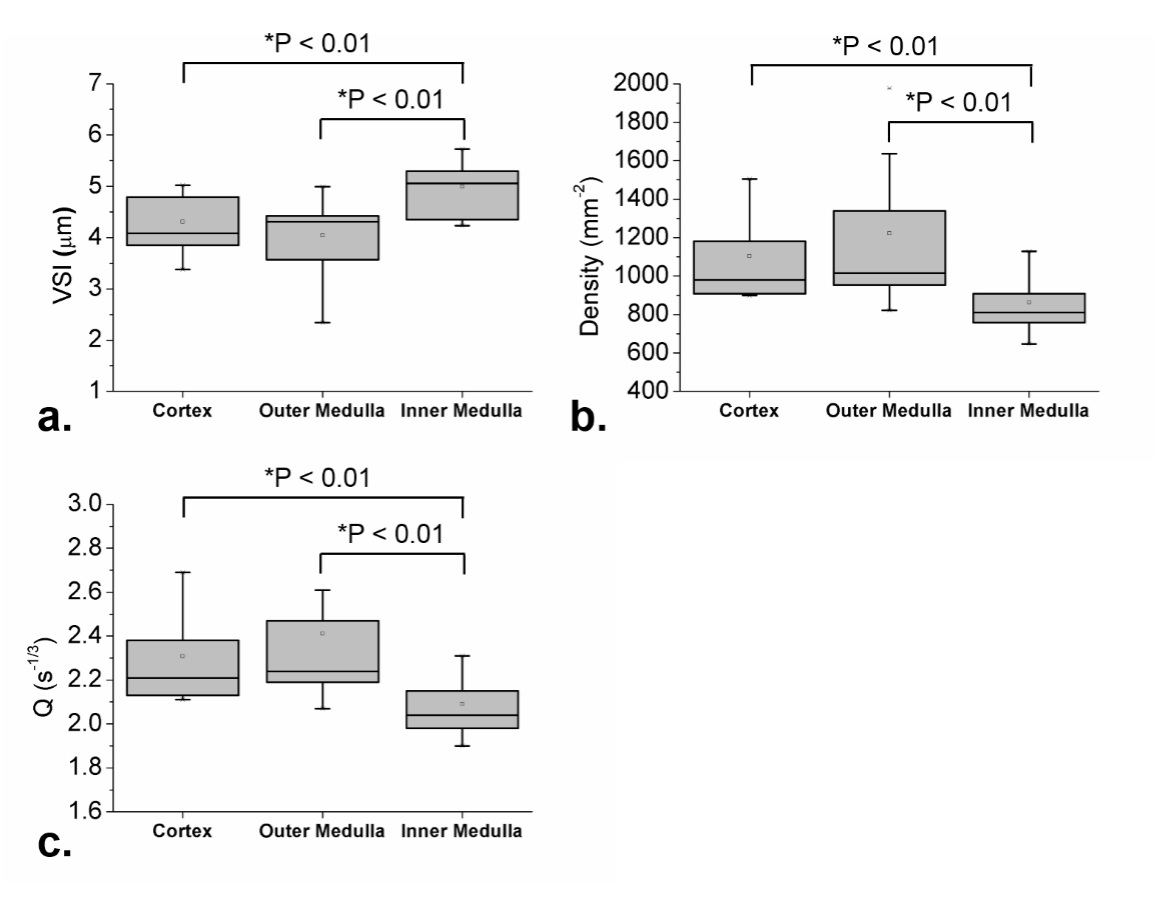
Pixel-wise measures of microvascular diameter were found to vary between 3.38 μm and 5.02 μm within the cortex, and between 2.34 μm and 5.73 μm within medulla. The microvascular densities were found to vary between 899.59 mm-2 and 1504.27 mm-2 within cortex, while between 647.02 mm-2 and 1976.69 mm-2 within medulla. The average microvascular diameter was significantly smaller in cortex and outer medulla than that in the inner medulla (both with P < 0.01), while the microvascular density and Q values were significantly higher in cortex and outer medulla than that in the inner medulla (both with P < 0.01). But no statistical differences of microvascular diameter and vessel density were found between cortex and outer medulla (Fig. 5).
Conclusion
This study presents the first application of VSI for quantification of renal microvascular diameter and vessel density, which provides a potentially important MR biomarker for the detection and staging of renal cell carcinoma.Acknowledgements
No acknowledgement found.References
1. Prinster A, Pierpaoli C, Turner R, Jezzard P. Simultaneous measurement of R2 and R2* in cat brain during hypoxia and hypercapnia. Neuroimage 1997;6:191–200.
2. Tropres I, Grimault S, Albert V, et al. Vessel size imaging. Magn Reson Med 2001, 45(3):397–408.
3. Schmainda KM, Rand SD, Joseph AM, Lund R, Ward BD, Pathak AP, Ulmer JL, Baddrudoja MA, Krouwer HGJ. Characterization of a first-pass gradient-echo spin-echo method to predict brain tumor grade and angiogenesis. Am J Neuroradiol 2004;25:1524–1532.
4. Pannetier N, Lemasson B, Christen T, Tachrount M, Tropres I, Farion R, Segebarth C, Remy C, Barbier EL. Vessel size index measurements in a rat model of glioma: comparison of the dynamic (Gd) and steady- state (iron-oxide) susceptibility contrast MRI approaches. NMR Biomed 2012;25:218–226.
5. Donahue KM, Krouwer HG, Rand SD, Pathak AP, Marszalkowski CS, Censky SC, Prost RW. Utility of simultaneously acquired gradient- echo and spin-echo cerebral blood volume and morphology maps in brain tumor patients. Magn Reson Med 2000;43:845–853.
6. Schmiedeskamp H, Straka M, Newbould R D, et al. Combined spin- and gradient-echo perfusion-weighted imaging. Magn Reson Med 2012; 68:30-40.
Figures