5493
Quantifying magnetic microstructure: Beyond the perturbative regime1Radiology Department, New York University School of Medicine, New York, NY, United States
Synopsis
We model the magnetic microstructure of tissue by a colloidal suspension of spherical beads, whose susceptibility differs from that of the surrounding medium. We show that length scale and susceptibility differences of the microstructure can be quantified with good accuracy by imaging the suspension with a multiple gradient echo sequence and fitting the signal as a function of echo time to the results of Monte Carlo simulations. By comparison, the second-order cumulant expansion used in deriving analytic expressions for the signal is a poor approximation at long echo times, even when the dephasing is relatively small over the correlation time.
Introduction
Many properties of tissue microstructure can be quantified by measuring restrictions to diffusion. The magnetic properties of tissue microstructure, however, produce characteristic signatures in the decay of gradient echo, spin echo and asymmetric spin echo signals$$$^{1-7}$$$. Dephasing of signal from water molecules as they diffuse around microstructural sources of magnetic susceptibility provides a measure of the characteristic length scales and magnetic susceptibility differences within the microstructure. The length scale $$$l_c$$$ determines a correlation time $$$t_c=l_c^2/D$$$, which is the interval required for water molecules to diffuse a distance $$$\sim\,l_c$$$. At times much shorter than $$$t_c$$$, the spins are in the static dephasing regime, and the logarithm of the signal exhibits a quadratic dependence on time$$$^{2-7}$$$. At times much longer than $$$t_c$$$, the signal decay becomes asymptotically monoexponential. The transition between the two regimes can be used to extract $$$t_c$$$, which in turn determines $$$l_c$$$.
In the perturbative limit, where the dephasing due to the magnetic field inhomogeneity is small over $$$t\,\sim\,t_c$$$, the signal can be expressed as a cumulant expansion and truncated after the quadratic term $$S\left(t\right)=S_0e^{-R_2t}\left\langle e^{i\phi\left(t\right)}\right\rangle \approx S_0\,e^{-R_2t-\left\langle\phi^2\left(t\right)\right\rangle/2}\;\;\;\;\left(1\right).$$ If the microstructure is modeled as a random distribution of permeable, Gaussian sources of magnetic susceptibility$$$^{3,7}$$$, the phase variance can be approximated by $$\left\langle\phi^2\left(t\right)\right\rangle\approx 4\alpha^2\left(\frac{t}{t_c}-2\sqrt{1+\frac{t}{t_c}}+2\right) \;\;\;\;\left(2\right)$$ where $$$\alpha^2=\left\langle\delta\Omega^2 \right\rangle t_c^2$$$ and $$$\left\langle\delta\Omega^2\right\rangle$$$ is the variance in Larmor frequency due to the magnetic field inhomogeneity. The perturbative regime corresponds$$$^{2-6}$$$ to the limit $$$\alpha\ll1$$$.
In this work, we measure the signal decay from a colloidal suspension of spherical polystyrene beads and compare with the analytic expression above, and with the predictions of Monte Carlo (MC) simulations.
Methods
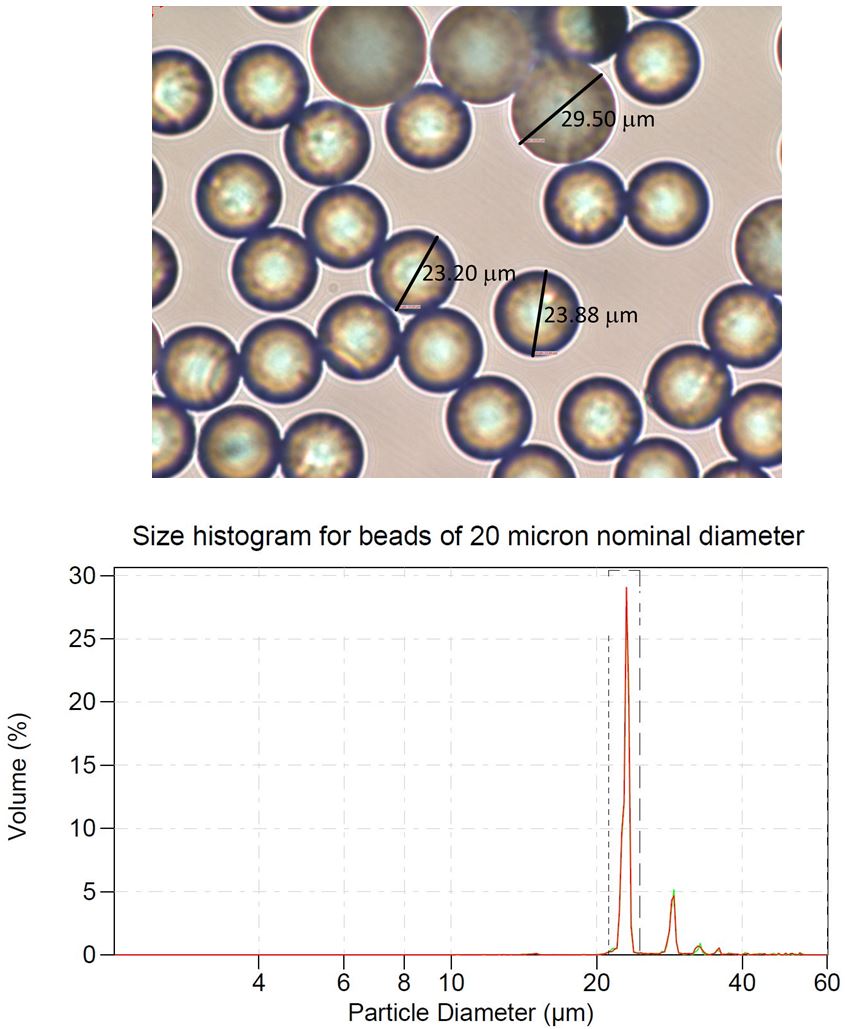
Spherical polystyrene beads of 20$$$\mu$$$m and 40$$$\mu$$$m nominal diameter and relatively narrow size distribution were purchased from Microbeads AS (Figure 1). Since the beads were slightly denser than water and had a magnetic susceptibility similar to that of water, they were suspended in a solution of 2% gelatin doped with 0.03% gadobutrol (Bayer Healthcare). Three sets of phantoms were prepared. One contained 20$$$\mu$$$m beads and another contained 40$$$\mu$$$m beads, each with a bead volume fraction of 0.1. A third set of phantoms, containing only the doped gelatin with no beads, served as a control. The phantoms were plunged into ice water to accelerate the gelling process and rotated frequently as the gelatin set to prevent the beads from settling.
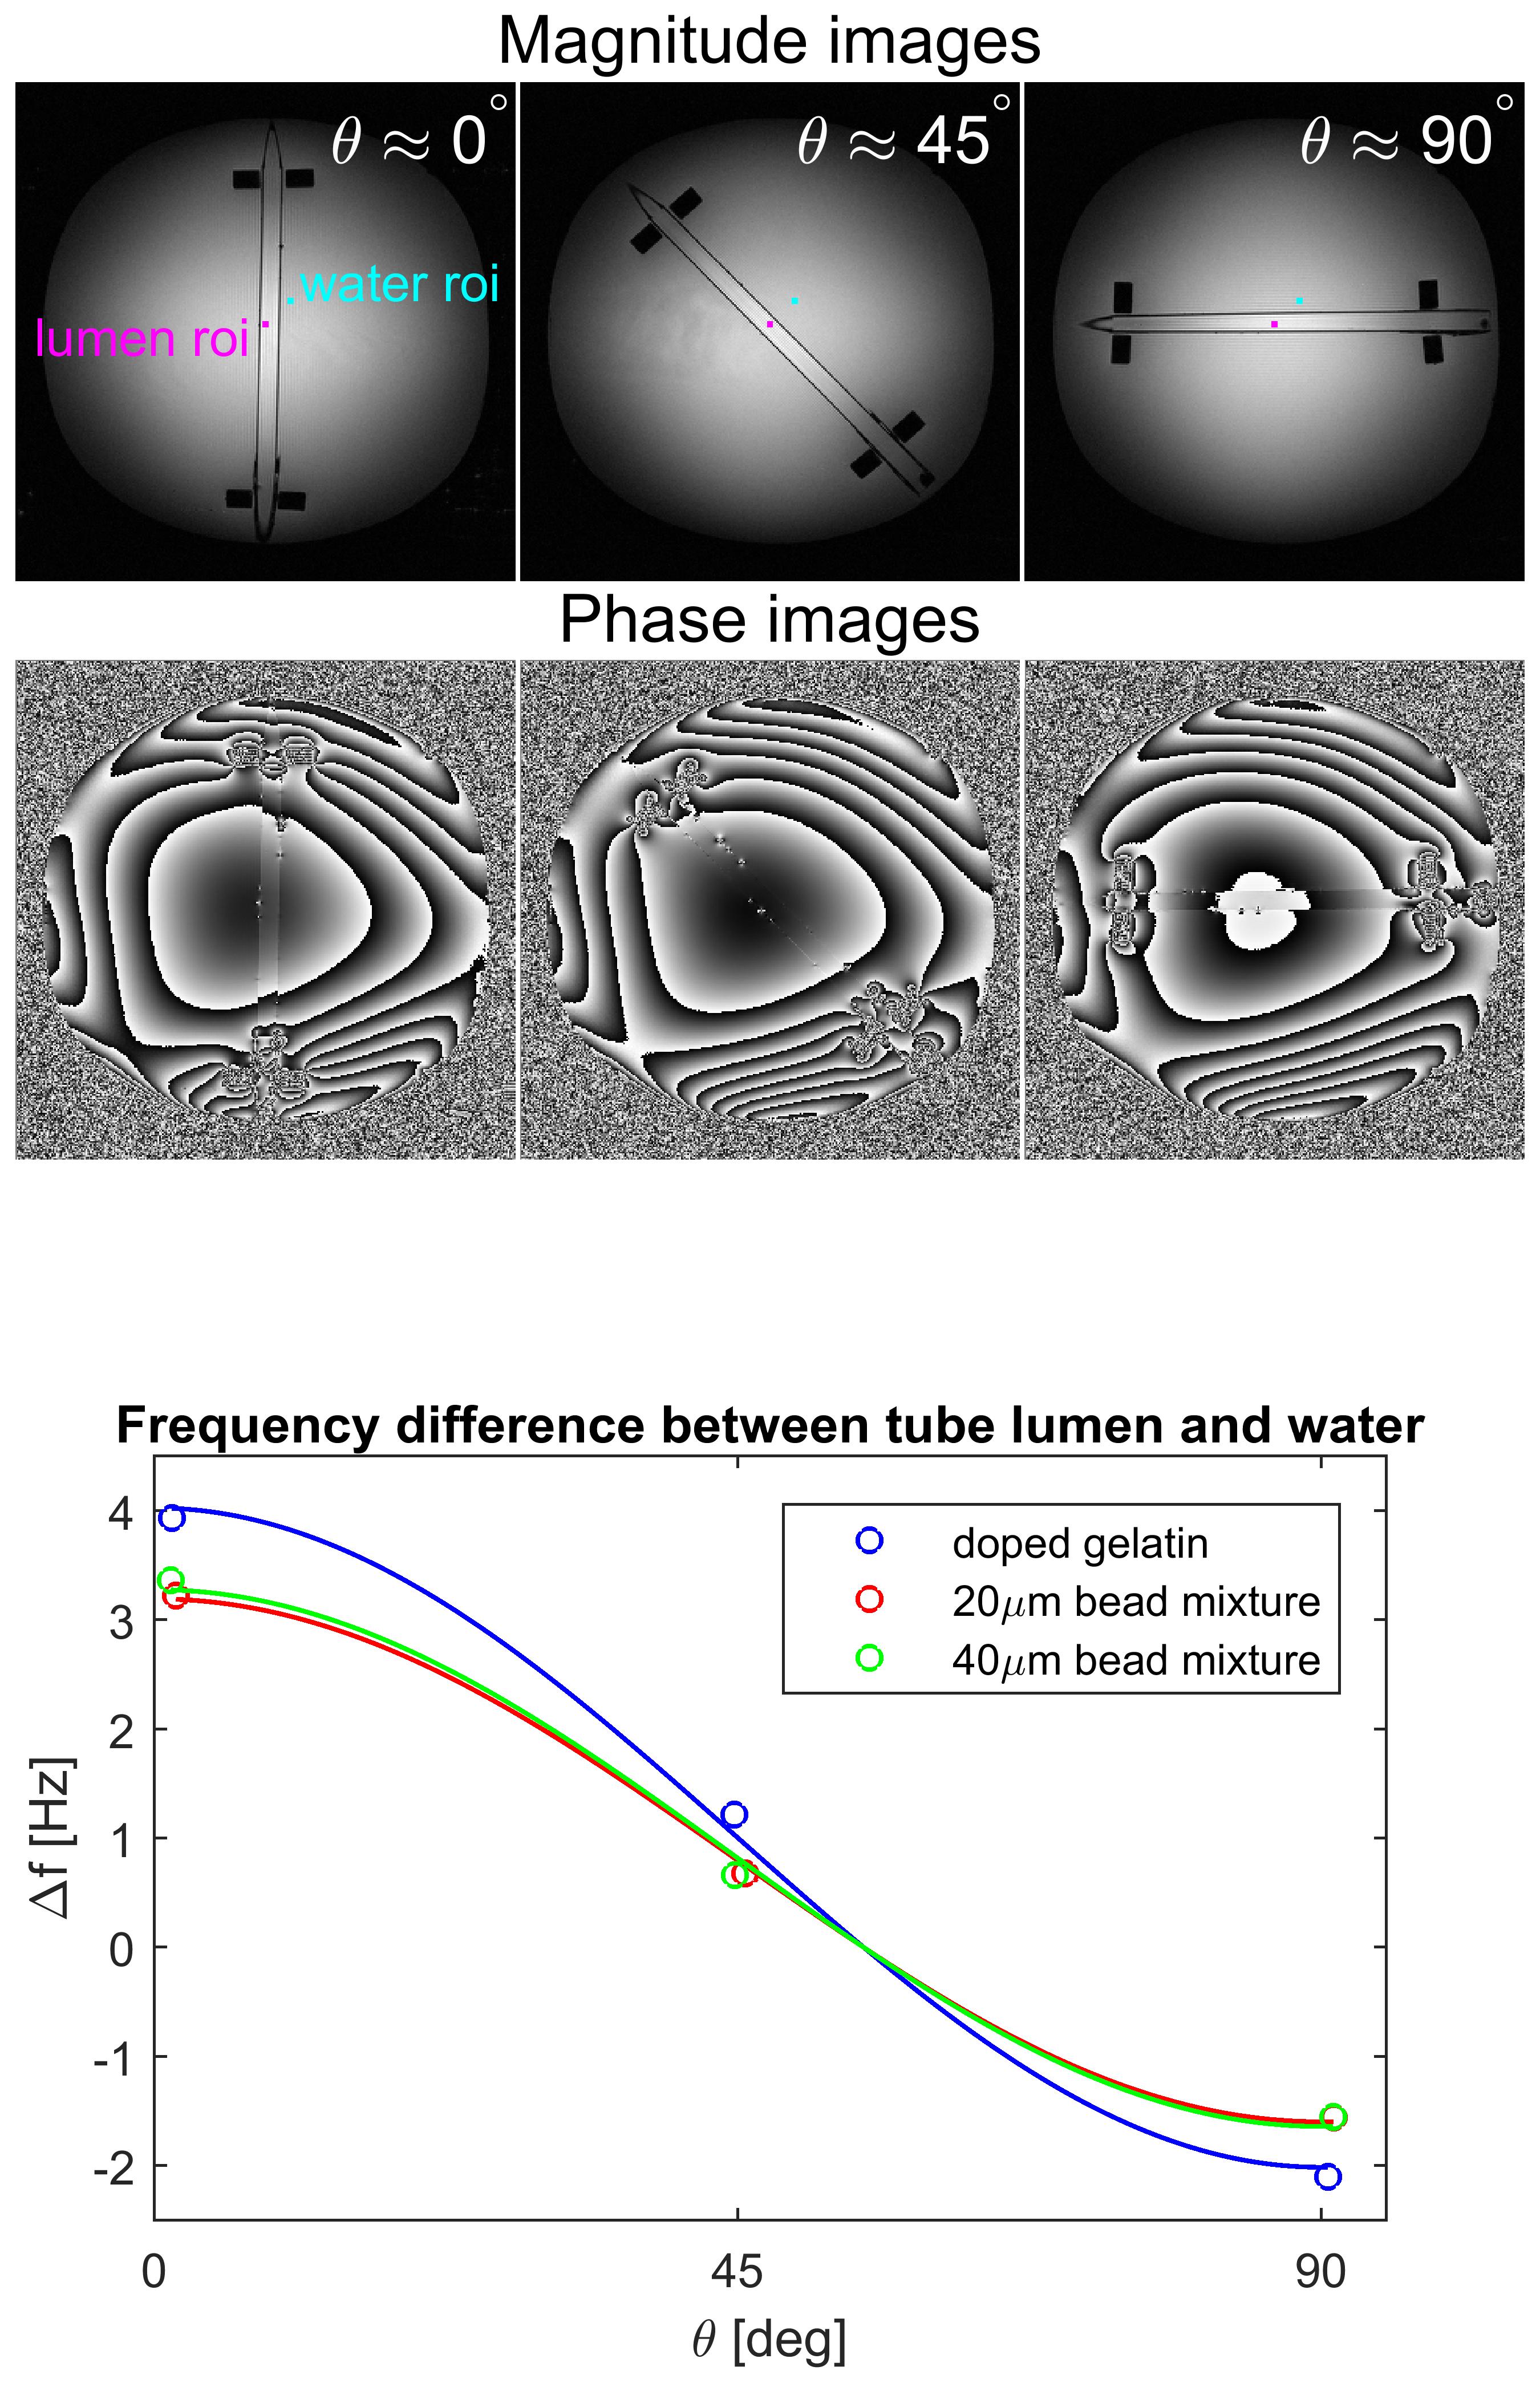
Imaging was performed at 3T (Prisma, Siemens). Signal decay was measured in all three solutions simultaneously using a 3D multiple gradient echo (MGRE) sequence (TE$$$_{\text{min}}$$$=2.62ms, $$$\Delta$$$TE=3.10ms with 0.7mm isotropic resolution). Diffusion measurements were also made using a conventional diffusion-weighted EPI sequence (b = 0, 300 and 600 s/mm$$$^2$$$). The susceptibility of the beads relative to the doped gelatin was measured as illustrated in Figure 2.
MC simulations were performed by modeling the diffusive motion of 720,000 water molecules among impermeable spherical susceptibility sources, whose positions were determined by random packing$$$^8$$$. The phase $$$\phi\left(t_i\right)$$$ of each spin at each time point $$$t_i$$$ was calculated and stored. Since the phases varied linearly with the susceptibility of the beads, they could be arbitrarily scaled after the simulation, and the signal dephasing $$$\left\langle e^{i\phi\left(t_i\right)}\right\rangle$$$ reevaluated, to allow fitting of the MC predictions to the experimental results.
Results
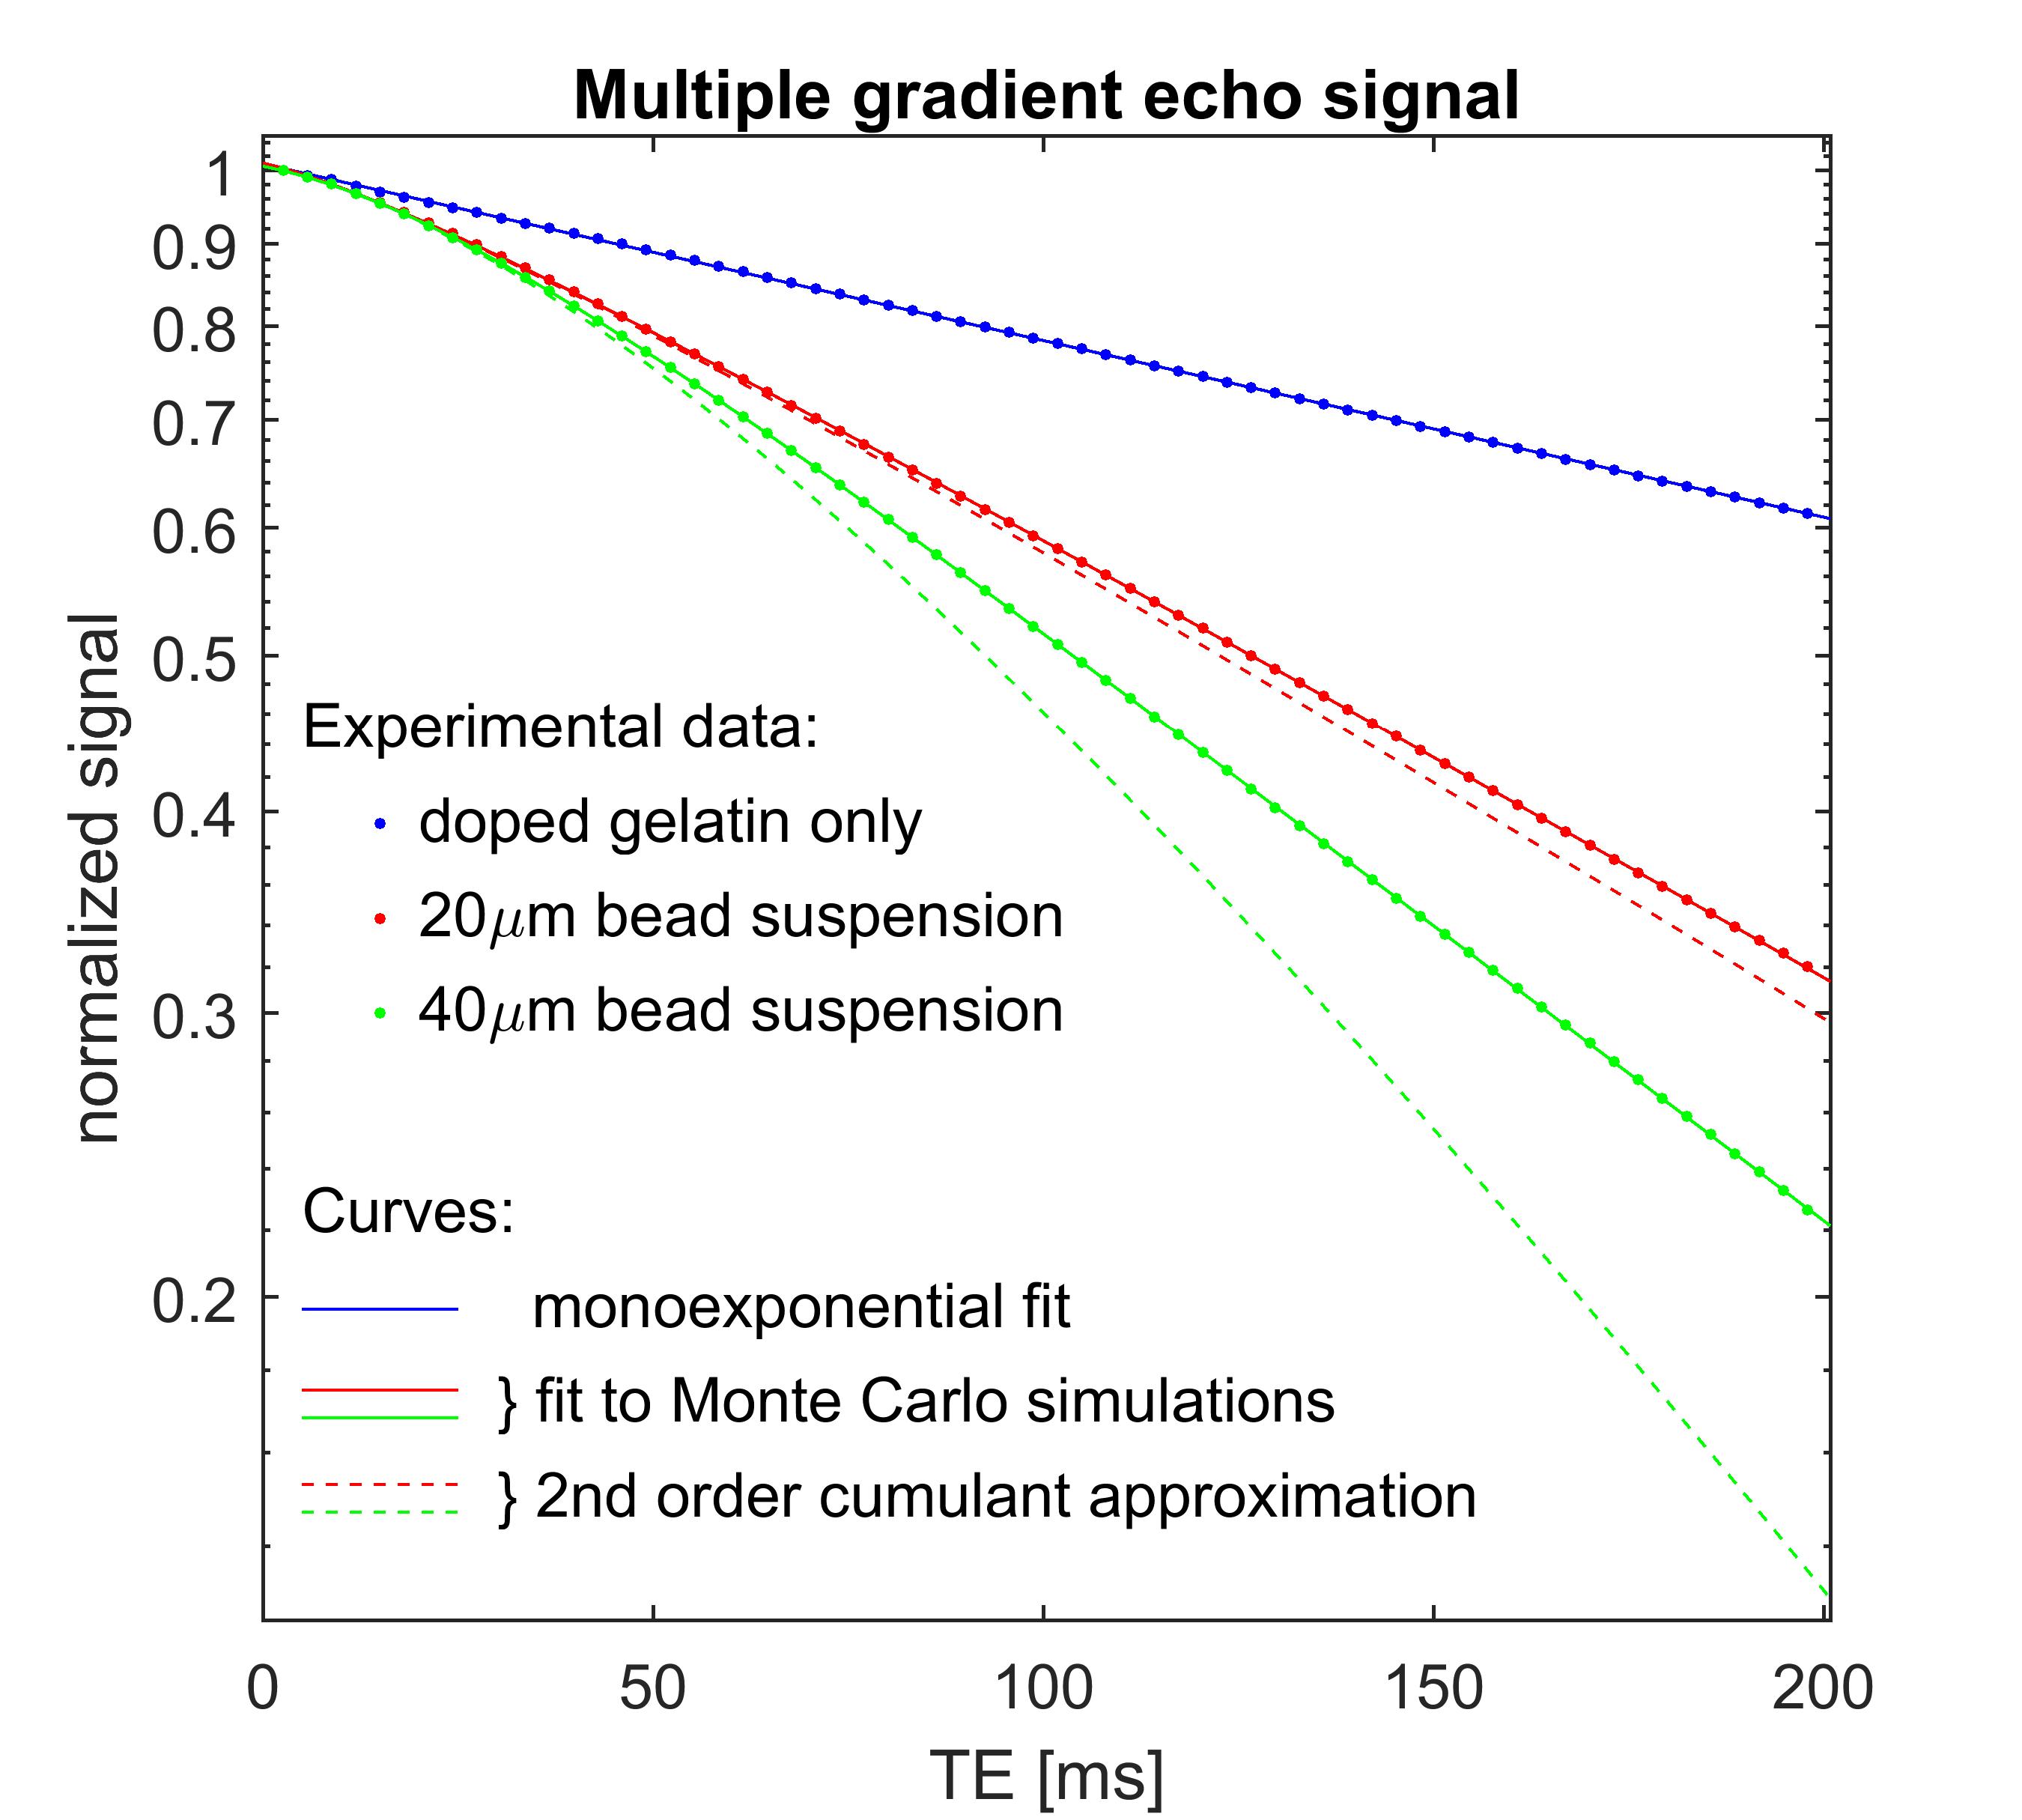
Figure 3 shows fits of the MGRE signals from the colloidal suspensions (dots) to the MC results (solid lines). The signal from the control solution of doped gelatin is fitted to a monoexponential decay. Note that the signal decay rates of the colloidal suspensions converge to that of the doped gelatin, $$$R_2$$$, as TE$$$\rightarrow$$$0. The dashed curves show the signal calculated from the second-order cumulant approximation in equation (1) by evaluating the variance of the phases $$$\left\langle\phi^2\left(t_i\right)\right\rangle$$$ over the 720,000 random walkers. The fact that the dashed curves deviate substantially from the solid curves, especially at long $$$t$$$, shows that the second-order cumulant expansion is a poor approximation in this regime.
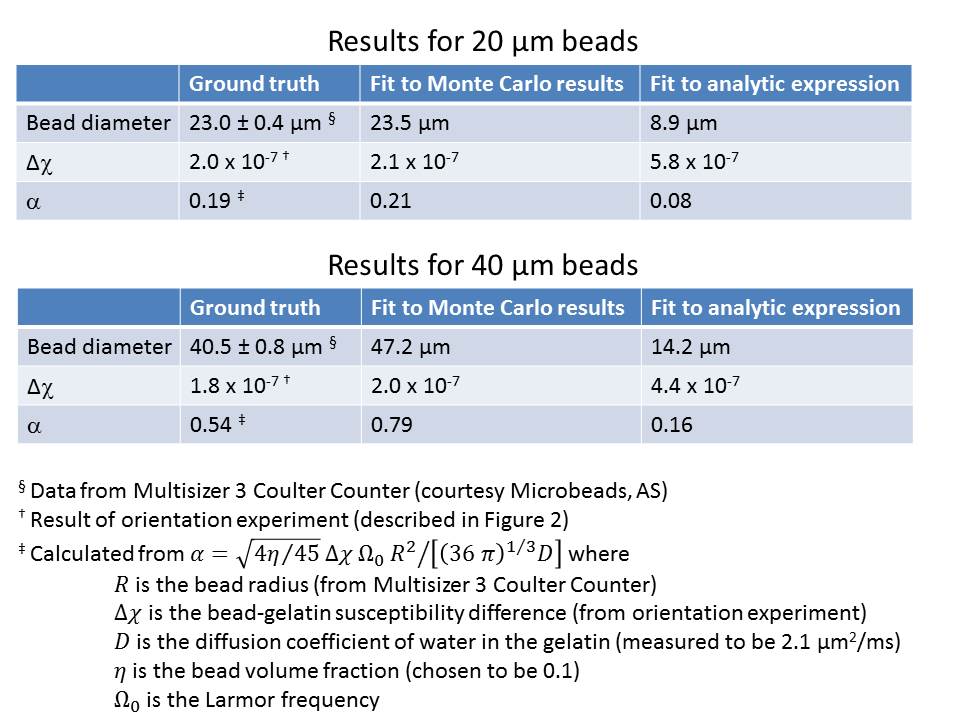
The experimental data were also fitted to an analytic expression for the signal, obtained by substituting equation (2) into equation (1). Table 1 compares estimates of the bead diameter and bead-gelatin susceptibility difference obtained from the Monte Carlo and analytic fits with the ‘ground truth’ values. The fact that the analytic results exhibit poor agreement with the ground truth is due in large part to truncation of the cumulant expansion in equation (1).
Discussion and conclusions:
We have shown that properties of magnetic microstructure can be quantified by fitting to the results of Monte Carlo simulations. The second-order cumulant expansion is a poor approximation at long echo times, even for relatively small values of the dephasing strength $$$\alpha<1$$$. Using these data, we plan to evaluate second-order results for spheres$$$^{5,6}$$$, as well as non-perturbative methods$$$^9$$$.Acknowledgements
We would like to thank Lene Karlberg Bjørndal, Senior Research Scientist at Microbeads AS, Norway, for supplying the microscopy images and size data for the polystyrene microbeads. This work was supported in part by NIH grants NIH NS039135 and P41 EB017183.References
1. Yablonskiy DA, Haacke EM. Theory of NMR signal behavior in magnetically inhomogeneous tissues: the static dephasing regime. Magn Reson Med. 1994 Dec;32(6):749-63.
2. Kiselev VG, Posse S. Analytical Theory of Susceptibility Induced NMR Signal Dephasing in a Cerebrovascular Network. Phys. Rev. Lett. 81, 5696 (1998)
3. Jensen JH, Chandra R. NMR relaxation in tissues with weak magnetic inhomogeneities. Magn Reson Med. 2000 Jul;44(1):144-56.
4. Kiselev VG, Novikov DS. Transverse NMR Relaxation as a Probe of Mesoscopic Structure. Phys. Rev. Lett. 89, 278101 (2002)
5. Sukstanskii AL, Yablonskiy DA. Gaussian approximation in the theory of MR signal formation in the presence of structure-specific magnetic field inhomogeneities. J Magn Reson. 2003 Aug;163(2):236-47.
6. Sukstanskii AL, Yablonskiy DA. Gaussian approximation in the theory of MR signal formation in the presence of structure-specific magnetic field inhomogeneities. Effects of impermeable susceptibility inclusions. J Magn Reson. 2004 Mar;167(1):56-67.
7. Jensen JH, Chandra R, Ramani A, Lu H, Johnson G, Lee SP, Kaczynski K, Helpern JA. Magnetic field correlation imaging. Magn Reson Med. 2006 Jun;55(6):1350-61
8. Skoge M, Donev A, Stillinger F H, Torquato S. Packing Hyperspheres in High-Dimensional Euclidean Spaces, Phys. Rev. E, 74:041127, 2006
9. Novikov DS, Kiselev VG. Transverse NMR relaxation in magnetically heterogeneous media. J Magn Reson. 2008:195,33-39.
Figures