5492
A procedure to scale myelin water fraction to myelin volume fraction for g-ratio mapping1Department of Electrical and Computer Engineering, Seoul National University, Seoul, Republic of Korea, 2Department of Radiology, Seoul St. Mary's Hospital, College of Medicine, The Catholic University of Korea, Seoul, Republic of Korea
Synopsis
In this study, we propose a new scaling approach that translates myelin water fraction into myelin volume fraction using the geometric property of myelin. The method is validated by a histo-imaging dataset. A computer simulation is performed to demonstrate the robustness of the method.
Introduction
Myelin water imaging (MWI) provides myelin water fraction (MWF) as a quantitative measure of myelin concentration in a voxel.1 Recently, myelin volume fraction (MVF), which includes both myelin water volume (MWV) and myelin lipid volume (MLV) in a voxel has become an important parameter for quantitative microstructural imaging (e.g. g-ratio mapping).2,3 Although MWF and MVF are closely related, a scaling process is necessary. This study proposed a new approach of scaling MWF to MVF by utilizing the geometry of myelin.Methods
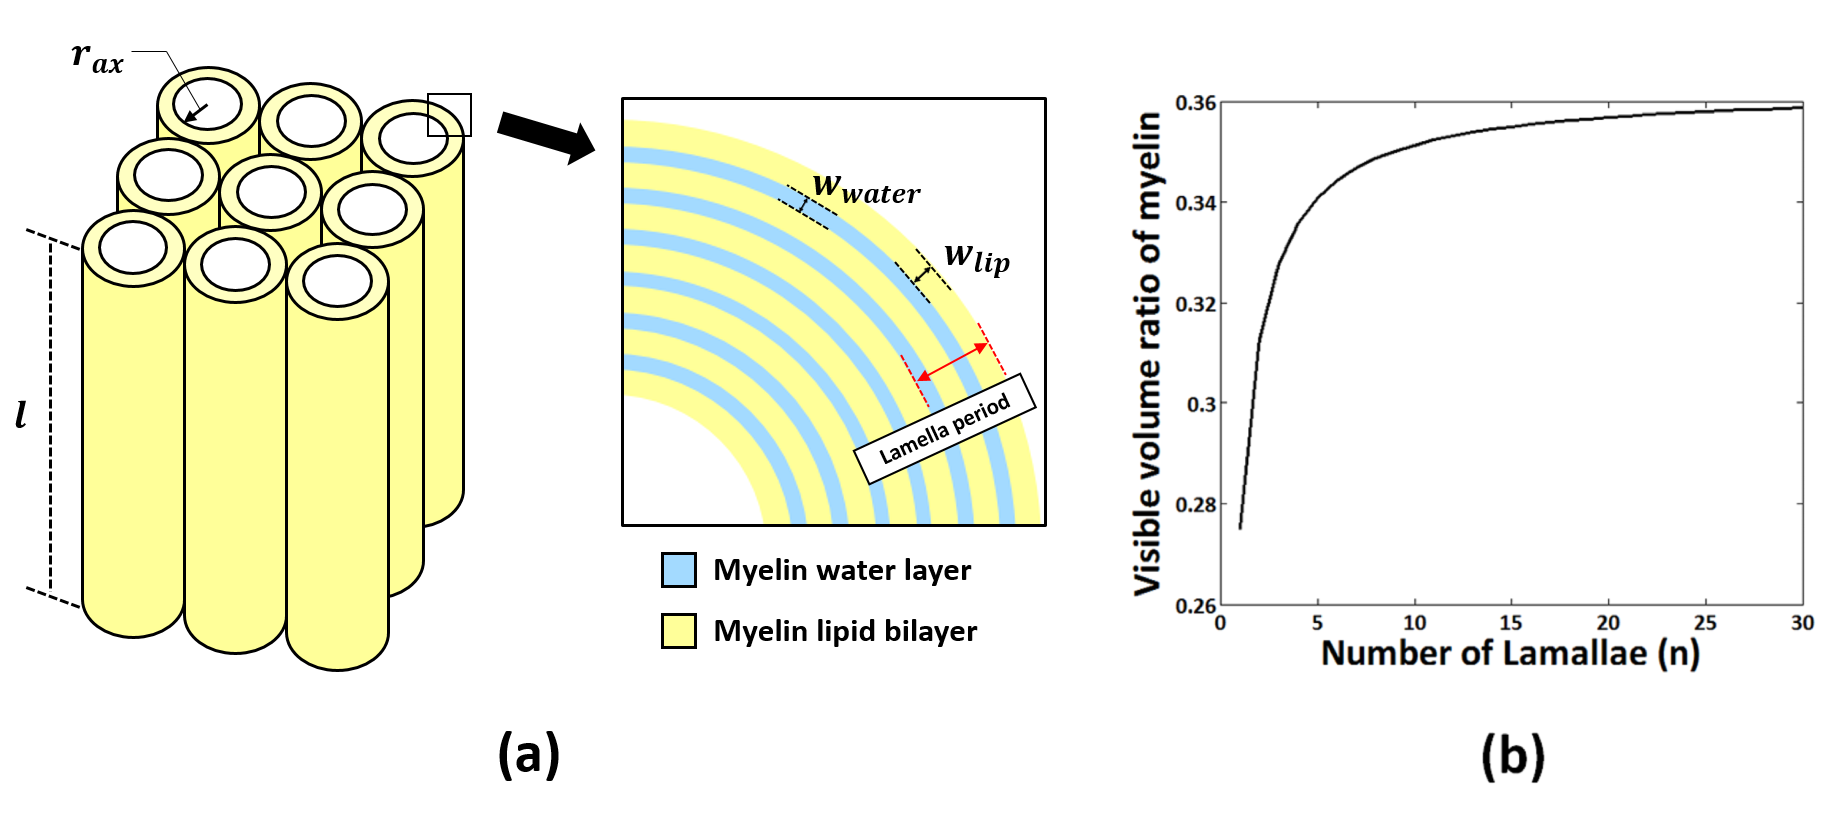
[Scaling process] In MWI, the signal amplitude (A) of each compartment (myelin (my), axon (ax), and extracellular space (ex)) is proportional to its volume (V) and MR-visible volume ratio ($$$κ$$$=MR-visible volume/total volume of the compartment):$$A∝κ·V.\qquad(1)$$Then, MVF is expressed as follows:$$MVF=\frac{V_{my}}{V_{my}+V_{ax}+V_{ex}}=\frac{A_{my}/κ_{my}}{A_{my}/κ_{my}+A_{ax}/κ_{ax}+A_{ex}/κ_{ex}}.\qquad(2)$$To estimate $$$κ_{my}$$$, we calculated MR-visible myelin volume and the total myelin volume using the geometry of myelin. The total volume of myelin consists of MWV and MLV, of which only MWV is considered to be MR-visible volume. Considering the length ($$$l$$$) of the myelinated axon with the number of lamellae (n) (Fig. 1a), MWV and MLV volume are calculated as the sum of the alternating volumes of the concentric cylinders:$$MWV=∑_{i=1}^{2n}π [\{(w_{lip}+w_{water})×i+r_{ax}\}^2-\{(w_{lip}+w_{water})×i-w_{water}+r_{ax}\}^2 ]×l\qquad(3)$$ $$MLV=∑_{i=0}^{2n}π[\{(w_{lip}+w_{water})×i+w_{lip}+r_{ax}\}^2-\{(w_{lip}+w_{water})×i+r_{ax}\}^2 ]×l\qquad(4)$$where $$$w_{lip}$$$ and $$$w_{water}\:$$$ represent the thickness of the lipid layer and water layer, and $$$r_{ax}$$$ is the inner radius of the axon (Fig. 1a). Then, $$$κ_{my}$$$ is expressed as$$κ_{my}=\frac{MWV}{MWV+MLV}=\frac{w_{water}}{(1+\frac{1}{2n})w_{lip}+w_{water}}.\qquad(5)$$In axon and extracellular compartments, their MR-visible and MR-invisible volumes were calculated using their mass and density measurements. Assuming that the two compartments have the same ratio, 4 axonal&extracellular water volume (AWV) and axonal&extracellular non-water volume (ANWV) are expressed as$$AWV=m_{ax\&ex\_water}/ρ_{ax\&ex\_water}\qquad(6)$$ $$ANWV=m_{ax\&ex\_non-water}/ρ_{ax\&ex\_non-water}\qquad(7)$$where $$$m$$$ and $$$ρ$$$ represent the mass and density, respectively. Then, $$$κ_{ax}$$$ and $$$κ_{ex}$$$ are obtained using$$κ_{ax}=κ_{ex}=\frac{AWV}{AWV+ANWV}.\qquad(8)$$
[Parameters of scaling factors] All parameters for scaling process were from literature values of mammalian CNS. For $$$κ_{my}$$$, $$$w_{lip}$$$ and $$$w_{water}$$$ were set to be 51Å and 29Å, respectively.5 For $$$κ_{ax}$$$ and $$$κ_{ex}$$$, $$$m_{ax\&ex\_water}=0.638g/gWM$$$, $$$m_{ax\&ex\_non-water}=0.14g/gWM$$$, $$$ρ_{ax\&ex\_water}=1g/ml$$$, and $$$ρ_{ax\&ex\_non-water}=1.33g/ml$$$ were used (gWM:1g of white matter).6
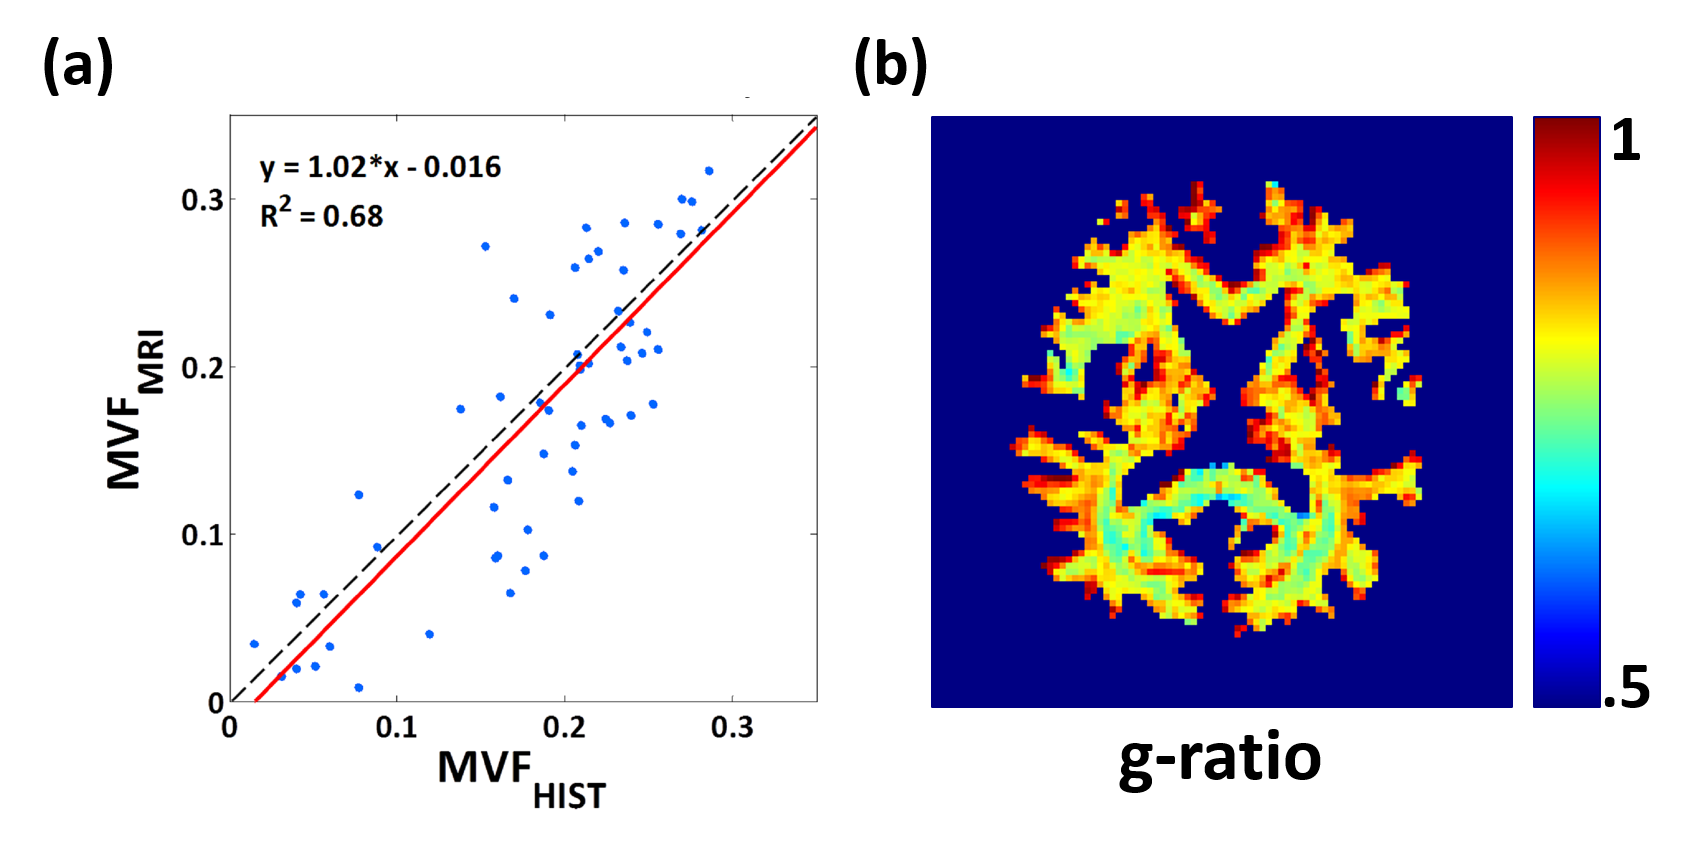
[Validation] To validate the scaling factors, an existing histo-imaging dataset was utilized.7 The dataset contained histologically measured MVF (MVFHIST) and MR-measured MWF from MWI. Using the proposed scaling factors, we translated MR-measured MWF into MVF (MVFMRI). Then, MVFMRI and MVFHIST were compared.3
[Experiment] MWF was estimated by using multi-echo gradient-echo (GRE) MWI described in Jung et al.3 Then, MWF was scaled to MVF using Equation (2). For axonal volume fraction (AVF), neurite density and orientation dispersion imaging (NODDI) was acquired. g-ratio was calculated using MVF and AVF maps. The scan parameters were as follows: GRE: FOV=256×208mm2, TR=1400ms, TE=2.5:2.2:40ms, flip angle=83°, voxel size=2×2mm2, thickness=2mm. NODDI: three-shell diffusion weighted imaging data (b=300s/mm2, 700s/mm2 and 2000s/mm2 with 8, 32 and 64 directions, respectively; b=0s/mm2 with 13 averages) were acquired using a spin-echo EPI sequence with TR/TE=4000/95ms, FOV=192×192mm2, voxel size=2×2mm2, thickness=2mm.
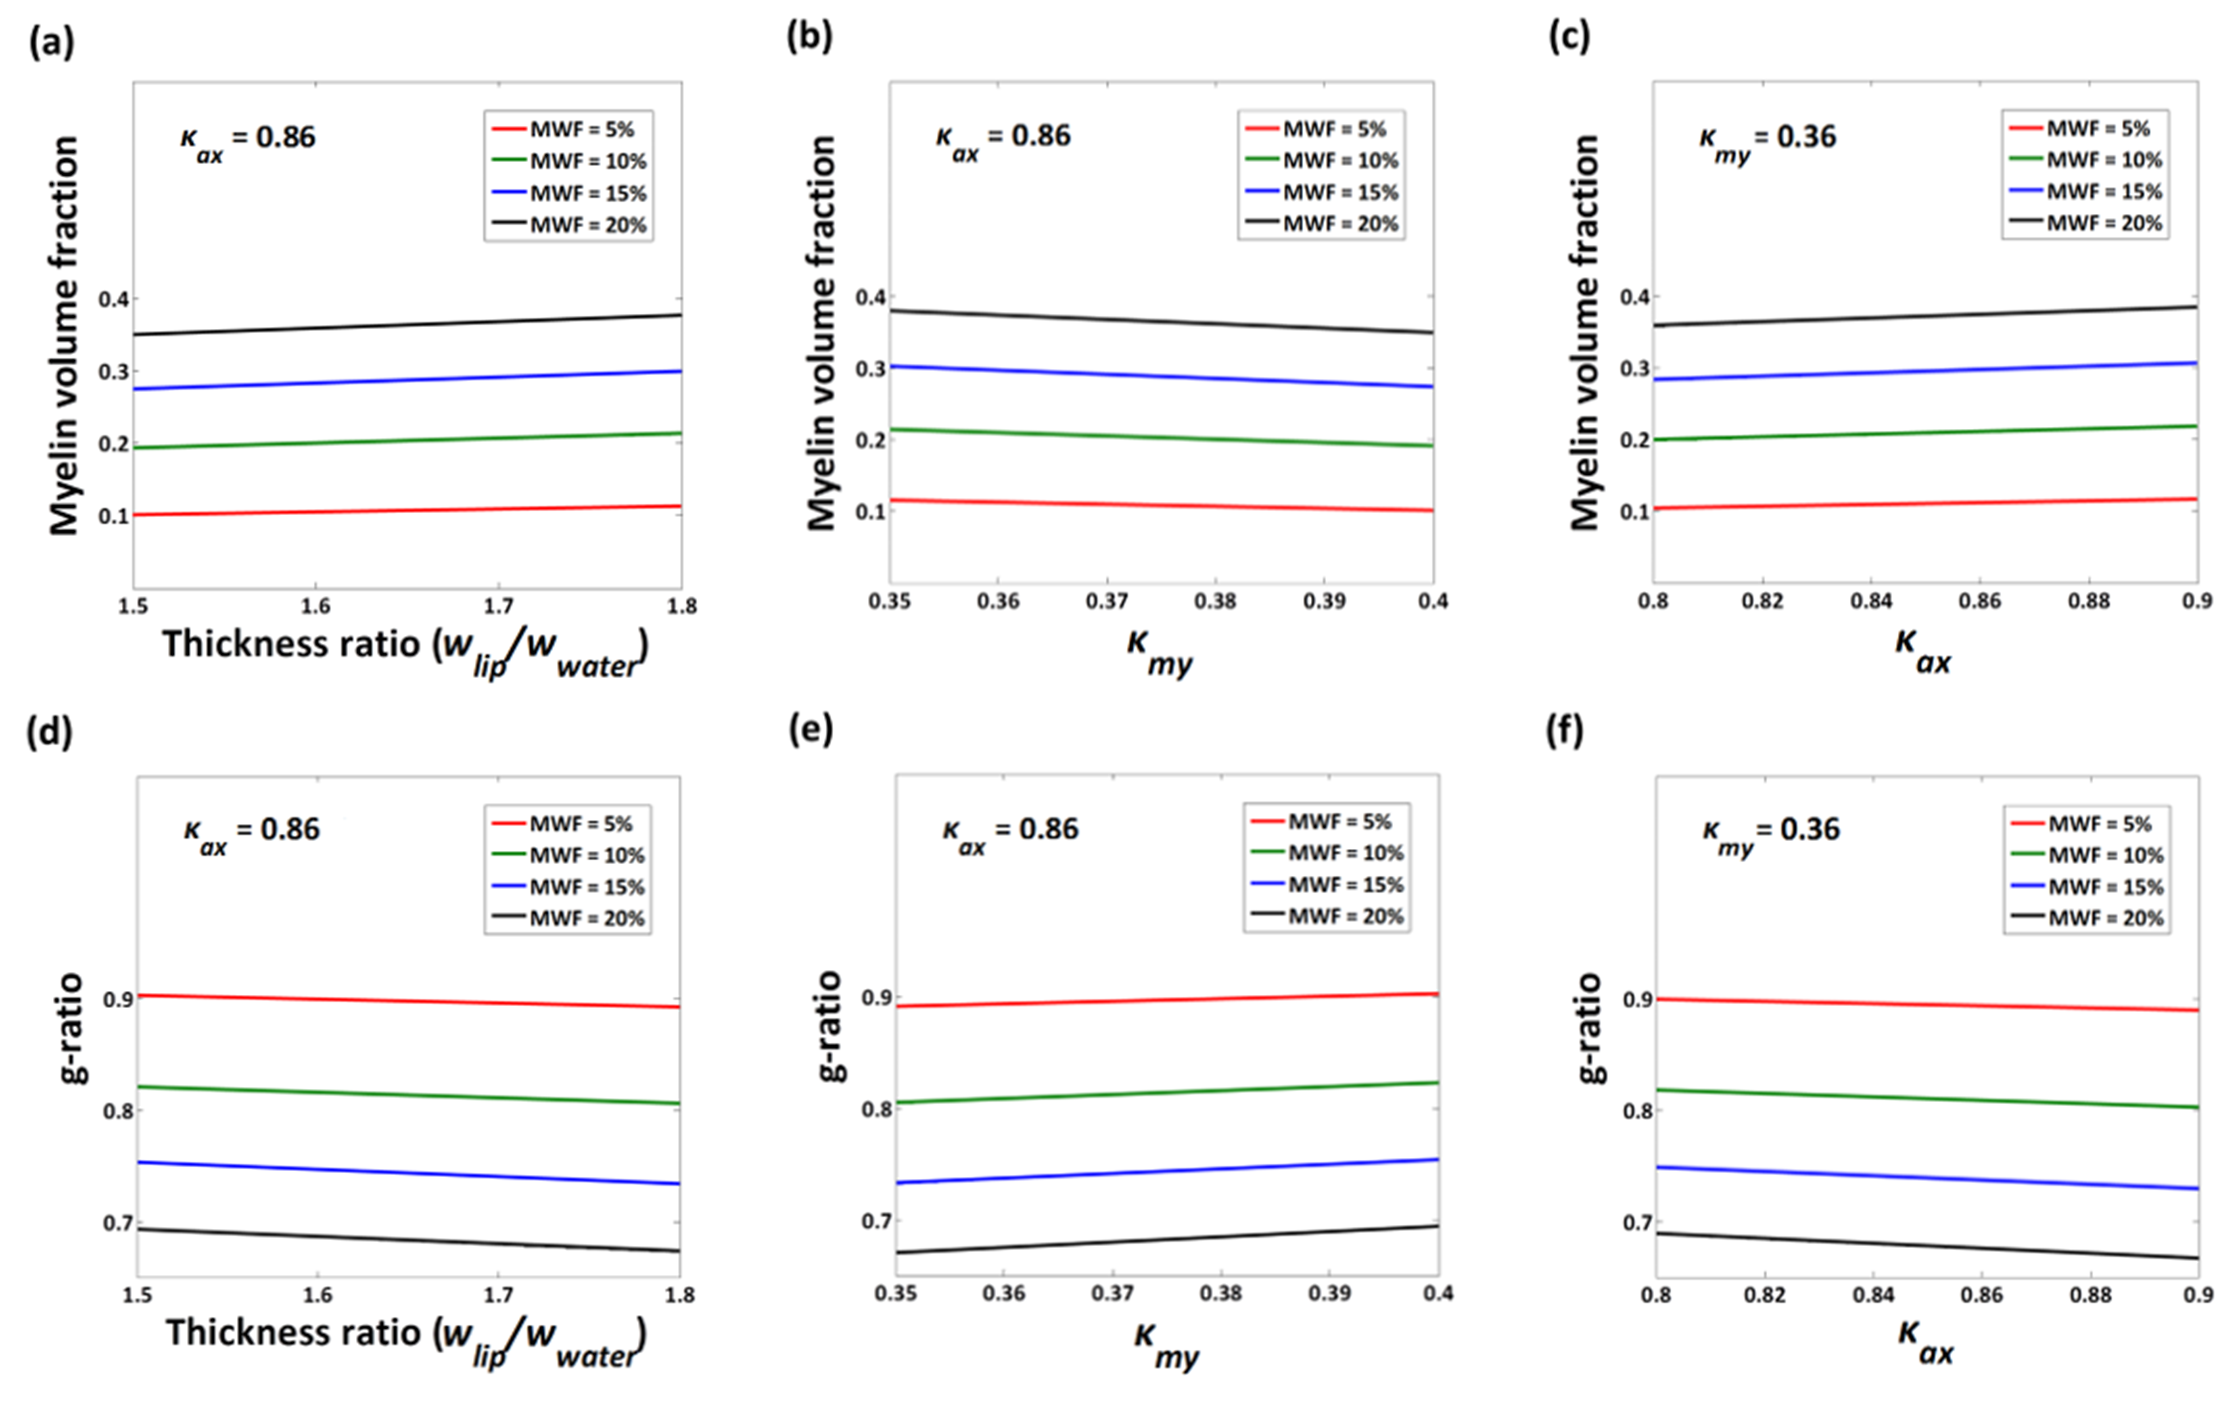
[Simulation] To investigate the robustness of the scaling factors, we performed a computer simulation. Three parameters, thickness ratio (=$$$w_{lip}/w_{water}$$$), $$$κ_{my}$$$ and $$$κ_{ax}$$$ (=$$$κ_{ex}$$$), were varied and the resulting MVF and g-ratio were calculated. The range of each parameter was based on the literature values of mammalian CNS:
- Thickness ratio: 1.5~1.8 (1.55 in rabbit optic nerve and 1.73 in rat optic nerve) 5,8
- $$$κ_{my}$$$: 0.35~0.4 (0.36, 0.38, and 0.4) 3,9
- $$$κ_{ax}$$$: 0.8~0.9 (0.8, 0.82, 0.86, and 0.9) 3,9-11
Results
$$$κ_{my}$$$ was 0.36 when the average number of lamellae (=15) in mammalian CNS nerves 12 was used (Fig. 1b), and $$$κ_{ax}$$$ (=$$$κ_{ex}$$$) was 0.86. When applying these scaling factors to the histo-imaging dataset, 7 the result showed a good correspondence between MVFMRI and MVFHIST with an almost perfect regression line (y=1.02x+0.016) and a high R2 value (=0.69), validating the proposed scaling approach (Fig. 2a). The resulting in-vivo g-ratio map was around 0.79 in white matter as shown in Fig. 2b.
In the computer simulation, no substantial change in MVF and g-ratio was observed for the ranges of the parameter variations (Fig. 3). When the thickness ratio or $$$κ_{my}$$$ or $$$κ_{ax}$$$ was changed, the fractional variation of MVF was less than 7% and that of g-ratio value was less than 2.5%. Hence, the variations in the scaling parameters had limited influences on MVF and g-ratio values, indicating the robustness of the scaling factor.
Discussion and Conclusion
In this study, we proposed a scaling approach that converts MWF to MVF and demonstrated the robustness of the method. When the proposed scaling factors were applied to MWI, the resulting g-ratio values were estimated at around 0.79. These results are in agreement with previous histological studies show the g-ratio in mammalian CNS to be at around 0.77.3Acknowledgements
We sincerely thank Drs. Mark D. Does and Kathyrn L. West for sharing histo-imaging data. This research was supported by Basic Science Research Program through the National Research Foundation of Korea(NRF) funded by the Ministry of Science, ICT & Future Planning(2017R1A2B2008412).References
[1] Mackay, Alex, et al. "In vivo visualization of myelin water in brain by magnetic resonance." Magnetic Resonance in Medicine 31.6 (1994): 673-677.
[2] Stikov, Nikola, et al. "Bound pool fractions complement diffusion measures to describe white matter micro and macrostructure." Neuroimage 54.2 (2011): 1112-1121.
[3] Jung, Woojin, et al. "Whole brain g-ratio mapping using myelin water imaging (MWI) and neurite orientation dispersion and density imaging (NODDI)." NeuroImage (2017).
[4] Norton, William T., and Wendy Cammer. "Isolation and characterization of myelin." Myelin. Springer US, 1984. 147-195.
[5] Finean, J. B. "The nature and stability of the plasma membrane." Circulation 26.5 (1962): 1151-1162.
[6] Laule, C., et al. "Water content and myelin water fraction in multiple sclerosis." Journal of neurology 251.3 (2004): 284-293.
[7] West, Kathryn L., et al. "Myelin volume fraction imaging with MRI." NeuroImage (2016).
[8] Kirschner, D. A., and D. L. D. Caspar. "Comparative diffraction studies on myelin membranes." Annals of the New York Academy of Sciences 195.1 (1972): 309-320.
[9] Finean, J. B. "Electron microscope and x-ray diffraction studies of the effects of dehydration on the structure of nerve myelin." The Journal of Cell Biology 8.1 (1960): 13-29.
[10] van der Knaap, Marjo S., and Jaap Valk. "Myelin and white matter." Magnetic resonance of myelination and myelin disorders (2005): 1-19.
[11] LoPachin, Richard M., Carolyn M. Castiglia, and Albert J. Saubermann. "Elemental composition and water content of myelinated axons and glial cells in rat central nervous system." Brain research 549.2 (1991): 253-259.
[12] Mierzwa, Amanda, Seema Shroff, and Jack Rosenbluth. "Permeability of the paranodal junction of myelinated nerve fibers." Journal of Neuroscience 30.47 (2010): 15962-15968.
Figures