5491
Myelin water fraction across the corpus callosum using multi-echo gradient echo at 7T - influence of model settings and flip angle1Center for Advance Imaging, The University of Queensland, Brisbane, Australia
Synopsis
Proper quantitative assessment of myelin water fraction (MWF) using a multi-compartment model can be useful in improving our understanding of white matter diseases, however, MWF model estimates have been shown to be affected by model settings and also by T1 values of the myelin compartment. In this study, we investigated three common models using different number of parameters to assess MWF across the corpus callosum and the influence of acquisition flip angle at 7T.
INTRODUCTION
Frequency shifts mapped as a function of echo time from ultra-high field gradient-echo (GRE) MRI data show distinct variations, which have been suggested to be influenced by white matter microstructure.1,2 The variation in these values can be explained by compartmentalising the voxel signal into distinct signal compartments (myelin, axonal and extracellular) in white matter,3-5 but different model settings used to estimate the myelin water fraction (MWF) yield different results.6 We hypothesised that MWF estimates depend on the parametrisation used, specifically the inclusion of a background frequency shift and noise floor parameter, as well as the flip angle (FA) used in the acquisition, owing to a largely different T1 relaxation time of the myelin versus the other tissue compartments (axonal and extracellular compartments).7 In this study, we therefore investigated this dependence in MWF by acquiring data with two different FAs using three differently parameterized models. We estimated MWF across the sagittal midline of the corpus callosum (CC), which is known to have variation in myelin level and axon radii.8METHODS
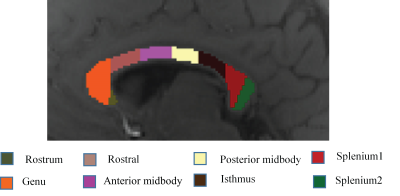
The study was approved by the local human ethics committee and written informed consent was obtained from five healthy volunteers (aged 28-32). The data were acquired using a multi-echo 3D GRE-MRI sequence on a 7T whole-body MRI research scanner (Siemens Healthcare, Erlangen, Germany) with a 32-channel head coil (Nova Medical, Wilmington, USA) using two different FAs: TE1=2.04ms with echo spacing of 1.53ms and 30 echoes, TR=51ms, FA = 20º and 50º, voxel-size=1mm$$$\times$$$1mm$$$\times$$$1mm and matrix size=210$$$\times$$$168$$$\times$$$144. Brain masks were created using MIPAV (Medical Imaging Processing and Visualisation, https://mipav.cit.nih.gov).9 iHARPERELLA (http://people.duke.edu/~cl160,STI Suite)10 was used to compute tissue phase at each echo point from which 30 frequency shift maps were generated for each participant. The CC was manually segmented into eight regions using a standardised template,11 regions shown in Fig.1. Signal fitting was performed using three different models2,4,12 assuming three tissue compartments given in Eqs. (1-3).
$$s\left(t\right)=\left[A_{my}e^{-\left(\frac{1}{T_2^*my}+i2\pi\Delta f_{my}\right)t}+A_{ax} e^{-\left(\frac{1}{T_2^*ax}+i2\pi\Delta f_{ax}\right)t}+A_{ex}e^{-\left(\frac{1}{T_2^*ex}+i2\pi\Delta (f_{ex}\right)t}+C\right]e^{-i2\pi\Delta f_{bg}t} \qquad (1)$$
$$s\left(t\right)=\left[A_{my}e^{-\left(\frac{1}{T_2^*my}+i2\pi\Delta f_{my}\right)t}+A_{ax} e^{-\left(\frac{1}{T_2^*ax}+i2\pi\Delta f_{ax}\right)t}+A_{ex}e^{-\left(\frac{1}{T_2^*ex}+i2\pi\Delta f_{ex}\right)t}\right]\qquad \qquad(2)$$
$$s\left(t\right)=\left[A_{my}e^{-\left(\frac{1}{T_2^*my}+i2\pi\Delta f_{my}\right)t}+A_{ax} e^{-\left(\frac{1}{T_2^*ax}+i2\pi\Delta f_{ax}\right)t}+A_{ex}e^{-\left(\frac{1}{T_2^*ex}\right)t}\right] \qquad \qquad \qquad \quad(3)$$
where Amy, Aax and Aex are volume fractions for the myelin, axonal, and extracellular compartments, respectively, and corresponding T2,my*, T2,ax* and T2,ex* and $$$\Delta$$$fmy, $$$\Delta$$$fax and $$$\Delta$$$fex are the compartment relaxation times and frequency shifts. In eq.1 any remaining background frequency shift should be captured in the additional parameter $$$\Delta f_{bg}$$$ and the constant term $$$(C)$$$ should account for the noise floor in the measured data (11 parameter model–M11)12. A model without background offset reduces to a 9 parameter model (M9)13, and additionally fixing the extracellular frequency shift leads to an 8 parameter model (M8).4,6 Fitting was performed in MATLAB (MathWorks, Natick, MA) using nonlinear curve fitting method for both FA data sets. The model performance was assessed by computing the standard error. We performed one-way ANOVA to test whether the MWF and error rate have significant differences between models at both flip angles.
RESULTS
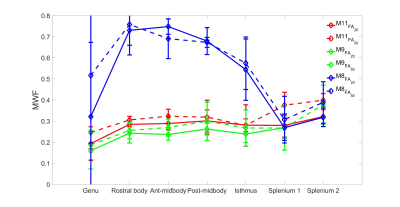
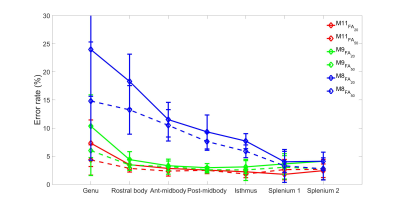
MWF was estimated for both FA data sets using three different models (M11,M9,M8) shown in Fig.2. We found that the inclusion of background offset and noise accounting term $$$(C)$$$ in M11 yields the lowest average error rate in all ROIs, with a slight increase in error for M9 which excludes $$$\Delta f_{bg}$$$ and $$$C$$$, whereas exclusion of the frequency information leads to the highest error rate (M8), as shown in Fig.3. The error rate for M11 model was significantly lower than other two models (p<0.0000030) for both FA except M9 (for FA=50º). Models M9 and M8 also showed significant difference (p<0.0000006) for both FA. The change in MWF from FA 20º to 50º was significantly different (p<0.000236) only in M11 model with higher change at the genu and splenium of CC as shown in Fig.2 and Tab.1.DISCUSSION AND CONCLUSION
The change of myelin water fraction between two different flip angles could indicate a bias due to the different T1 relaxation time in the myelin compartment as suggested in Hongpyo et al.7 The higher flip angle leads to a systematically increased larger MWF estimate in our study,14 which could be compensated by correcting the T1 effect.7 Our study suggest that an 11 parameter model (M11) yields lower error rate than the other two models that exclude background and frequency parameters (M9 and M8), however, M9 performs very similar in terms of error rate with a reduced number of parameters suggestive of good MWF estimates for both models (M9 and M11). The high error rate of the 8 parameter model (M8) shows the necessity of including the frequency shifts of all three different compartments.Acknowledgements
MB acknowledges funding from Australian Research Council Future Fellowship grant FT140100865. SB acknowledges funding from UQ Postdoctoral Research Fellowship grant and an NVIDIA Hardware Seed Grant. The authors acknowledge the facilities of the National Imaging Facility (NIF) at the Centre for Advanced Imaging, University of Queensland. VV would also like to thank the Australian Research Council for discovery grant funding (DP140103593).References
1. Wharton, S. & Bowtell, R. Fiber orientation-dependent white matter contrast in gradient echo MRI. Proc. Natl. Acad. Sci. U. S. A. 109, 18559–18564 (2012).
2. Sati, P. et al. In vivo quantification of T2* anisotropy in white matter fibers in marmoset monkeys. NeuroImage 59, 979–985 (2012).
3. Nam, Y., Lee, J., Hwang, D. & Kim, D.-H. Improved estimation of myelin water fraction using complex model fitting. NeuroImage 116, 214–221 (2015).
4. van Gelderen, P. et al. Non-exponential T2* decay in White Matter. Magn. Reson. Med. 67, 110–117 (2012).
5. Thapaliya, K., Bollmann, S., Vegh, V. & barth, M. Signal Compartments Modelled from 7T Multi-Echo GE Data Showed Variation Across the Corpus Callosum. in Proc. Intl. Soc. Mag. Reson. Med. 25 (2017).
6. Alonso-Ortiz, E., Levesque, I. R. & Pike, G. B. Impact of magnetic susceptibility anisotropy at 3 T and 7 T on T2*-based myelin water fraction imaging. NeuroImage (2017).
7. Hongpyo, L., Yoonho, N., Dong-Hyun, K. & Hongpy, L. Effect of T1 on Multi-echo Gradient Echo based Myelin Water Fraction. in Proc. Intl. Soc. Mag. Reson. Med. 25 (2017).
8. Aboitiz, F., Scheibel, A. B., Fisher, R. S. & Zaidel, E. Fiber composition of the human corpus callosum. Brain Res. 598, 143–153 (1992).
9. McAuliffe, M. J. et al. Medical Image Processing, Analysis and Visualization in clinical research in 14th IEEE Symposium on Computer-Based Medical Systems, 2001. CBMS 2001. Proceedings 381–386 (2001). doi:10.1109/CBMS.2001.941749
10. Li, W., Avram, A. V., Wu, B., Xiao, X. & Liu, C. Integrated Laplacian-based phase unwrapping and background phase removal for quantitative susceptibility mapping. NMR Biomed. 27, 219–227 (2014).
11. Witelson, S. F. Hand and Sex Differences in the Isthmus and Genu of the Human Corpus Callosum. Brain 112, 799–835 (1989).
12. Thapaliya, K., Vegh, V., Bollmann, S. & Barth, M. Assessment of microstructural signal compartments across the corpus callosum using multi-echo gradient recalled echo at 7 Tesla. NeuroImage (2017) (Under Revision).
13. Sati, P. et al. Micro-compartment specific T2⁎ relaxation in the brain. NeuroImage 77, 268–278 (2013).
14. Oh, S.-H. et al. Direct visualization of short transverse relaxation time component (ViSTa). NeuroImage 83, 485–492 (2013).
Figures


